
Probability Theory in the Service of the Crypto Trader: the Bayesian BBSMA Oscillator Indicator

Probability is not magic, but a cold calculation. It is the language of uncertainty spoken by reality. Working with it means making decisions in foggy conditions, where the only flashlight is mathematics.
Working with the market means working with probabilities, and therefore, to increase trading success, the corresponding mathematical theories can be applied.
In 1900, the dissertation of mathematician Louis Bachelier was published, in which he showed the possibility of effective options trading using the Brownian motion model. The dissertation was called "Theory of Speculation."
In modern algorithmic trading, various mathematical models with a mandatory probabilistic component are used. Powerful indicators such as Bayesian BBSMA Oscillator use probability theory to evaluate expected market behavior.
More about what the Bayesian BBSMA Oscillator indicator is and how to use it is below the cut.
The trader's main tasks in assessing the probability of key events in the markets
The first task of any trader is to assess the probability of the appearance of a directional move, i.e., the exit of the traded asset from the balance zone (consolidation).
The second task on the list, but not in importance is to assess the probable direction of the expected move: northward or southward, up or down.
The third, no less important task is to assess the probable strength of the move.
The fourth task of the trader is to determine the probable time when the move begins.
The fifth task of the trader is to determine the probable entry point taking risk management into account.
The sixth task of the trader is to exit at the probable stopping point with profit if it is not rigidly set by the take-profit level.

Both in Metatrader and in TradingView, you can find dozens and even hundreds of various probabilistic indicators. But many of them are not very informative, which makes them, if not useless for the trader, then clearly unnecessarily complex to interpret.
However, in TradingView there is an indicator that is not yet very popular, but shows results sufficient for use in speculative trading. This indicator is called Bayesian BBSMA Oscillator.
What the Bayesian BBSMA Oscillator indicator is in simple words
The Bayesian BBSMA Oscillator indicator is based on Bayes' probabilistic theorem, which is quite popular among professional traders. The strength of Bayes' theorem is that it predicts quite well the statistical probability of some event that may follow an actual event.

The probability of subsequent events is assessed by the Bayesian BBSMA Oscillator indicator on the basis of data obtained from the popular and still working Bollinger Bands and the moving averages (MA), ancient as the world but reliable as a Kalashnikov rifle. Bill Williams indicators have also been added to Bayesian BBSMA Oscillator; by default they are turned off.
Originally, the indicator was conceived for cryptocurrency scalping and was optimized for work on the 1-hour timeframe. When developing the oscillator, the author of the Bayesian BBSMA indicator proceeded from the following assumptions.
Bollinger Bands:
- Prices breaking upward through the lower Bollinger line have a probability of further growth.
- Prices breaking downward through the upper Bollinger line have a high probability of further decline.
Moving averages with a smaller period (MA):
- Prices located above the MA have an increased probability of a corrective decline.
- Prices located below the MA have an increased probability of corrective growth.
In June 2020, the Bayesian BBSMA Oscillator indicator was included in the "Best Scripts of the Month" selection on the TradingView portal.
Interpretation of Bayesian BBSMA Oscillator signals
There are two variants for interpreting the signals of the Bayesian BBSMA oscillator.
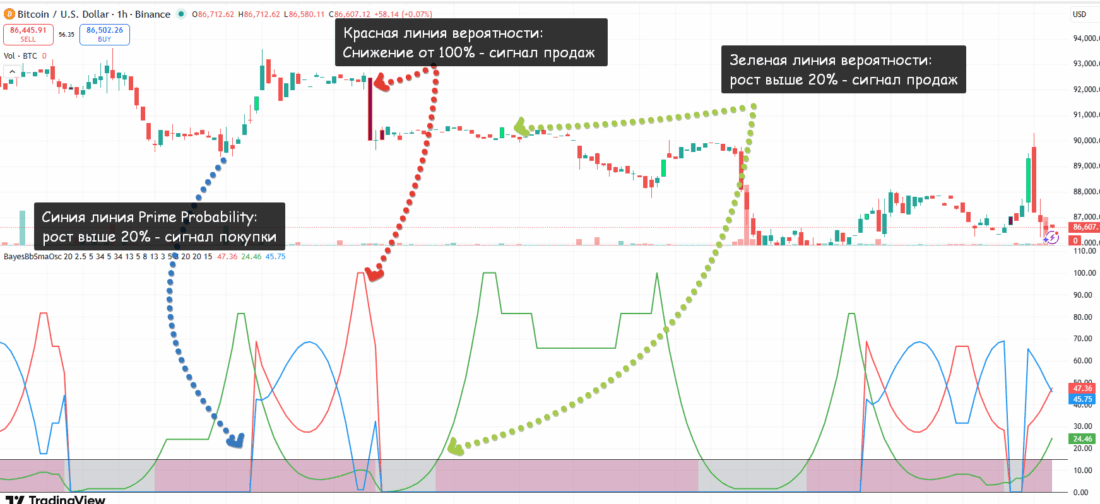
The first interpretation variant is the author's, but the author himself is an amateur trader, not a professional market participant. The second interpretation variant is recommended by a professional trader with millions of dollars under management both in the stock market and, for some time now, in the crypto market.
Author's interpretation of the signals of the Bayesian BBSMA Oscillator indicator
All default values in the indicator are configured for BTCUSDT on the hourly timeframe.
The initial interpretation of the indicator's signals looked as follows:
- Green means the probability of the quote rising.
- Red means the probability of the quote declining.
- Strong signal. When the green or red line reaches the ceiling (100%), when the probability declines on the next candle you can open a short position on the decrease of the green line and a long position on the increase of the red line.
- If the ceiling and the bottom are "flat," it is not worth taking any action.
- Weak signal. When the green or red line begins to rise, you can open a short or long position.
Later, the author of the indicator expanded and clarified his recommendations:
- The lower threshold area in gray signals a sideways market (balance). This is not the best time and place for trading.
- A buy signal appears if the main probability (the green line) changes from zero to a value above the lower threshold (20%).
- A buy signal also appears if the probability of an upward breakout changes from 100% to a value below 100% (the green line).
- A sell signal appears if the main probability falls from a value above the lower threshold (20%) to 0.
- A sell signal also appears if the probability of a downward breakout changes from 100% to a value below 100% (the red line).
In addition, the author introduced a new probability called Prime Probability (the blue line), which is a combination of various probabilities.
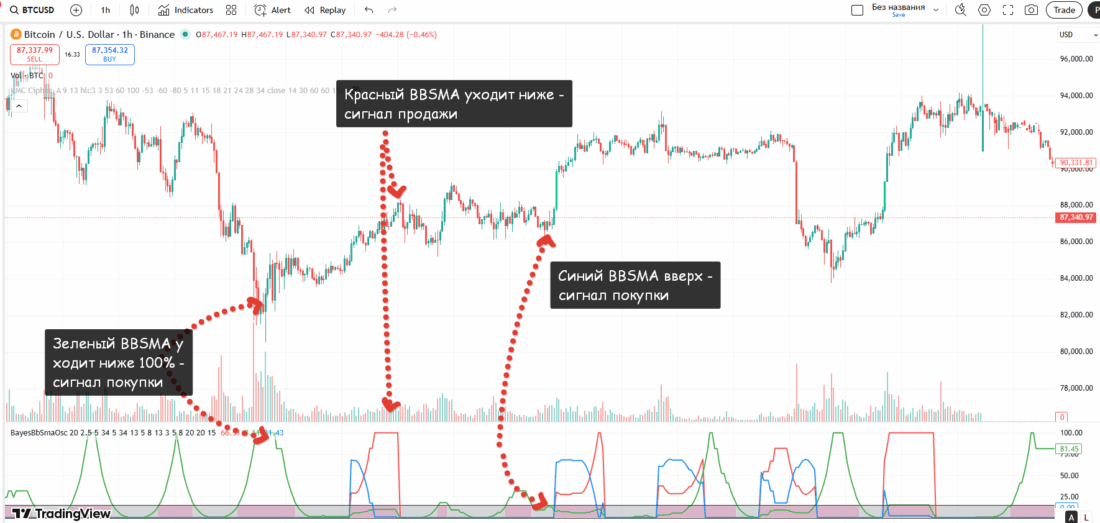
According to the author, all buy or sell signals are strong provided that at the moment the signal is formed, the probability indicates that there is a directional move in the market, that is, the quote has exited the sideways range.
Weak signals are excluded from the indicator's readings, but they can be determined as follows:
- If the primary probability changes from zero or a near-zero value to a value within the lower threshold, this is a weak buy signal.
- If the breakout probability changes from a value above the lower threshold to a value below the value of the previous candle, this is a weak buy signal.
- If the primary probability changes from a value within the lower threshold to zero or a near-zero value, this is a weak sell signal.
- When the breakout probability changes from a value above the lower threshold to a value below the previous one, this is a weak sell signal.
The author of the indicator recommends experimenting with the lower threshold to find a suitable value. In addition, in the developer's opinion, when creating alerts it is better to use the "Once Per Bar" option.
Professional interpretation of the signals of the Bayesian BBSMA Oscillator indicator
According to the author of these recommendations, the interpretation of the oscillator's signals proposed by the developer has not been fully refined. At the same time, the indicator itself is quite interesting, so professionals spent some time studying its behavior.
The research helped confirm that its ability to predict an increase in the probability of an event in the market is sufficient for adding it to the arsenal of technical analysis tools. Based on the research conducted, several very interesting and useful regularities were identified for bitcoin and the major altcoins in a growth cycle.
In a rising market, a strong buy signal works on average across 10 timeframes. In a falling market, a strong buy signal means the last strike within a correction. Such a strike has an impulsive appearance on lower timeframes and ends with a sharp reversal.
In a falling market, the 100% value is reached more often than in a rising market. The duration of staying on the plateau is relatively longer than in a rising market.
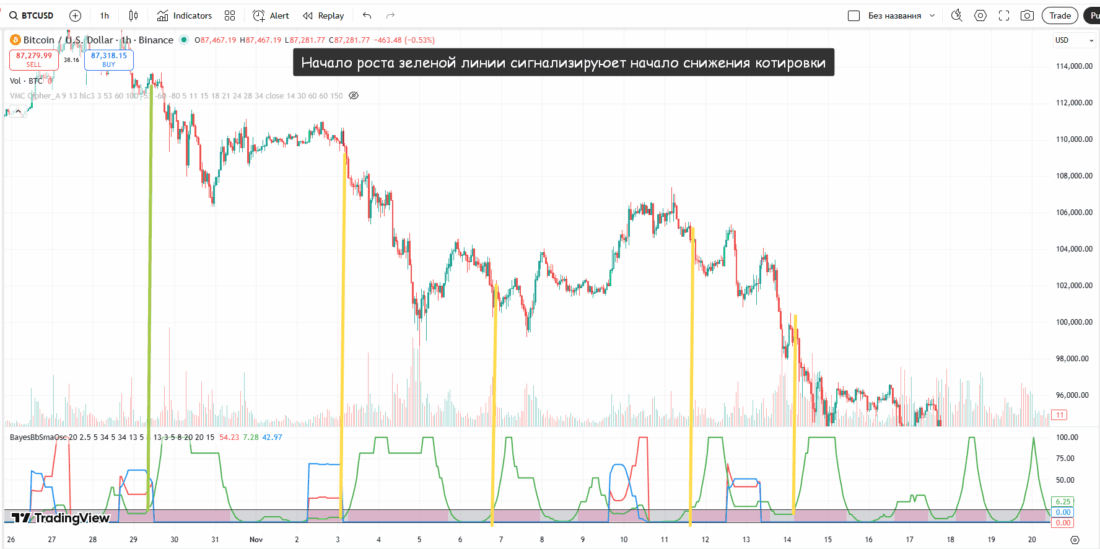
In the impulse phase, the indicator's signals should be read "reversely" relative to the developer's recommendations:
- A rise of the green line above 20% may mean the beginning of a downward move. Buying is not advisable.
- The green line at 100% is a harbinger of an imminent rebound. The higher the "hill," the stronger the signal (maximum 100). On the plateau it is better to close the short.
- A rise of the red line may mean the beginning of an upward move. It is worth taking a look at buys.
- The red line at 100% is a signal of an imminent pullback. It is better to close buys.
The blue line (Prime probability), which according to the indicator author's idea is a buy signal, appears when the price rises sharply. But, in the opinion of specialists, it does not show the probability of future moves.
How to use the Bayesian BBSMA Oscillator indicator: TLAP's opinion
My analysis of the indicator's behavior shows that the author's interpretation of the signals is better suited to a market in the consolidation phase, while the professional one is better suited to a trending market. We are speaking precisely about a tendency, not an iron rule, especially since within one "hill," the growth of the green line from 20% may be a signal to enter a short, while the decline from 100% may be an entry into a buy.
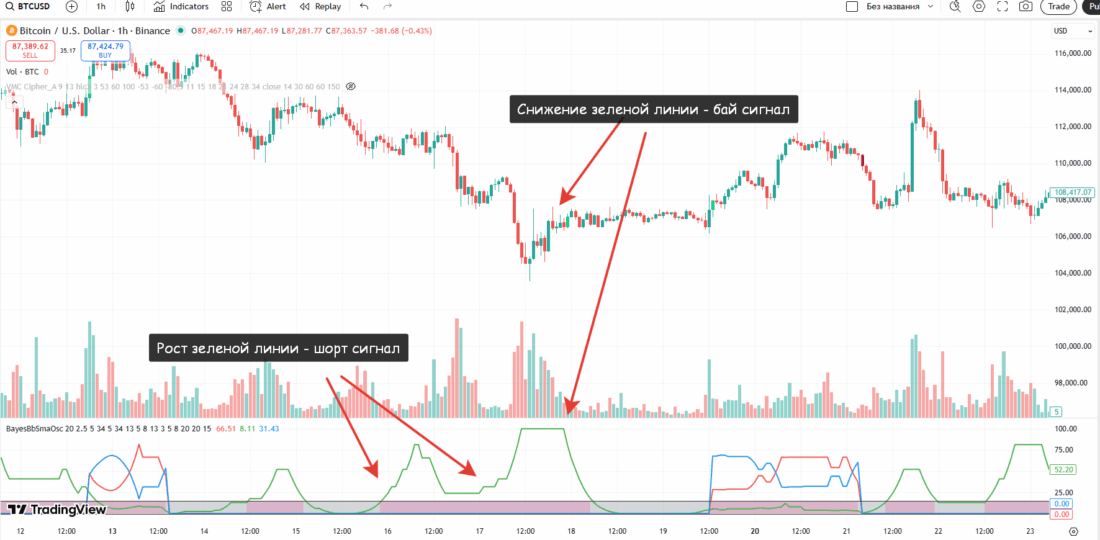
The signals given by the Bayesian BBSMA Oscillator indicator should not be interpreted as an unambiguous hint to enter the market.
The use of this oscillator greatly facilitates determining the potential entry point and entry time, especially when confirmation of signals received from other indicators and consideration of the overall phase of the market auction are required.
According to our observations, it is worth looking closely at cases when the move already occurs on the rise of the first hill, while the third hill predicts the beginning of the dynamics.
It is also worth independently studying in which market phase the author's recommendations work better, and in which the recommendations of the professional trader with many years of experience work better.
An example of the joint use of the Bayesian BBSMA Oscillator and Vumanchu Cipher A indicators
Below is an example of the combined operation of the Bayesian BBSMA Oscillator and Vumanchu Cipher A indicators on the hourly chart of bitcoin from October 3 to October 10, 2025, when the market reached the ceiling. Together they showed a very good result.
A little earlier than the first trend-ending signal from Vumanchu Cipher A, we see that Bayesian BBSMA Oscillator begins to work as intended by the author: on the decline of the red line from 100%, a short-term very weak decline occurs. At the same time, the growth of the red line from 0 to 100% was accompanied by relatively weak growth of the quote, which is often evidence of exhaustion in the strength of buyers.
At the same time, we see three weak short signals at once on Vumanchu Cipher A (small red diamonds). Understanding that the market is in a bullish phase, we ignore the weak southern signals.
But at the same time, we begin to watch the market, because some non-standard combinations have appeared. In addition, we know that the market phase is, with high probability, a culmination, because the quote had been in balance for some time, and 125 thousand per bitcoin is in any case obvious overbought territory.
A little later, Vumanchu Cipher A shows 6 strong trend-ending signals (large blue triangles). At the same time, signals of downward movement appear (large red diamonds), crosses, and red stars: the concentration of signals is off the charts.
At the same time, Bayesian BBSMA Oscillator is "silent," because it does not reach 100% values, but it begins to give short signals according to the second system (a decline in quotes during the rise of the green line from the threshold value) at the moment when we see a break of the trend line downward. In fact, the short accumulation zone began here.
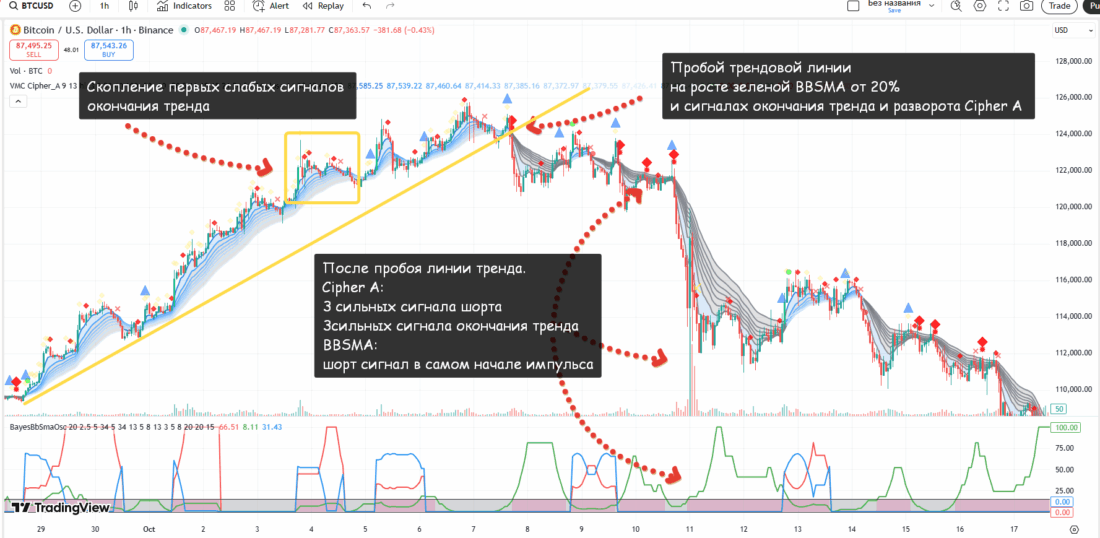
The combination of such factors as being at a historical maximum, the break of the ascending trend line, and a whole series of strong signals on Vumanchu Cipher A indicates a possible downward move. At this time, Bayesian BBSMA Oscillator on the trend break shows a good green "hill," even without reaching 100%. The blue "hills" do not produce any effect.
With a dense cluster of signals from Vumanchu Cipher A, the sharp rise of the green line of the Bayesian BBSMA Oscillator indicator gives an almost guaranteed entry into a short at the point of no return.
Conclusion
The trader does not guess, the trader calculates the odds. Working with probabilities is help in making a well-considered decision about opening a trade.
To ignore probability means to sail blindfolded and hope for luck as if it were something mystical. You can play that way, but you cannot work that way. Luck is not randomness, but intuition based on a competent assessment of the probability of an event.
If you assess probabilities and trade only on the basis of the Bayesian BBSMA Oscillator indicator, you can get badly burned. And nobody needs that. But it perfectly complements other technical analysis tools and therefore deserves to be in the trader's analytical arsenal.
In other words, under no circumstances can you rely only on Bayesian BBSMA Oscillator. It is a good predictor of the preparation or beginning of a move, but not the strongest adviser for opening positions.
Respectfully,
Ivan Rusin