
Price Action: Trend Lines
 Trend lines, constructing them and trading by trend lines, are exactly what today's video lesson from the series of materials on Price Action, that is, indicator-free trading, is devoted to. This post is aimed first of all at beginners, but perhaps old bristly forex traders will also find something useful for themselves here :)
Trend lines are widely used by traders to search for entry and exit points; they can also serve as an indicator of a change in tendency or trend. If a trend line is built correctly, it will be a very precise tool indicating the further direction of price movement. Nevertheless, a large number of traders, especially beginners, make elementary mistakes and build the trend line incorrectly.
So how should we draw them?
A trend line should connect as many bases as possible (at least two) for a rising market. And for a falling one, accordingly, we will connect the tops. How this happens is easier to show in practice. In MetaTrader there is a corresponding tool for drawing trend lines. In the picture, the mouse arrow indicates the location of the "Trend Line" tool on the toolbar. Click this button. And the mouse cursor changes slightly.
We are shown a kind of crosshair, and a little to the right beneath it there is an image of a line.
In order to draw a trend line, first we need a base for a rising market, and then we connect the subsequent local minima.
On the chart we see an absolutely textbook, clear, and obvious example. We move the mouse crosshair to the first base and from it draw a line so that it connects as many points as possible, the subsequent bases. That is, the points where the candles tried to move lower. But that did not happen, and the upward movement continued. We got a straight line like this (see the chart above). It does not have to connect our points perfectly. Some candle tails may stick out beyond it. This is normal, because we are more interested in the correctness of predicting the further actions of the trend, not in the beauty of the lines. The trend line shows us a kind of bar, a kind of floor, from which price periodically bounces and continues the upward trend. As we can see further on, the upward trend strengthens. Price moved far away from our drawn line, but nevertheless continued to revolve around it for some time. After a certain time, we see that trend lines become outdated, and we need to draw new ones.
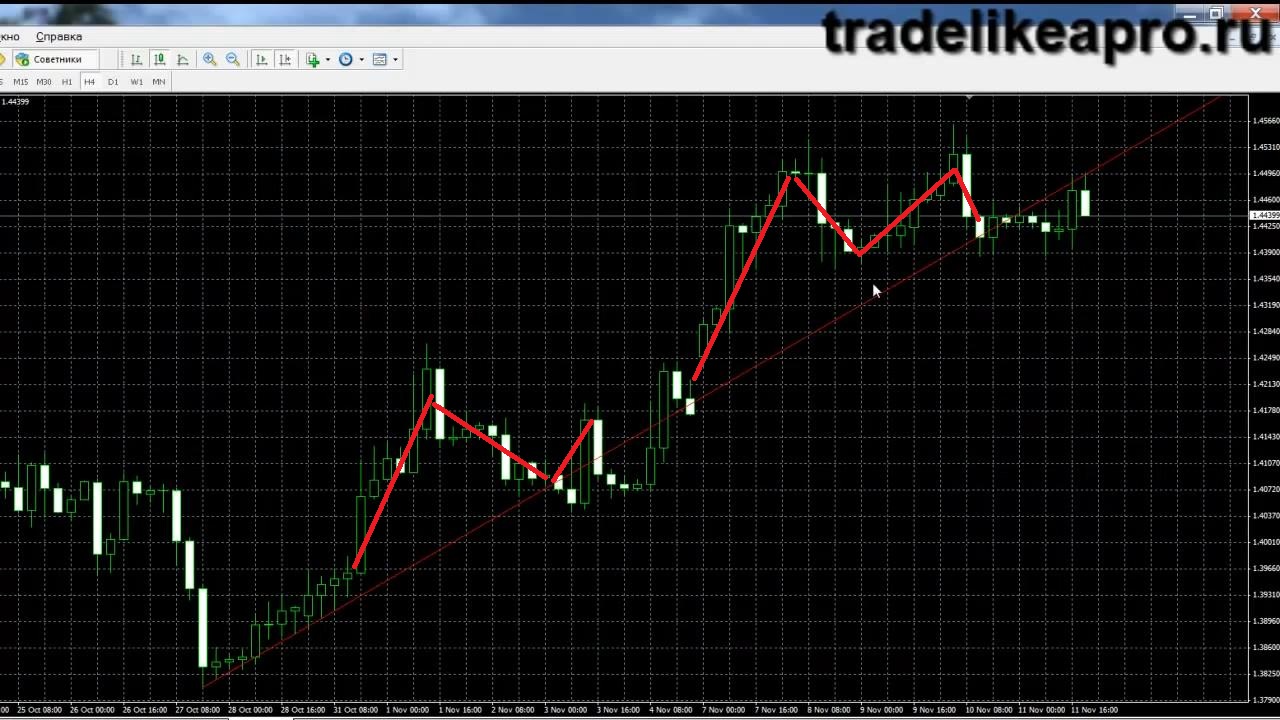
Now let us try to draw a trend line for a bearish market. In a rising market we connected the bases; here we will connect the local maxima, which gradually decline, thereby creating a falling market. Move the mouse cursor to our first local maximum in order to draw the trend line, and connect the subsequent local maxima that appeared on the chart.
Thus, we obtained a trend line for a bearish market and drew it. As you may notice, after some time a situation occurs in which the trend line will no longer be as important as it was initially. Just as in our first case, the market rose much higher, and for some time there was no return to the trend line. And then... the trend line simply became outdated. But nevertheless, when the market rose, we could draw another trend line exactly the same way as the first one, but on another section. Let us demonstrate this. We got new higher bases that gave us the opportunity to draw one more line for a shorter period.
This would look roughly like this (see the chart above). Such a picture on the chart is called a "Secondary trend line." That is, first we drew our main line, and then the market moved into stronger growth, and we were able to draw a secondary trend line that remained relevant only for a very short time. But nevertheless, if the upward movement had continued, our secondary trend line would have played an important role. Do not try to do everything by some instruction or by some piece of paper. Common sense has not been cancelled yet. When building trend lines, it is worth considering how the market reacts. That is, we try to find the places where it bounced, we try to find a kind of platform, a kind of line, a floor, as I already said, from which the market bounces. It is also worth mentioning that trend lines can be different. Everything depends on the time interval that interests us, that is, how long we will hold the position, expressed in the number of candles. Since on absolutely any timeframes the rules for constructing lines remain the same. That is, we can look for some small trends, or we can look for some substantial ones that have a greater extent.
Suppose that here (see the chart above) we had a very small short-lived bearish trend. And we could have drawn a trend line if we had been trading in that interval. Let us draw a trend line. Suppose that here we could have drawn a small downward trend line, while at the same time we still had a longer-term upward trend, which we could have traced with this line.
As we can observe, the upward trend remained in place much longer than our small downward trend, and in comparison with our longer-term upward trend it was merely a correction and a return to a more extended trend line, nothing more. Again, everything depends on the interval on which we trade. If you trade over some ten candles, then at that moment the downward trend would be more important for you. And if you use some broader interval in your trading, then accordingly you would pay more attention to the long-term trends.
How to use trend lines in trading?
Suppose you have drawn a trend line. What should you do with it next? First, a trend line acts as a good support zone, that is, a zone from which price will theoretically, and most likely, bounce in the presence of a steady trend. It is quite possible to trade the breaks of the line of this support zone. Let us examine a bounce from this line, that is, a situation in which price returns again to the trend line and then bounces off it again, which can be regarded as a signal for the continuation of the trend and for opening the corresponding position. Suppose on this same chart our price went downward and then returned to the trend line. Our main chart would not yet have been drawn, and we would have built the line somewhat lower and then adjusted it.
We got a pin bar, which could be regarded as a bounce from the trend line and a reason to open a sell position.
And here we see (see the figure above) how price returns to the trend line. A clear bounce is observed, because the candle is directed toward our bearish trend. And here again there would have been an opportunity to sell if price had approached the trend line, but the candle is opposite to our trend. Suppose the trend in our example is going downward, but the candle is bullish, and it came right up to the trend line. Provided that our candle has only just closed, should we sell right now? No. It is worth waiting for confirmation of the signal, when a candle in the direction of our trend is drawn. In this case, a bearish candle was drawn. On the assumption that the trend will continue, we can sell.
Breakout Tactic
In addition, there is such a tactic of trading by trend lines as a breakout, when price breaks the trend line in the direction opposite to our trend. And accordingly, a reversal occurs. Let us show this with an example. A breakout of the trend line occurred. First, let us draw our line. On the chart it is perfectly clear where our trend line was, and besides the real breakouts, false ones are also visible.
A breakout occurred. But you should not enter the market on the candle that has only just broken the trendline. It is worth waiting for one more candle to confirm that this signal is valid and that this is not a false breakout. On the chart we see a candle breaking the trendline. We wait for one more candle. A bullish candle appeared, but we still do not sell and wait to see what happens next. And we see that the price returned to a value above the trendline, and the upward trend continued. In this case, this can be regarded as a bounce off the trendline. And somewhere after this candle (see the chart above), after trend confirmation, you can buy in. This again is about bounces.
We had a breakout (see the chart above). The price broke the trendline. But we wait for one more candle for confirmation. And it is bearish again, which points to a reversal. And in this case we could very well have sold, since we are confident that all take-profits would have been reached thanks to the reversal. Important: after a trendline breakout, two scenarios are possible: either a reversal or consolidation before the market continues, as happened in our case.
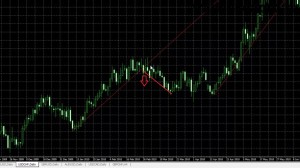
A trendline is drawn on the chart. We see an upward trend and its breakout. A bearish candle formed that broke the trendline, then a bullish candle appeared. We wait to see what happens next. Then another bearish candle with an upper tail formed, which should serve as a signal to us that we should sell. Of course, everything here depends on the goals you have set and your forecasts for how long the downward trend will last. Again, it is worth paying attention to other technical indicators, chart patterns, support/resistance zones, etc.
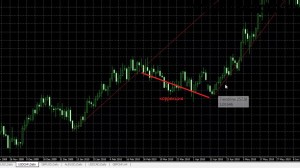
In this case, we had a certain consolidation on the chart, a certain correction, which resulted in a chaotic, almost horizontal group of candles that then returned to the bullish trend. And the bullish trend continued. That is, we are seeing consolidation before the trend continues, not a reversal after the breakout.
Is a trendline breakout a signal of a market reversal, or a signal of consolidation?
In fact, it is very difficult to determine this in advance, or rather impossible. But we can make some judgments based on the angle of the trendline. The steeper the angle of the trendline, the greater the probability that after its breakout there will be consolidation rather than a reversal. Accordingly, the steeper the trend, the greater the chance that it will break at some point in time and then continue.
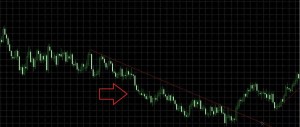
But if the line is smoother and has a greater length, let us say as in the chart above (we see that the downward trend lasted for quite a large number of candles), then after its breakout we have reason to assume that this is a signal of a reversal, which is exactly what happened in this case. But, unfortunately, it is not always that simple. In addition to trendlines, other signals should also be taken into account. After the trendline has been broken, this does not mean at all that it should be removed from the chart, because it may still be useful to us. As you have probably noticed, the trendlines we draw automatically continue into the future, which helps us use them to set certain targets and stops, as well as to find potential zones of future support and resistance. Let us consider an example of when you should not remove from the chart a trendline that would seem to have lost its relevance.
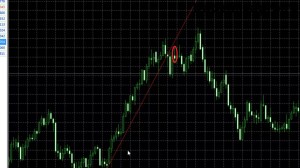
What do we see in this case? A certain trendline is visible on the chart. Next we see its breakout and the fact that after this breakout the price returned again to this trendline to test it. We had a trendline during a bullish trend. It was support from which the price bounced more than once. After the price broke it, the trendline briefly becomes resistance. The price, as a rule, tends to return to it, only then to continue its opposite movement. In this case the price broke our bullish trendline, and then returned to it and almost touched it with its tails, thereby testing the trend as resistance. After that, a small zigzag movement appeared, after the completion of which the price decided to go down.
Important: after the trendline has been broken, do not rush to delete it. The price may return to it, and in this way you will determine that this is a reversal pattern. Of course, provided that the price bounces off the trendline rather than breaking it and once again continuing the trend that existed before. Naturally, the greater the length and the greater the number of bases or highs the trendline connects, the greater the significance of this trendline. The number of touches is also important: how many times the price bounced off the line, and the angle of the line. The flatter the trendline we observe, the more significance it has for us. The steeper the angle of the trendline, the greater the probability that it will be broken and the less reliable it is. The trendline can also be used as a moving support zone.
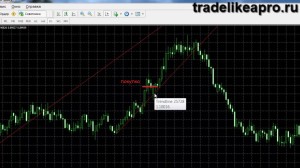
Suppose that somewhere here you made a buy trade. Then you gradually move your stop-loss slightly below the trendline, and move it with each candle. This creates a kind of analogue of a tralling stop. Tralling stop is an order to close a position that is automatically changed by the trading terminal according to the settings specified by the trader. It allows the trading process to be automated in terms of closing positions.
In conclusion
And finally, let us figure out how to determine what minimum distance the price will travel after a trendline breakout, because if it is a reversal, the price can naturally keep moving for a very long time. We need to have some initial minimum targets that will work with a high probability. On the chart we see a trendline and the price continuing to bounce off this line. Then we observe a breakout, and there is confirmation of it, and we open a position.
We open a position somewhere at this point (see the chart above). Now we need to set a target. Decide what take-profit to assign. This can be done with the help of our previous trendline. We look at what maximum vertical distance from the trendline to the base, or to the maximum if it were a bullish trendline, the price traveled from the trendline. And this distance in points will be our potential first target.
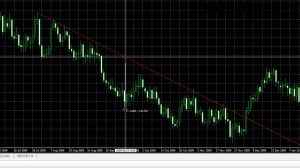
In this case, the maximum distance here was 410 points.
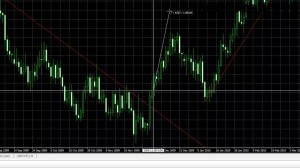
At this stage, we bought. We set aside our 410 points, which were taken after a small rise and correction.
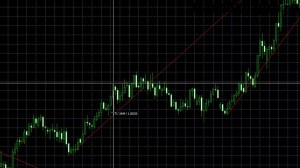
For this trend line, we measure the maximum vertical distance (from the high to the trend line). The distance comes to 260 points, and that is what we project immediately after the line is broken.
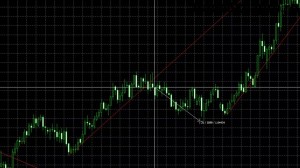
What do we see? During the move downward, the maximum was exactly 300 points. That is, our target would have worked quite well.
On the chart above, the maximum vertical distance from the high to the trend line was 370 points. We will sell after the breakout, so we set these 370 points as the target.
Here we can see that they worked successfully.
This is how you can determine potential profit-taking points when opening a position after a breakout of trend lines. This method is used by trend lines themselves.
The "Price Action" topic on the forum
Respectfully, Pavel
TradeLikeaPro.ru