
Price Action: Pin Bars

Pin bar is one of the strongest, and at the same time easily recognizable, candlestick patterns in chart analysis. However, many beginner forex traders make mistakes when trading this pattern: they do not consider the quality of the formed pin bar, do not pay attention to its location, and enter the trade incorrectly because they use market orders. You will learn how to recognize pin bars and avoid the above mistakes in this video lesson.
What is a pin bar?

A pin bar is one of the main Price Action patterns. Its name came from the famous character Pinocchio from Carlo Collodi's tale.
Let us imagine that we have a chart. The trend is directed upward and the price is rising. Then a candle with a small body appears. At the same time, it has a small shadow on one side and a huge shadow on the other:
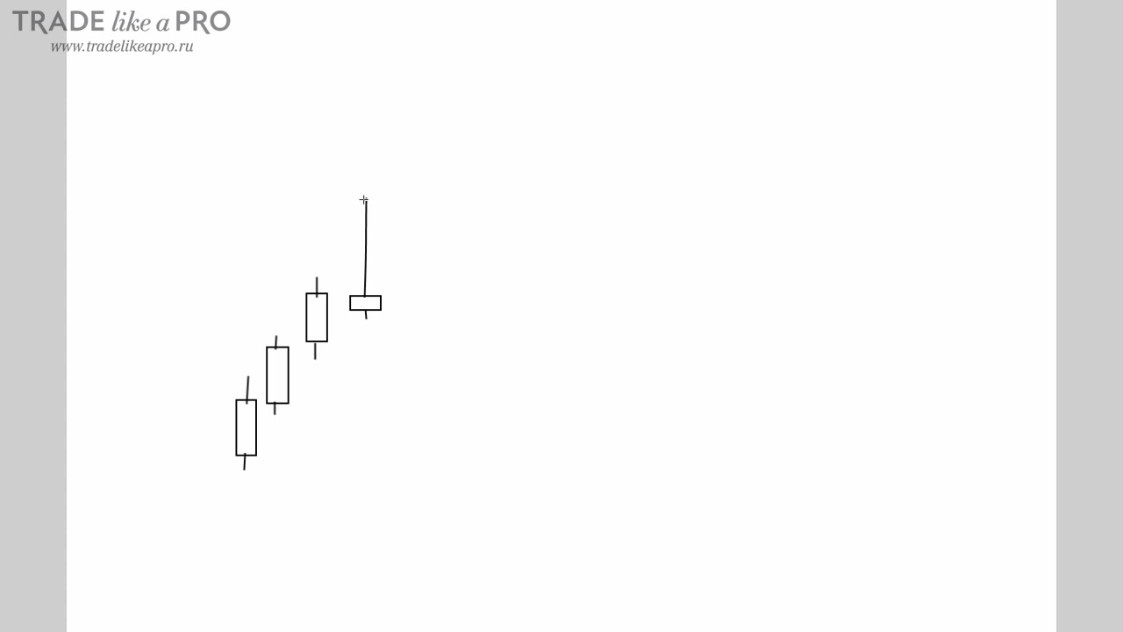
This is nothing other than a pin bar.
Pin bar is a reversal pattern that suggests a price reversal. It is a candle with a small body, a long tail on one side, and a small one on the other.
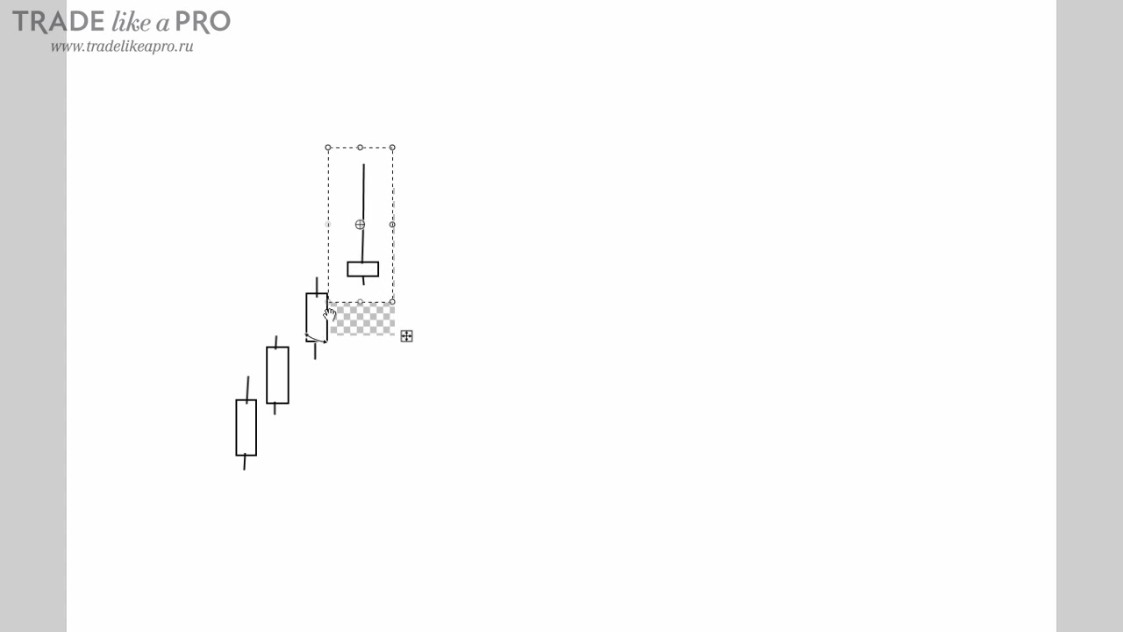
Moreover, the body of the setup must be within the range of the previous candle, that is, from the High point to the Low point of the previous candle.
If its body were not within the range of the previous candle, as in the example shown below, we would not call it a pin bar because it does not match the characteristics of the pattern:
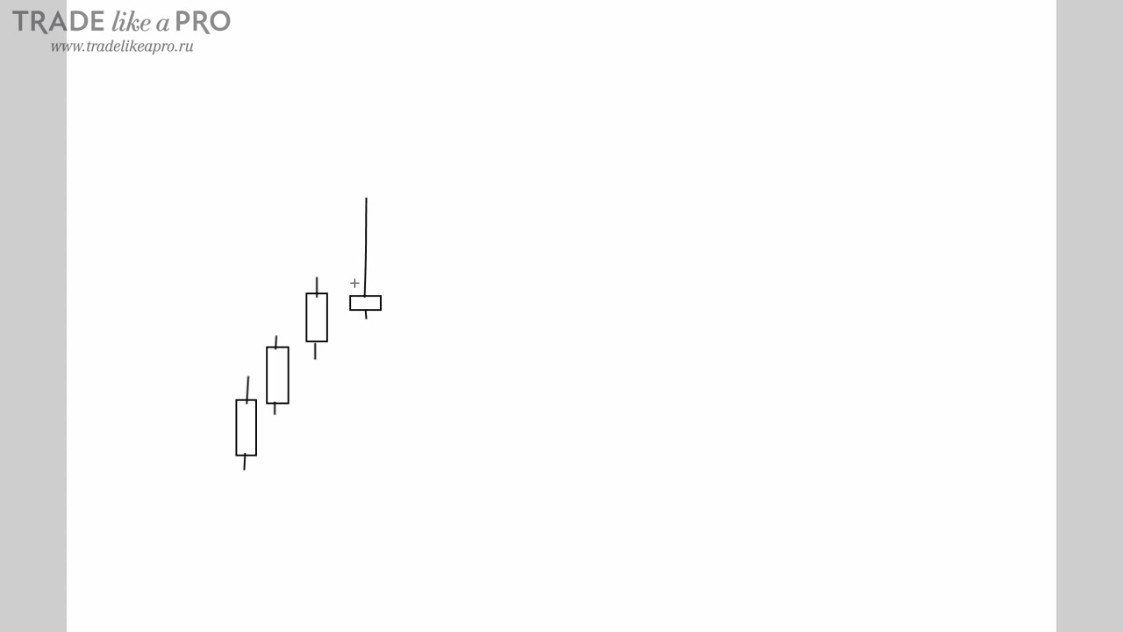
We observed the price moving upward. Then, on the candle that later became a pin bar, a strong reversal occurred. People had been buying for a very long time, and then due to various factors the price moved in the opposite direction.
What will happen to the positions of players who placed buy orders? They will lose their money because their stop losses will be triggered. And that was exactly the purpose of this reversal. Collecting the stop losses of those who were in buys.
Since this movement was sharp, many more sell orders were activated, which were surely placed by other traders expecting such a situation.
And all of this led to the candle on the chart drawing a long tail and a small body.
Now the buyers whose stops were triggered will start entering sells, while those whose pending orders were triggered will not rush to exit them because they are already slightly in profit.
Thus, we can observe a change in market sentiment, as well as a pattern called a pin bar.
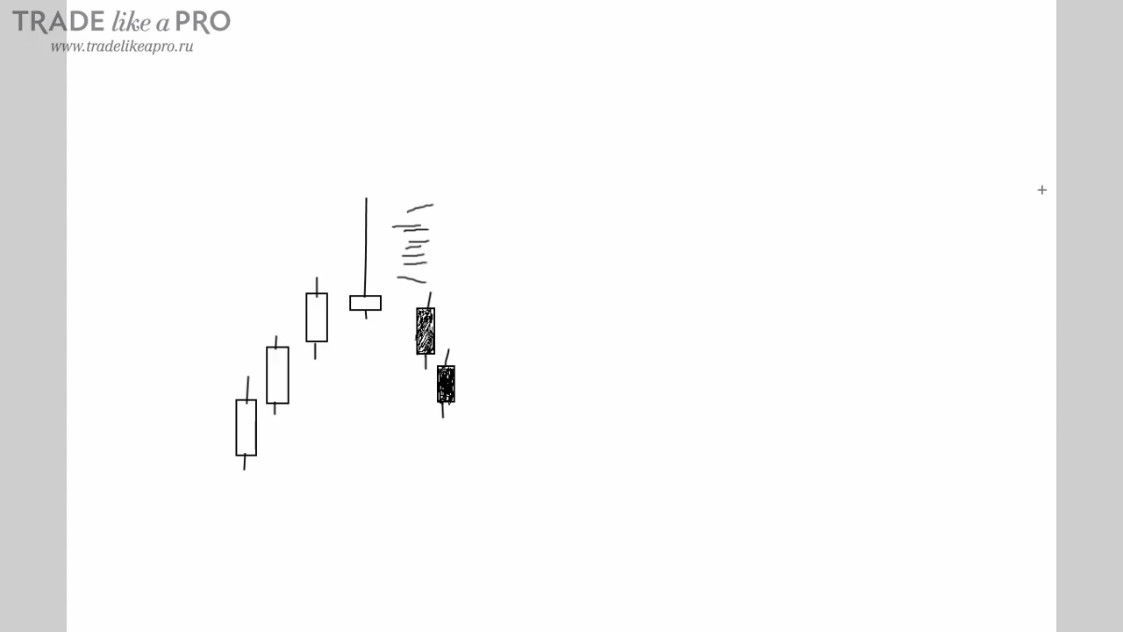
This is a reversal pattern, so afterward we expect movement downward. Namely, bearish candles:
In order to take this pattern, we need the pin bar to have a point of support. This must be an additional factor giving us the right to assume that movement downward will occur next. We need a reference level, a support or resistance level from which the pin bar rebounds:
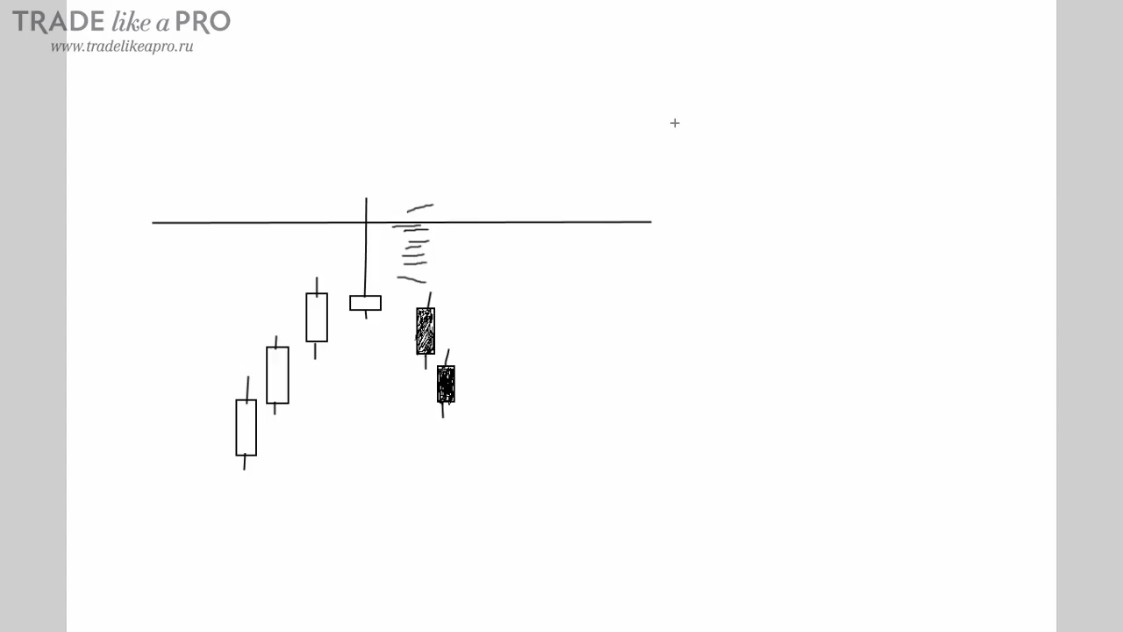
If there is no point of support, then we will not take this pattern to open trades.
How to enter the market using a Pin Bar?
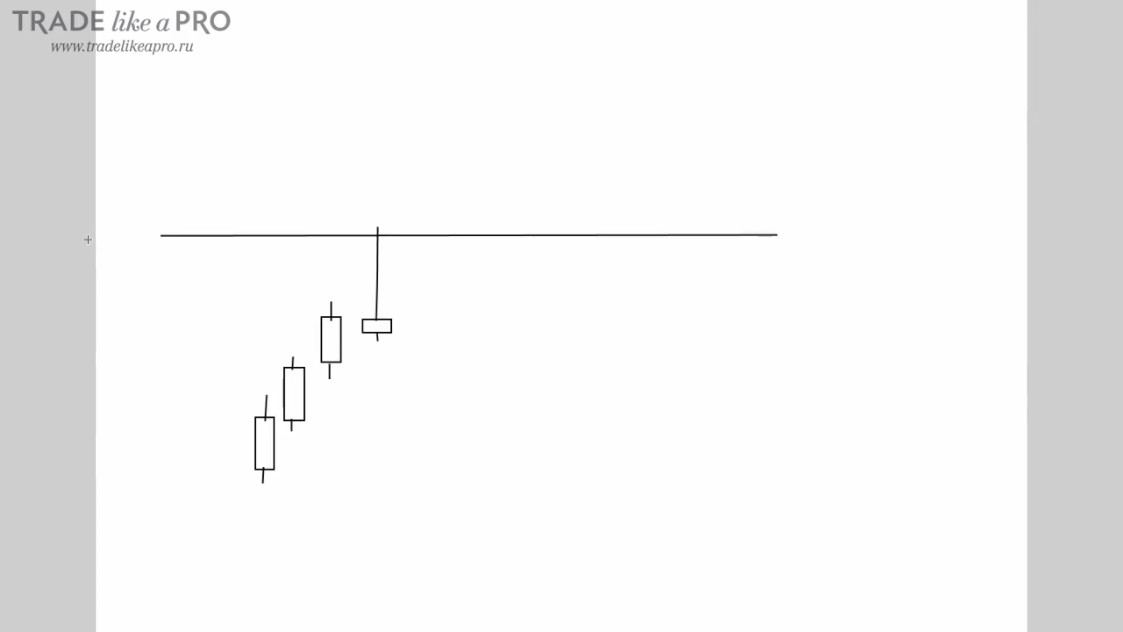
Entry with a pending order below the short shadow
The standard pin-bar entry is made by placing a pending order below the candle's short shadow:
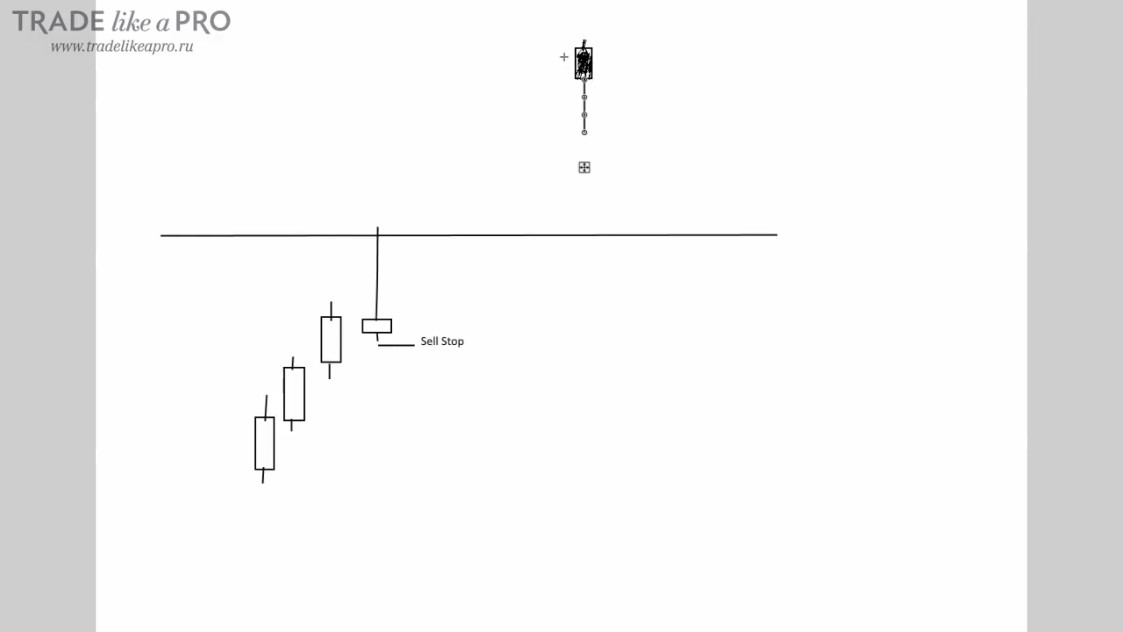
If a pin bar forms in the opposite direction after a downward move, then we place a buy stop pending order above the candle's short shadow:
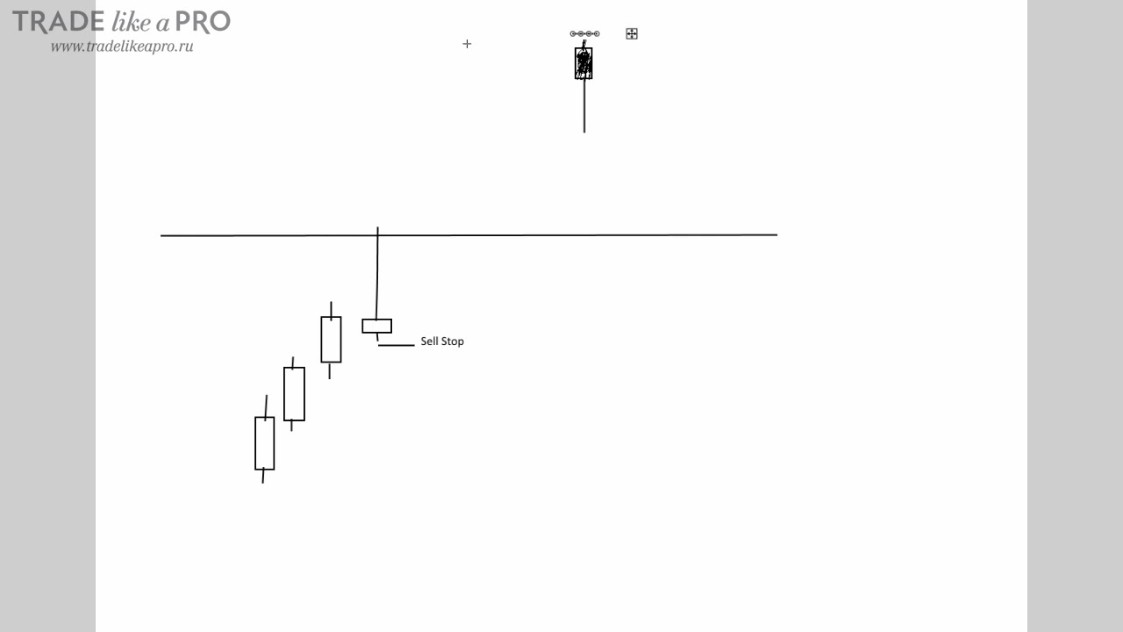
This classic method is based on the fact that if the price does not want to reverse, but continues its active movement along the previous trend, then our pending order will not be activated, and we will be able to delete it.
Second method: "Wait for a pullback to 50% of the candle"
In order to use the second method, we need to place a pending order approximately at its midpoint:
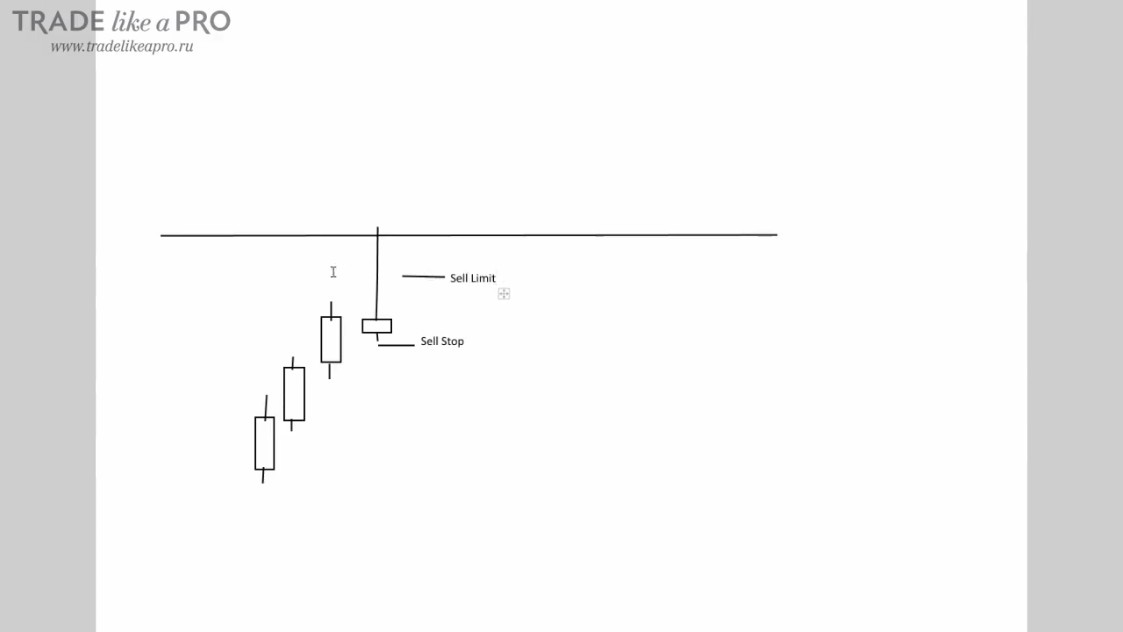
This is called a limit order. In this case, a sell limit.
The advantage of this entry is that we will get more profit, since we will be able to enter at a more favorable price for us.
The downside is that the market does not owe anyone anything, so the price is not obliged to pull back to the midpoint of the setup. And if the order is not activated, then we will earn nothing at all.
Third method: "Entry with a pending order near the level"
I will clarify right away that I use this method in my trading.
We place a pending order slightly below the level:
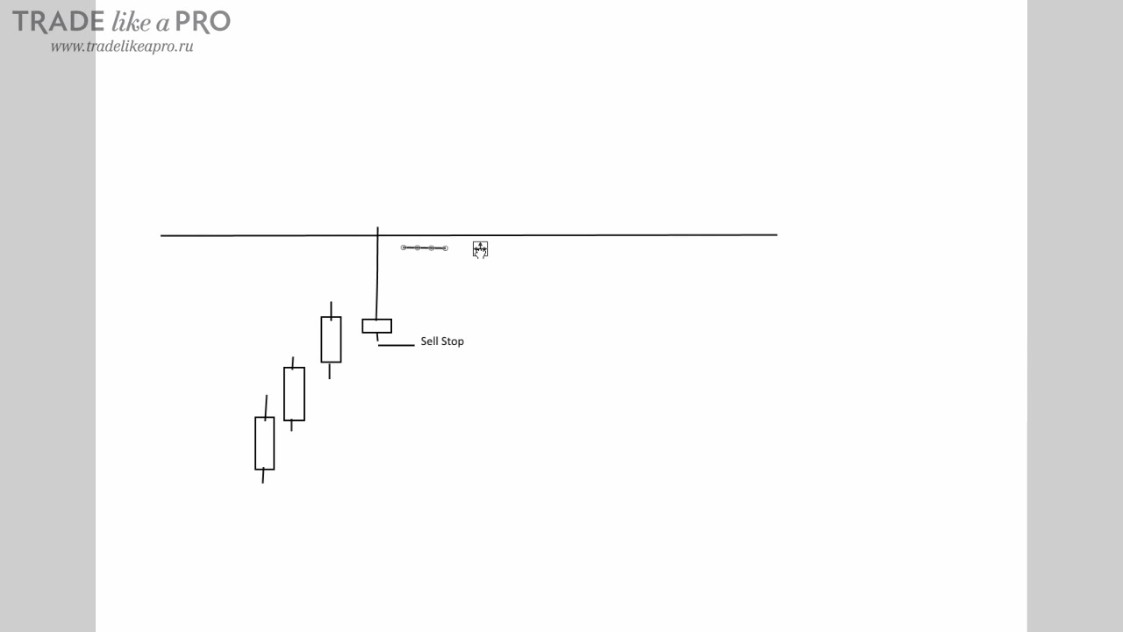
Please note that the level does not necessarily have to be located at the very edge of the candle. It can be located any way and anywhere:
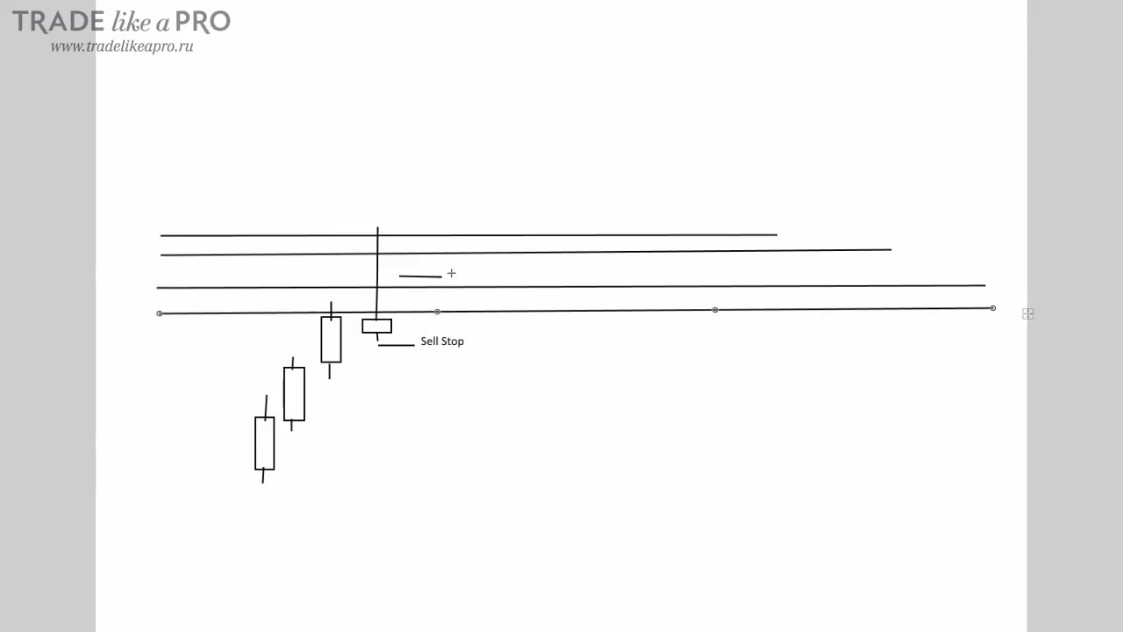
The pending order is placed directly below the level.
Which of these methods is better?
There is no clear answer as to which entry method is better. It all depends on the situation. I will add that if I am not sure about the pin bar, then I place a pending order slightly below the shadow. If there is a noticeable level, then I try to place the pending order next to it.
I do not use the 50% pullback in my trading, because I orient myself to the level.
Sometimes a pending order near the level coincides with the 50% level of the candle. But this is not a mandatory factor.
To avoid confusing yourself too much, I recommend using the classic entry method. Namely, placing a pending order slightly below the short shadow of the pin bar. For beginners, this will be quite enough at first.
Stop Loss

In any trade, you should not forget about the Stop Loss, which limits possible losses.
Suppose we placed a pending order slightly below the candle's short shadow:
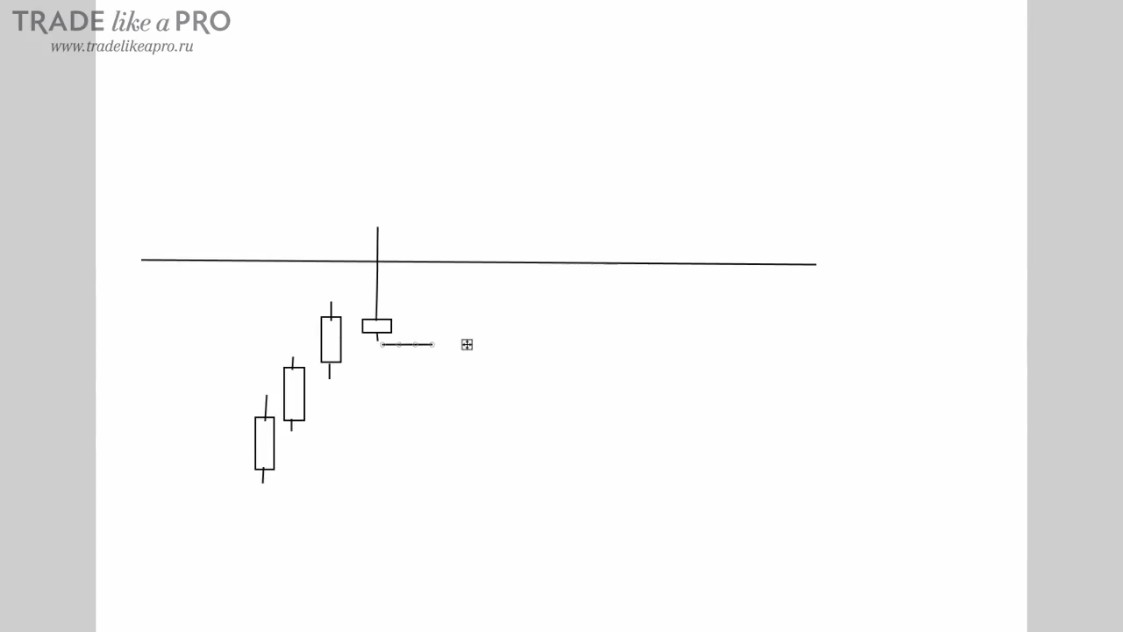
It was triggered, and we entered the trade, but we need a stop loss. Why? Because the price can reverse at any moment without any special reason.
Even the most beautiful setups will sometimes bring stop-losses.
The classic method of setting stop losses on a pin bar says that the stop-loss should be placed slightly above the candle's long tail.
That is, like this:
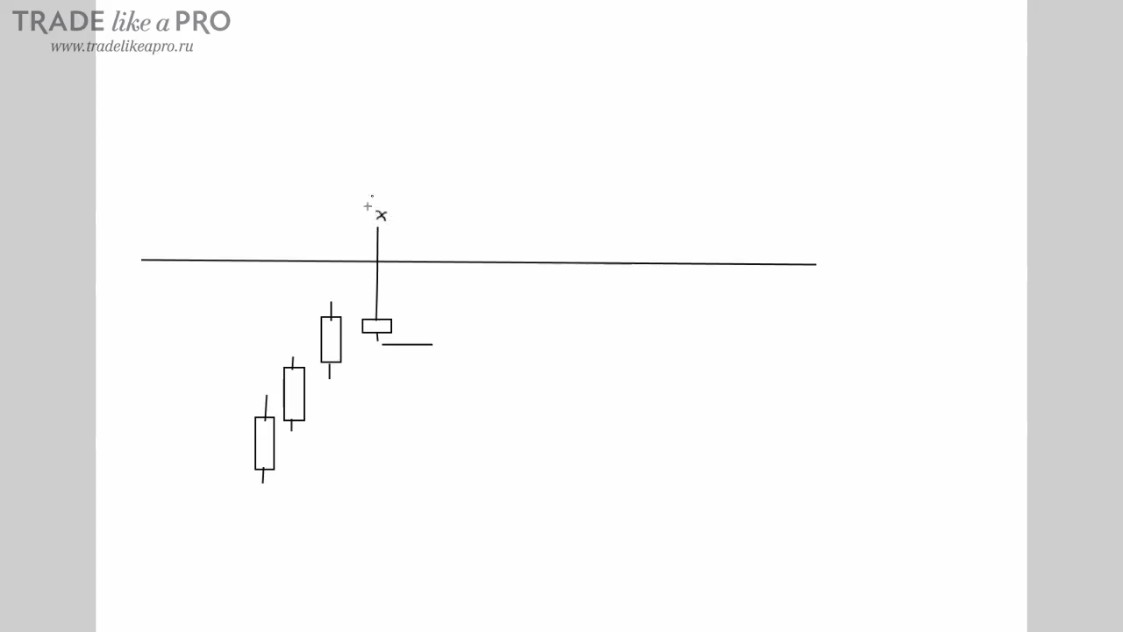
I believe it is better to place the stop-loss beyond the level.
Like this:
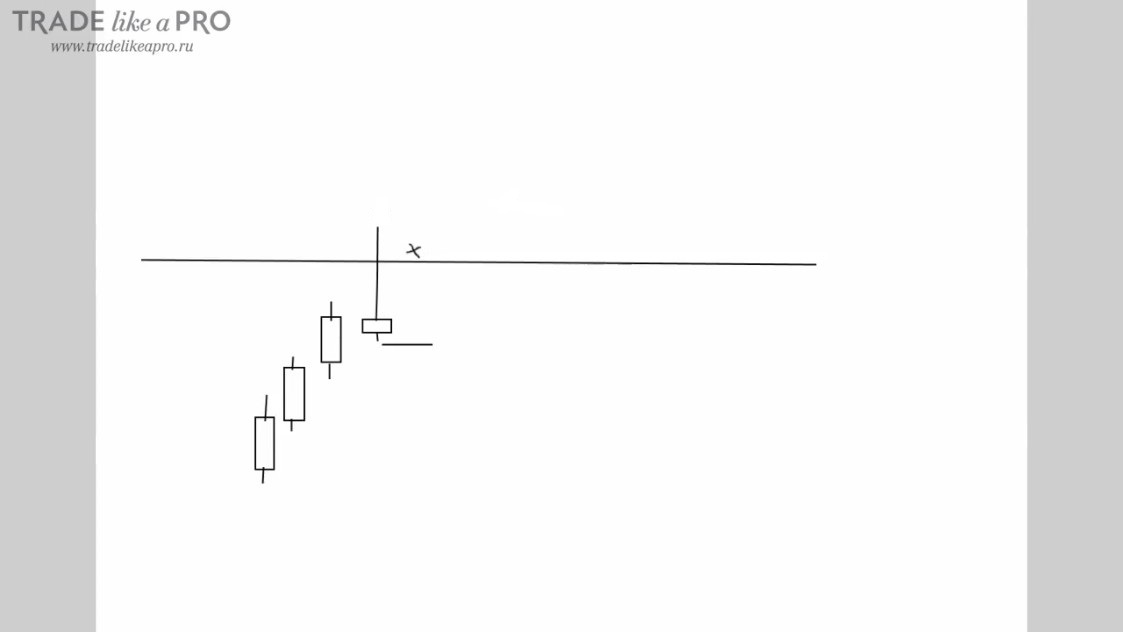
Why is it better this way? Because a stop-loss placed beyond the level is more logically justified. It has greater strength and at the same time reduces the number of points you are risking.
In certain cases, you can enter a pin-bar trade with a very small stop-loss. But on the condition that the market entry is made near the level, and the stop loss is placed slightly above the entry, beyond the level.
Such trades are more profitable, more pleasant, and overall bring only benefits to your trading account.
Therefore, in every trade I try to place the stop-loss as small as possible.
Take Profit

In addition to entering a trade, we also need to know how to exit it.
The easiest way to exit is at the next support or resistance level. This is the level that lies in the direction of the price movement. So that you do not have to sit in front of the monitor for hours waiting for the moment when the price reaches the intended target, it is enough to place Take Profit in the right spot:
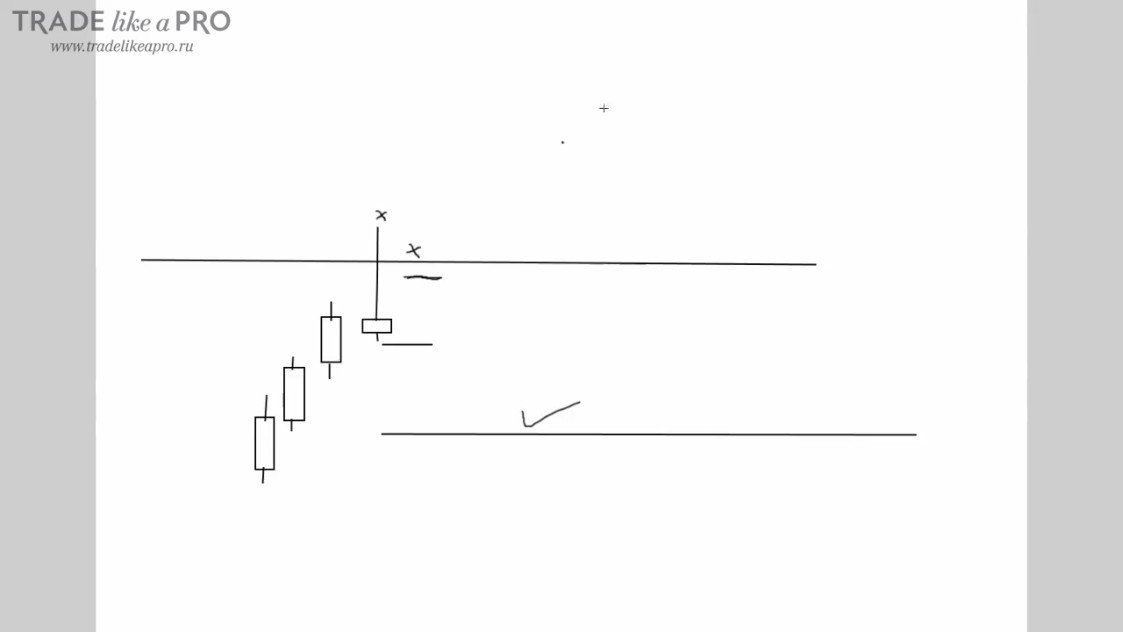
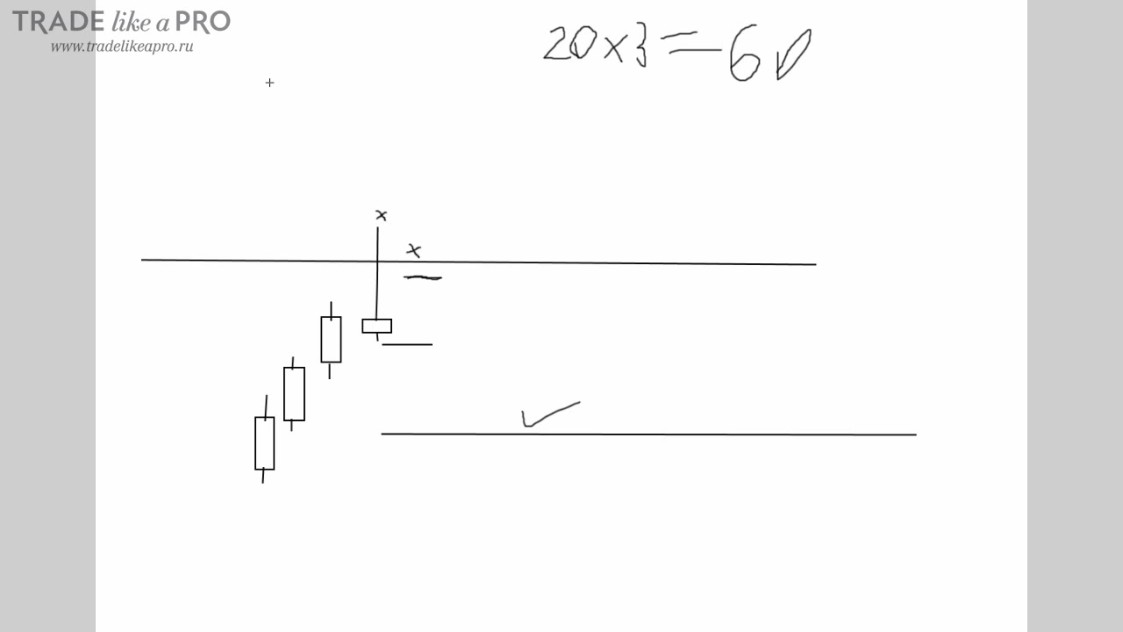
If there is no way to find a level on the chart, then you can multiply the stop-loss by 2 or 3 and thus get the take-profit size.
Suppose your stop-loss is equal to 20 points. Multiply by 3 and get 60 points:
Also, I would advise you to move the trade to break-even after two stop-losses. If your stop loss is 20 points and the price has moved 40 points, then you need to move the stop-loss to the trade's opening price. In this way, you protect yourself against a possible price reversal.
And one more possible way to set a take profit is to measure the length of the pin bar. The take-profit size equals the size of the pin-bar candle.
What should you pay attention to when trading pin bars?

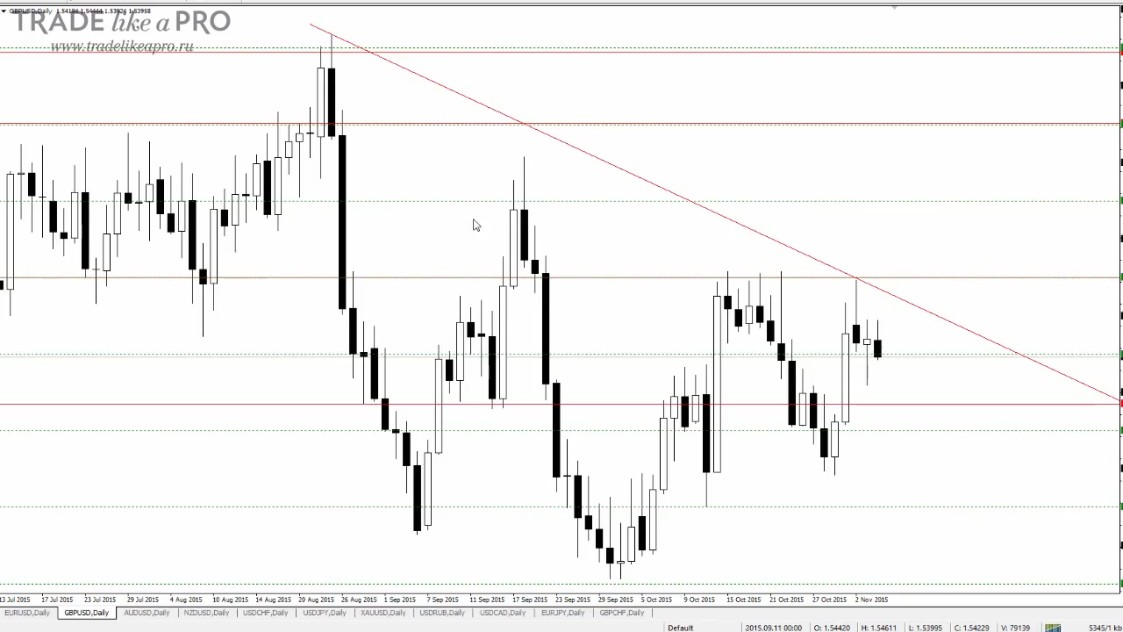
First of all, it is best to enter with the trend.
In fact, the very best option would be to enter the market only with the trend:
Why?
Because trend trading greatly increases the profitability of trades. I think you should agree with that.
Since we have discussed trend trading more than once, I think you should not have any difficulties with this issue.
If you really want to take a pin bar against the trend, then it should be very "beautiful." It should have a small body within the range of the previous candle and a long prominent tail. You need to clearly and without doubt see that it is a pin bar.
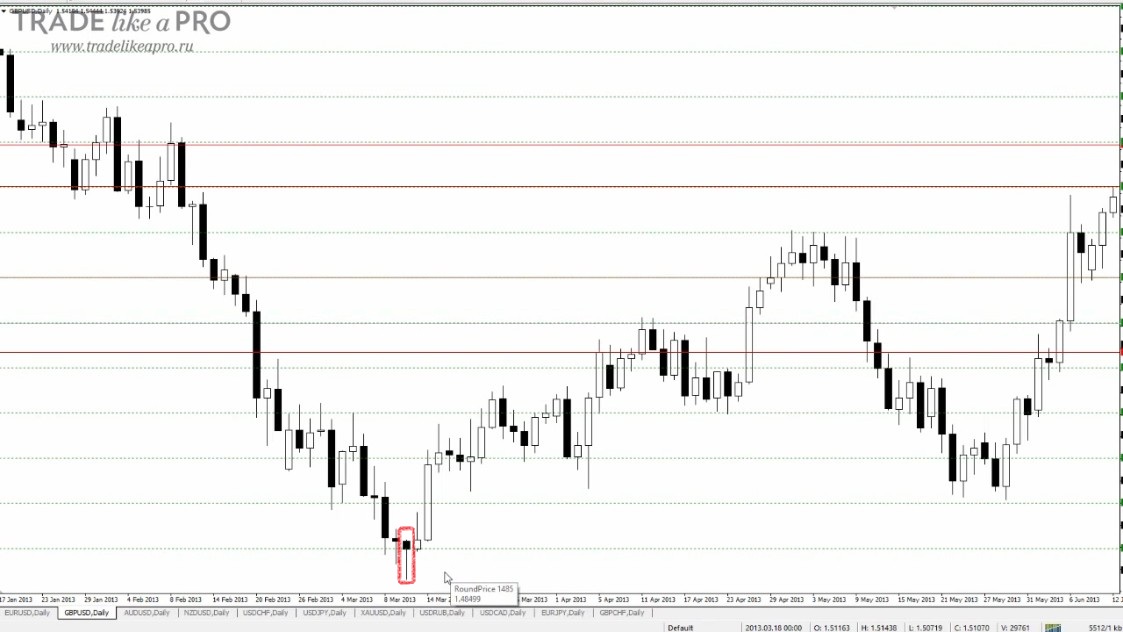
In general, we have a separate article, about trading against the trend, where we discussed various nuances. I recommend reading it.
Overall, I would not advise taking pin bars against the trend, because it is an unjustified risk. Always try to follow the trend.
As I said earlier, we always look for support from a level.
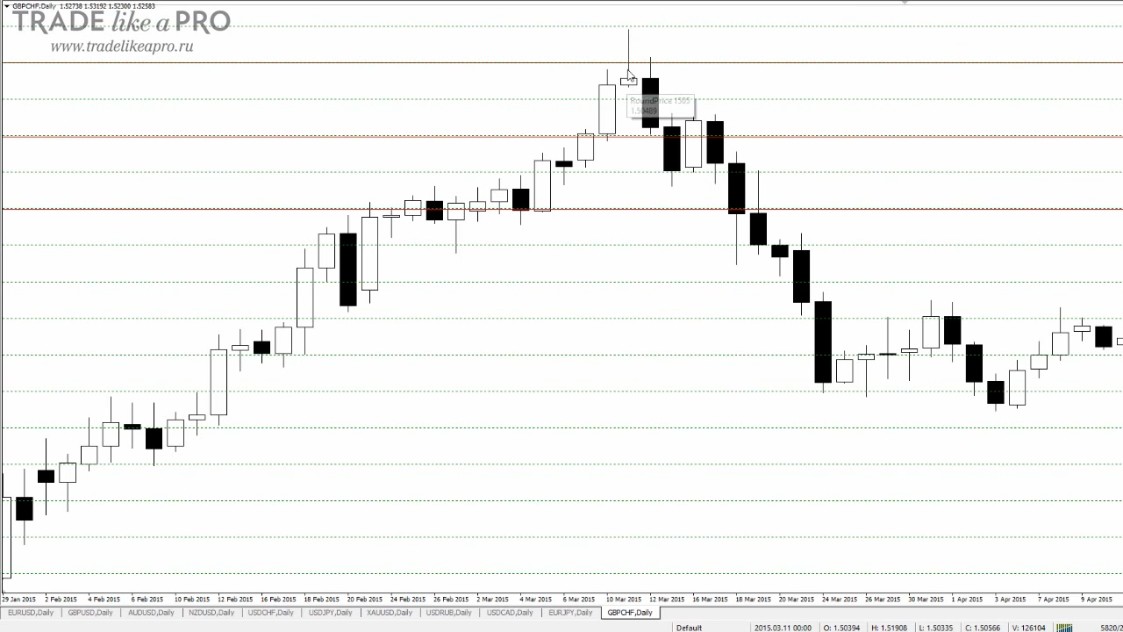
And if the tail of the pin bar forms a false breakout, then that is a good sign for us:
Why is this a good sign?
After the breakout, the price collected the stop losses and pending orders that were located at this level. This gives the setup strength. Therefore, if there is a false breakout of the level that forms the tail of the pin bar, that is an additional strengthening factor.
There is an opinion that the body of a bullish pin bar should be bullish, and the body of a bearish one must necessarily be bearish.
I have not seen any statistics that confirm this statement. In practice, there is no particular difference. It does not matter what kind of body the pin bar has.
If the pin bar is bearish, as in the screenshot above, but its body is bullish, that is normal and there is no need to be afraid of it.
Do not forget that random fluctuations are present in the market, and if the body is small, the price may pull back by 10-15 points and the body will become bullish.
This is not a factor you need to think about.
There is one more point about which a great many arguments and discussions are held on the internet.
Should a pin bar stand out on the chart?
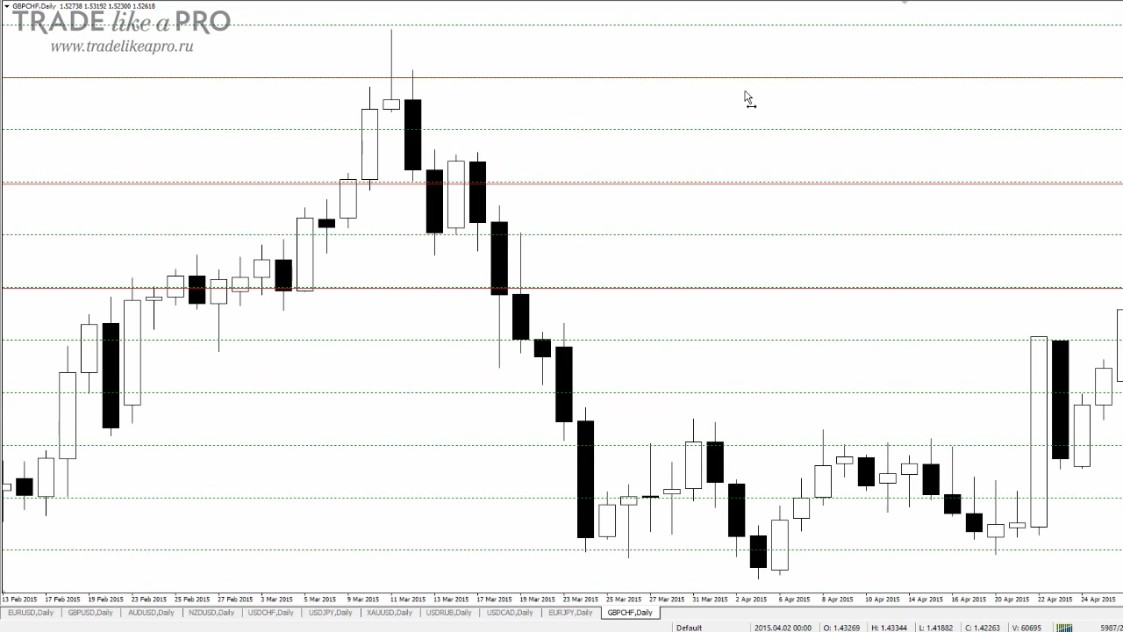
In my view, this is not a mandatory condition, and it is quite possible to enter on a pin bar even if it does not stand out much.
For example, in this area there is a pin bar that does not stand out, but as we can see later, it works out:
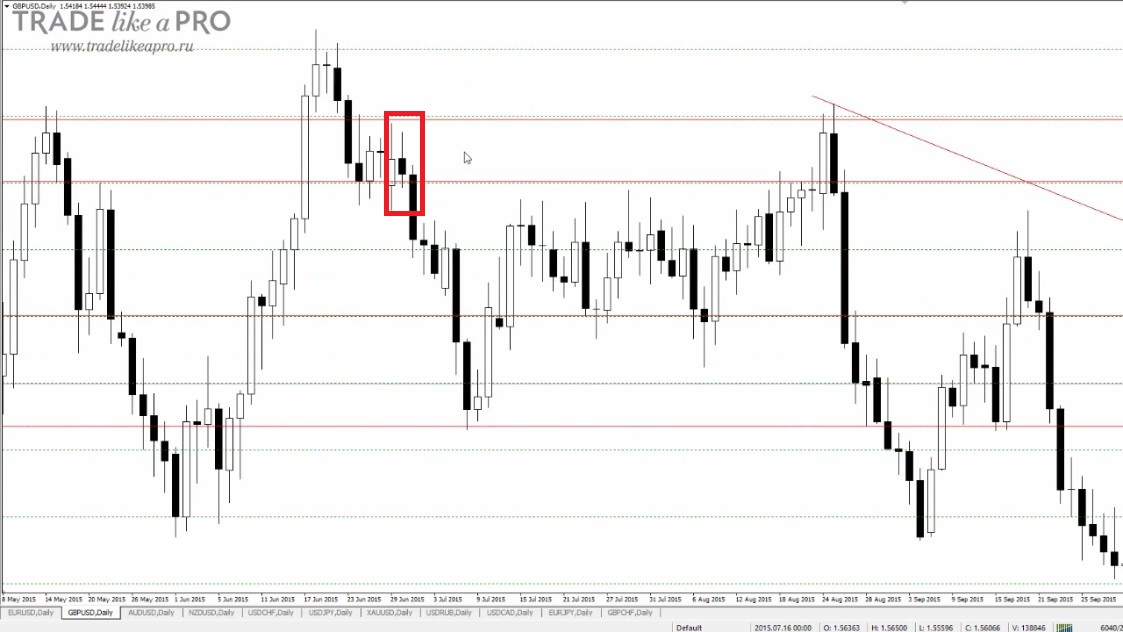
The only thing worth noting is that patterns that stand out well on the chart generally work out better.
Therefore, if you want to take only the strongest signals, then you should pay attention to vivid setups that are noticeable on the chart with the naked eye. But this is not some 100% criterion. It is still impossible to predict which of them will turn out to be more profitable until the chart starts moving forward.
There must definitely be some movement before the pin bar. There should be no flat. If the signal is preceded by a flat, then taking it is dangerous.
This nuance is demonstrated very well by the chart of USDJPY, which has been in a flat for several months already:
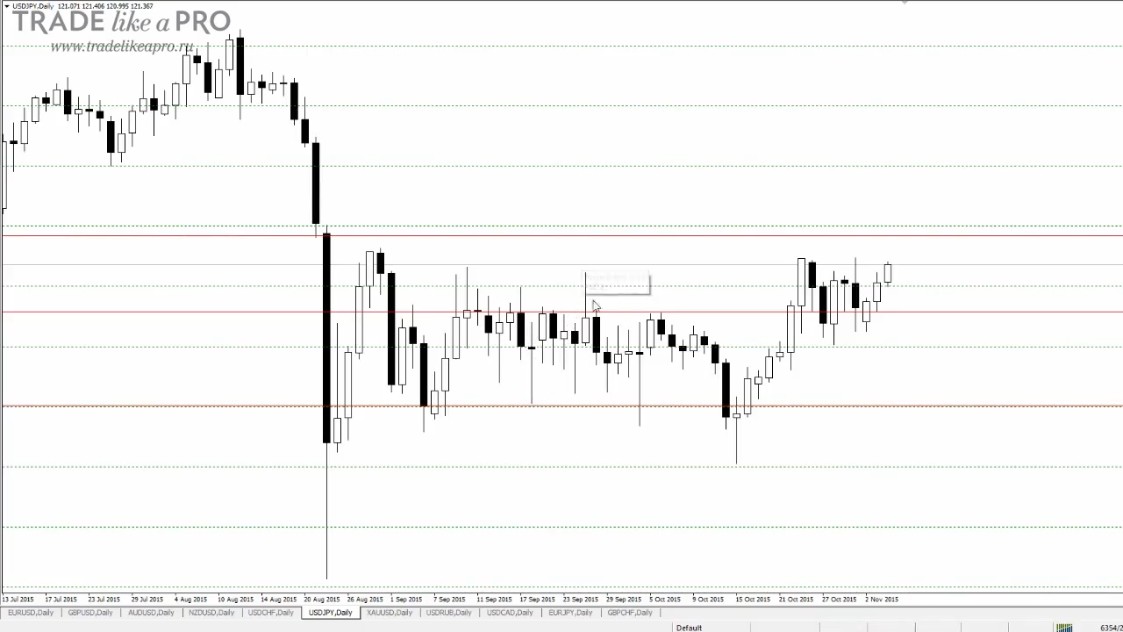
During all this time, many pin bars occurred on it in all directions. But they did not produce any effect.
Then there was a move downward, a pin bar appeared, and then a sharp jump upward.
From this we conclude that this setup must always be preceded by some noticeable movement.
Keep this in mind and try not to risk in vain.
Trading examples

Let us look at several examples of trading pin bars.
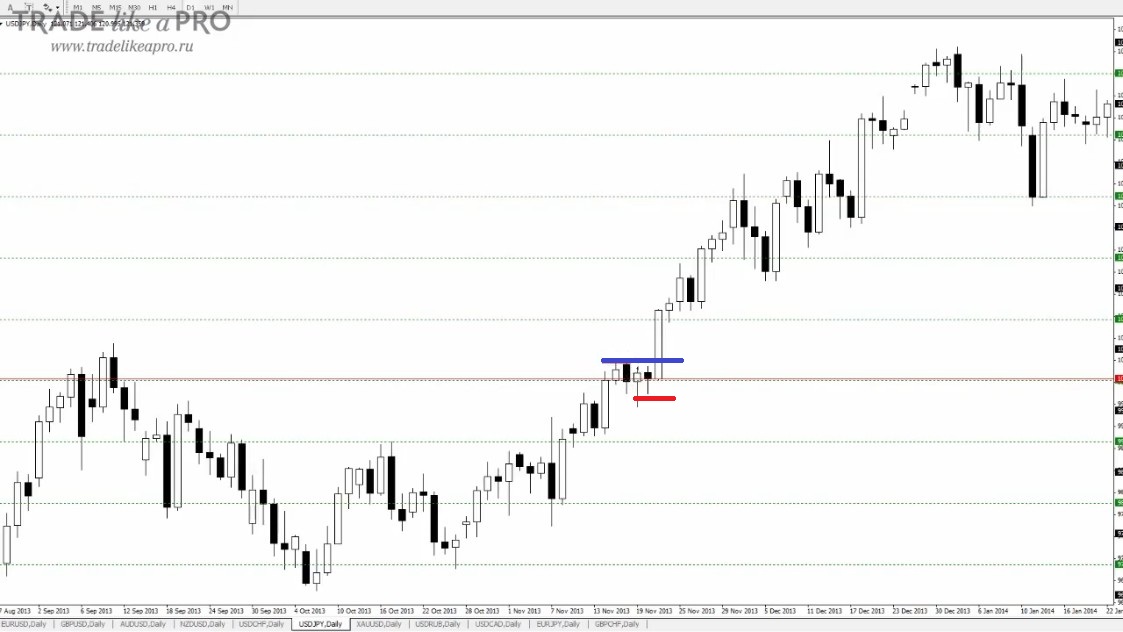
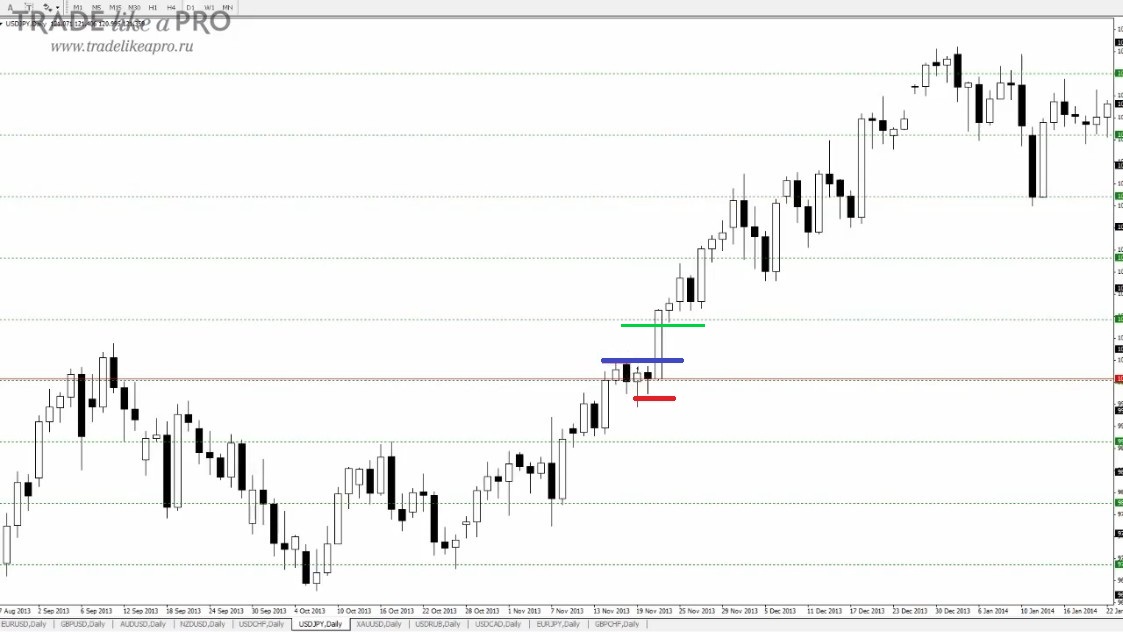
For the first example, let us use the previous situation and examine how the pin bar that was preceded by a flat worked out:
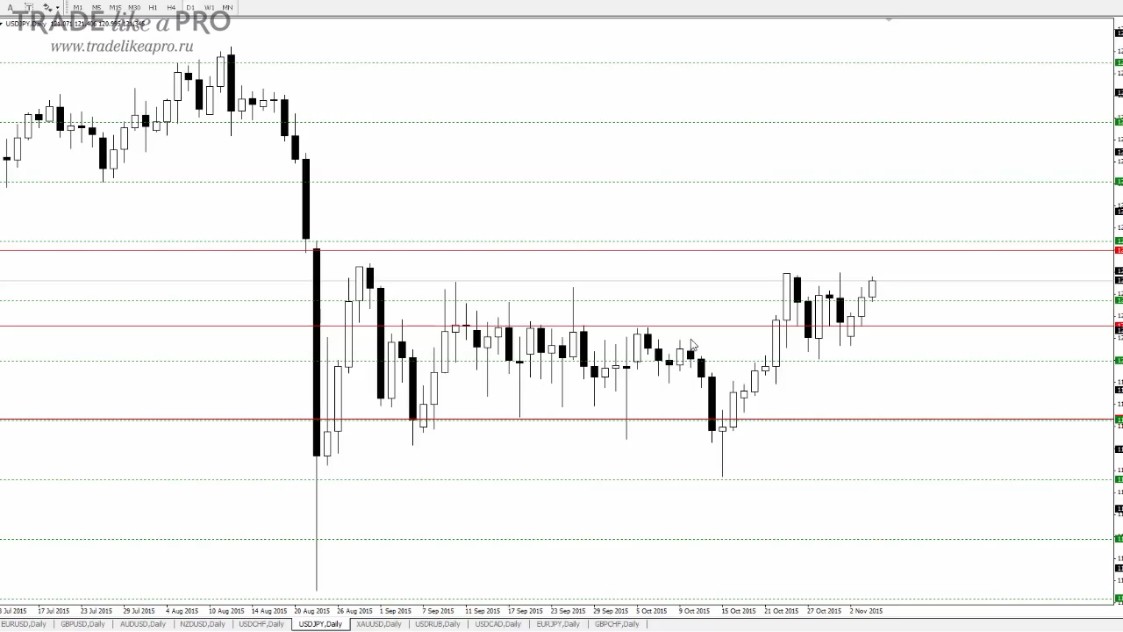
I remind you once again that before this we had a flat movement. After it, there can be a breakout in either direction, therefore here it was possible to take this pin bar, although it was against the trend.
Why? Because there is a noticeable movement, then a level breakout follows, and support from a round level.
The body of the pin bar was below the level, therefore the entry was made by placing a pending buy order slightly above the upper point of the pin bar:
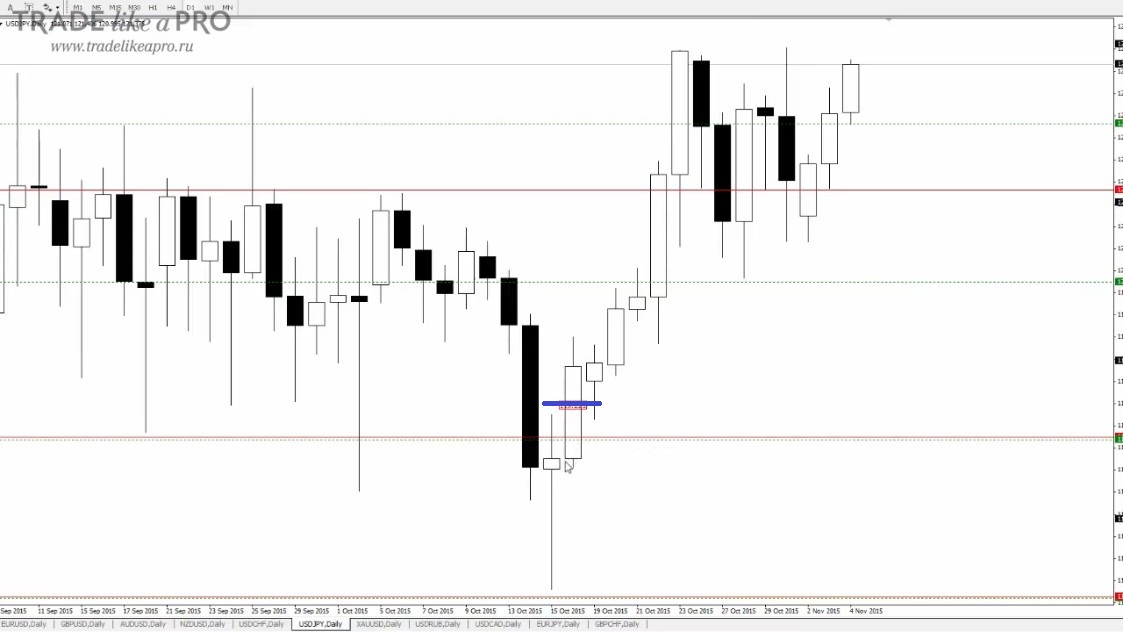
Since there is a level there, confirmation is required that the price has settled beyond it.
I would recommend placing the stop-loss slightly below the low point of the previous candle:
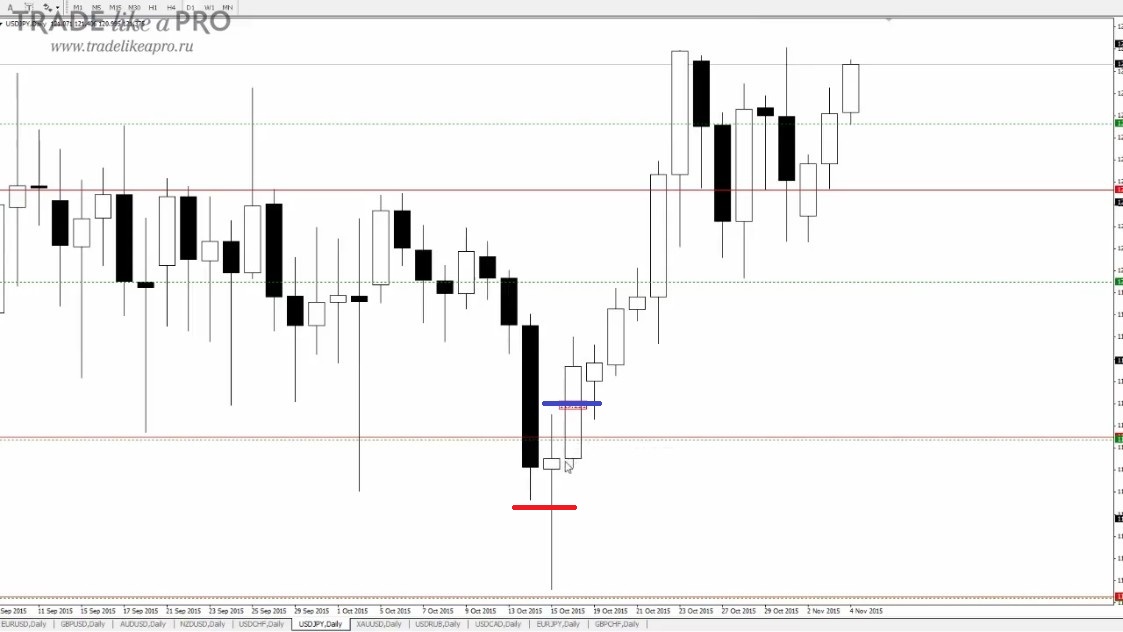
If you place the stop loss behind the long tail, it would then turn out very large, and that is not in our interests.
I would set the take profit at the boundary of the previous flat. Because we do not know whether the upward movement will continue or whether the price will start moving in a zigzag again within this corridor.
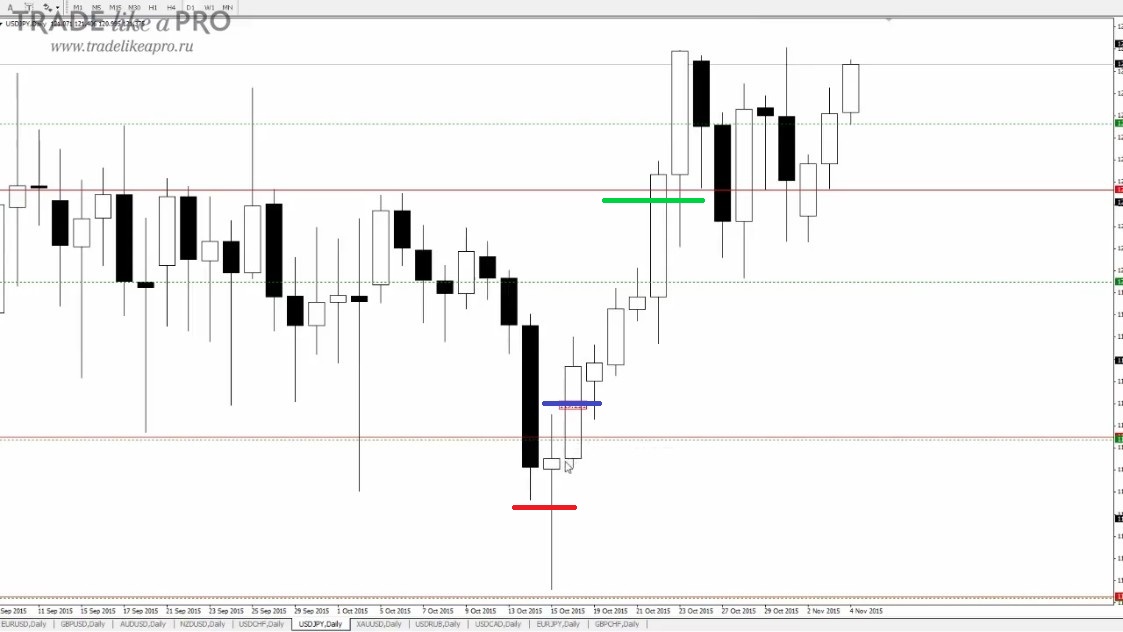
Thus, the take profit in this trade would be 127 points, and the stop loss 68 points.
I would immediately like to note that this was an example of a difficult situation that does not occur on the chart every day.
Let us move on to the next example, but take a simpler situation for it.
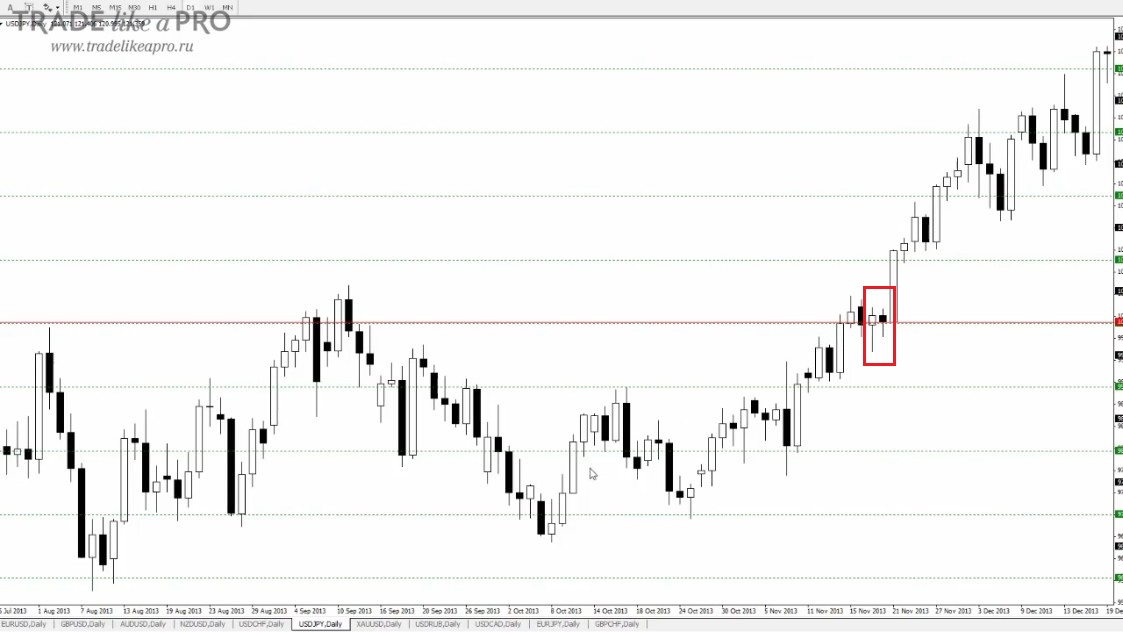
We see a prolonged flat, where no clear trend is observed. The latest movements indicate bullish sentiment, after which a pin bar appears, and then another one next to it.
How would we act here?
Since the upper boundary of the pin bar is not far from the level, it is logical to place a pending order slightly above the high point of the pin bar:
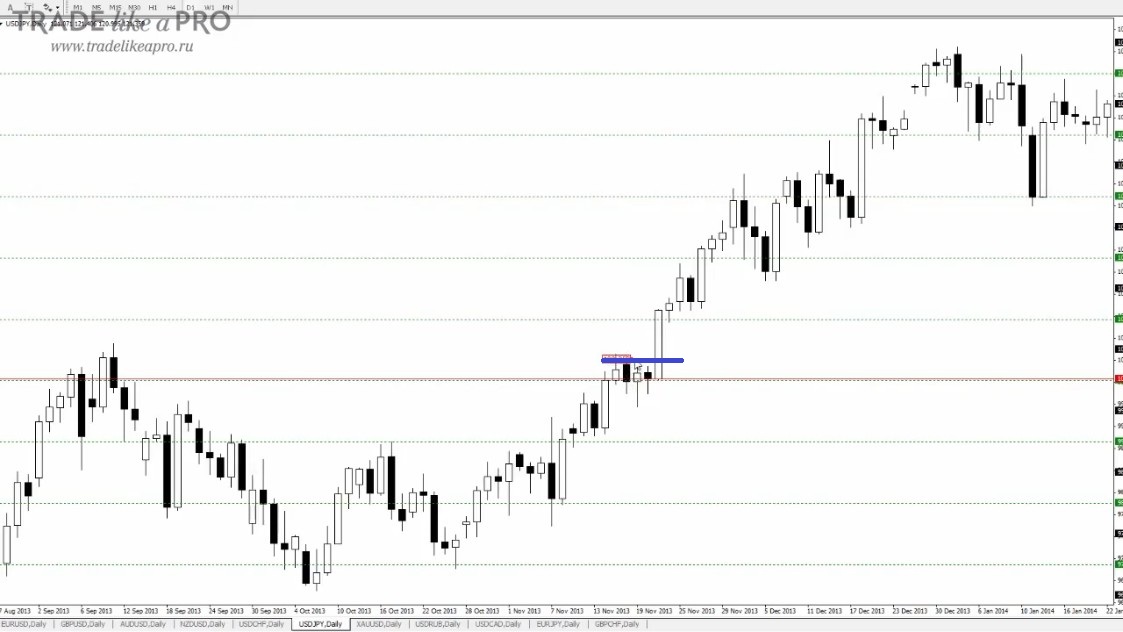
Please note that it does not stand out strongly on the chart, but this is not a critical entry factor.
The stop loss could have been placed behind the tail using the classic method, and then moved closer to the tail of the new pin bar:
Thus, we would reduce the risk in this trade a little.
The most logical thing would be to exit the buys at the round level 101, which could quite possibly turn out to be an obstacle:
Let us look at another example of a trend pin bar:
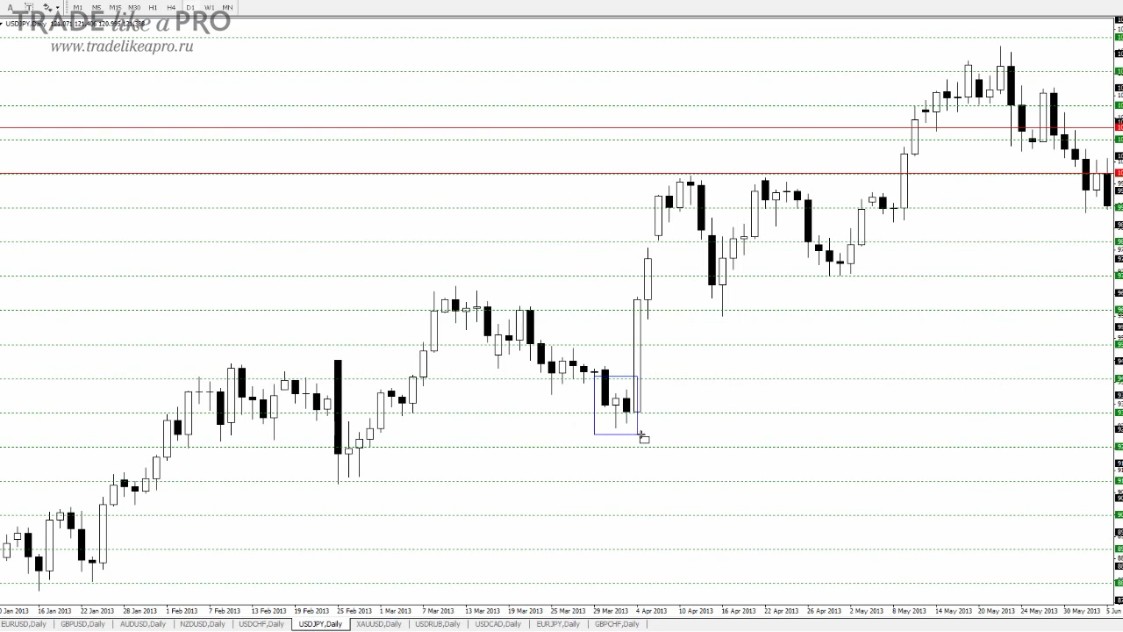
We see that it rests on a weak level. In this case, I would enter near it:
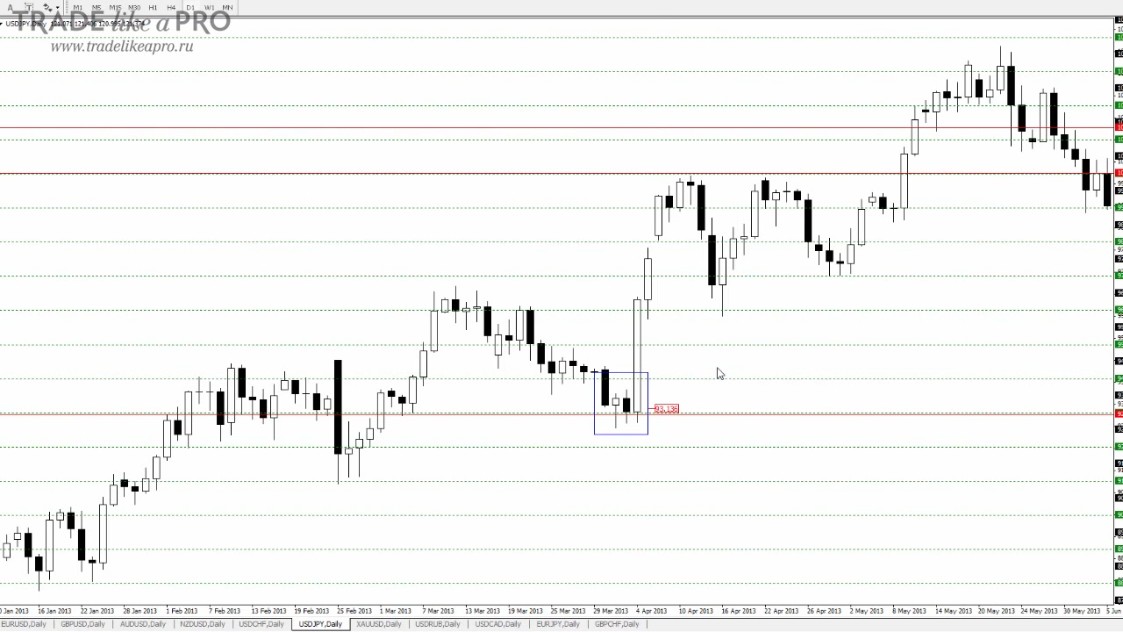
I would set the stop loss slightly below the low point of our pin bar:
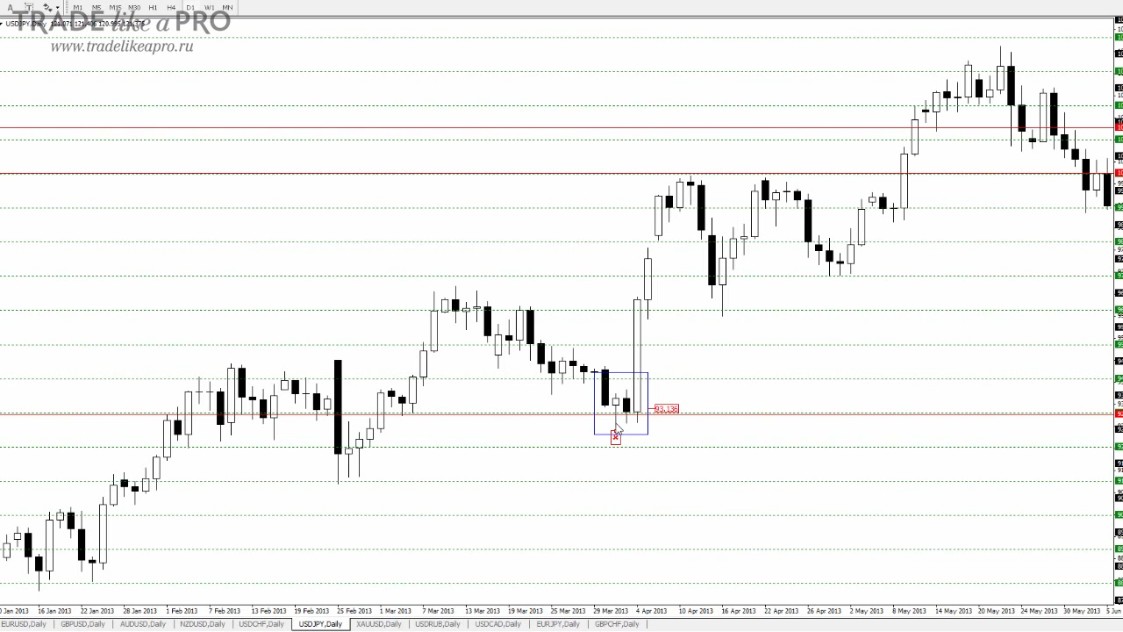
It is not far from the level, so here everything would take place according to the classic method of setting a stop loss.
After the next candle had formed, it would be possible to move the stop loss slightly below its low.
This would reduce its size and, consequently, our costs:
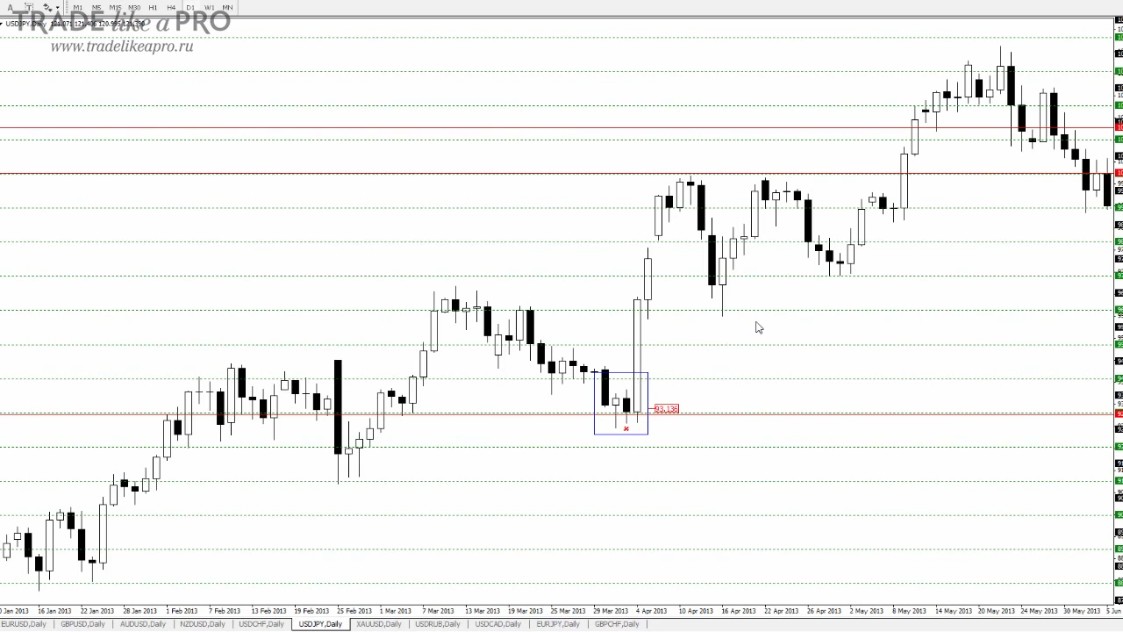
I would have exited the trade after the GAP:
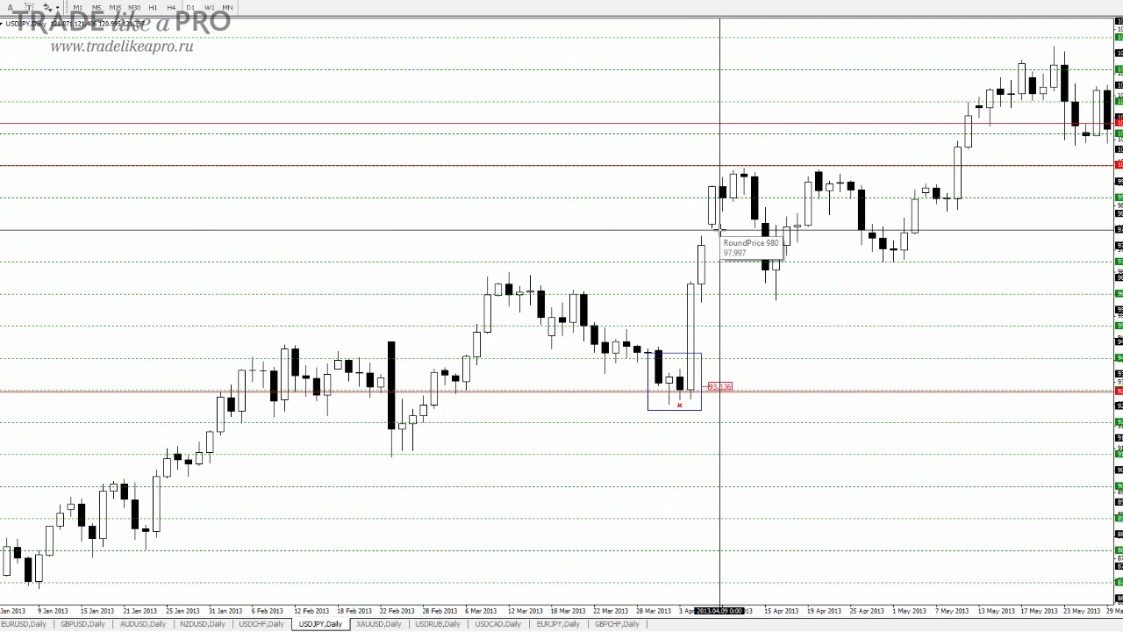
We know that GAPs tend to close. Therefore, I would not take extra risk.
Even if we had exited on the GAP, the stop-loss would have been 60 points, and the take-profit 490 points.
A pretty good trade.
Another trend pin bar on the daily chart for everyone's favorite pair, EURUSD.
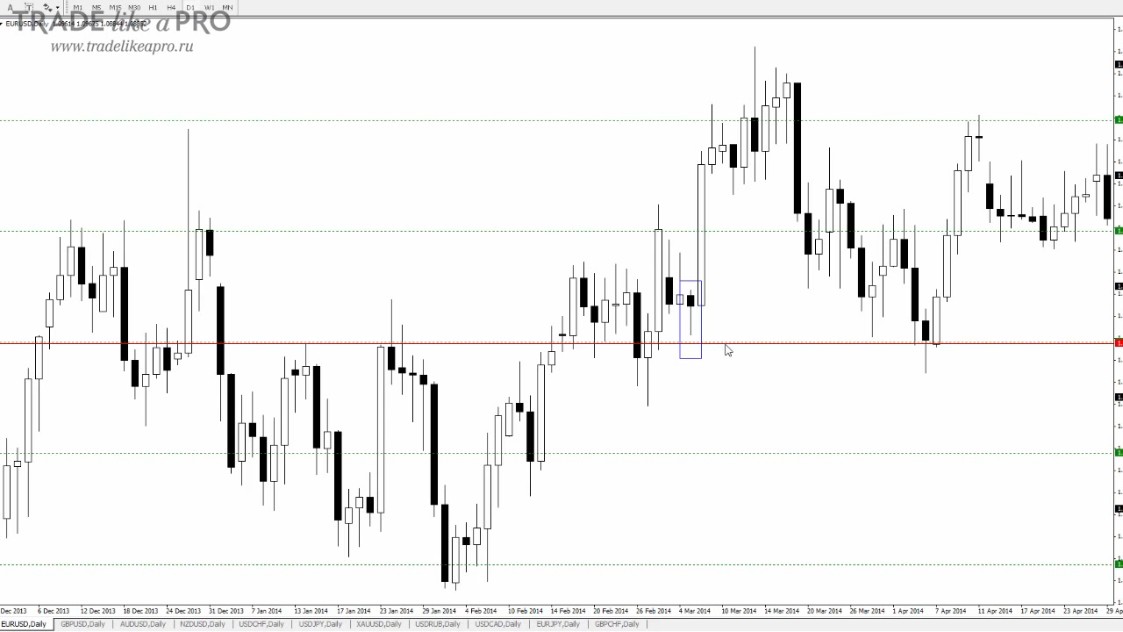
This pattern has support; the level is located not far from the pin bar.
But it is worth considering that the pin bar rests on the level only with its tail, so in this case we place it beyond the candle's tail:
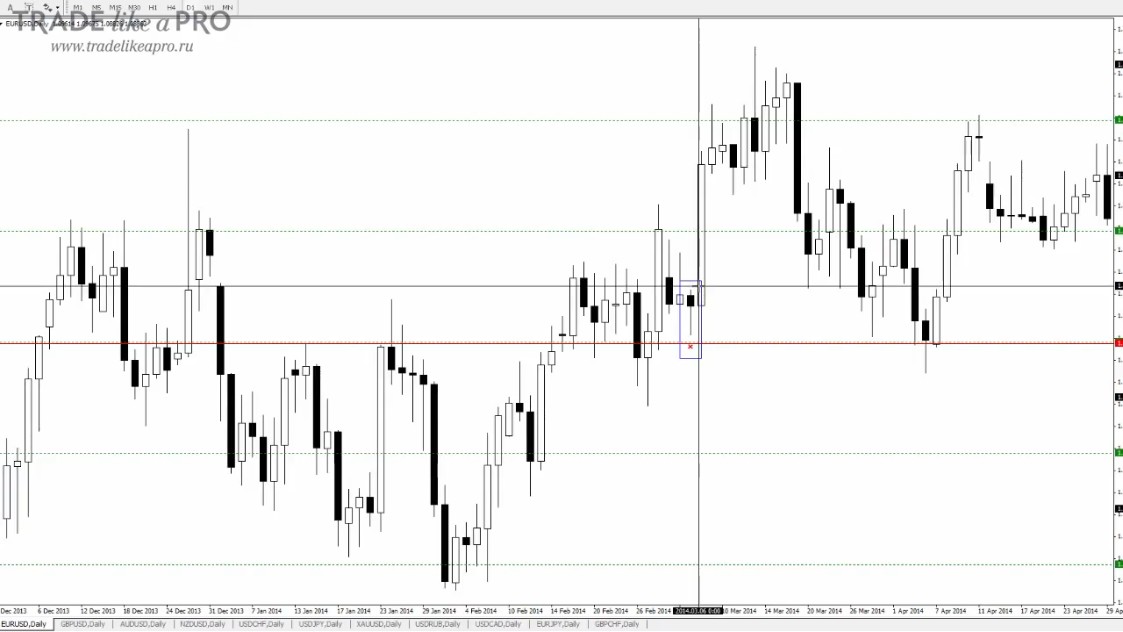
The trade's stop loss would have been about 54 points.
Since the pin bar is not too clearly distinguished on the chart, the entry would be only above the high point:
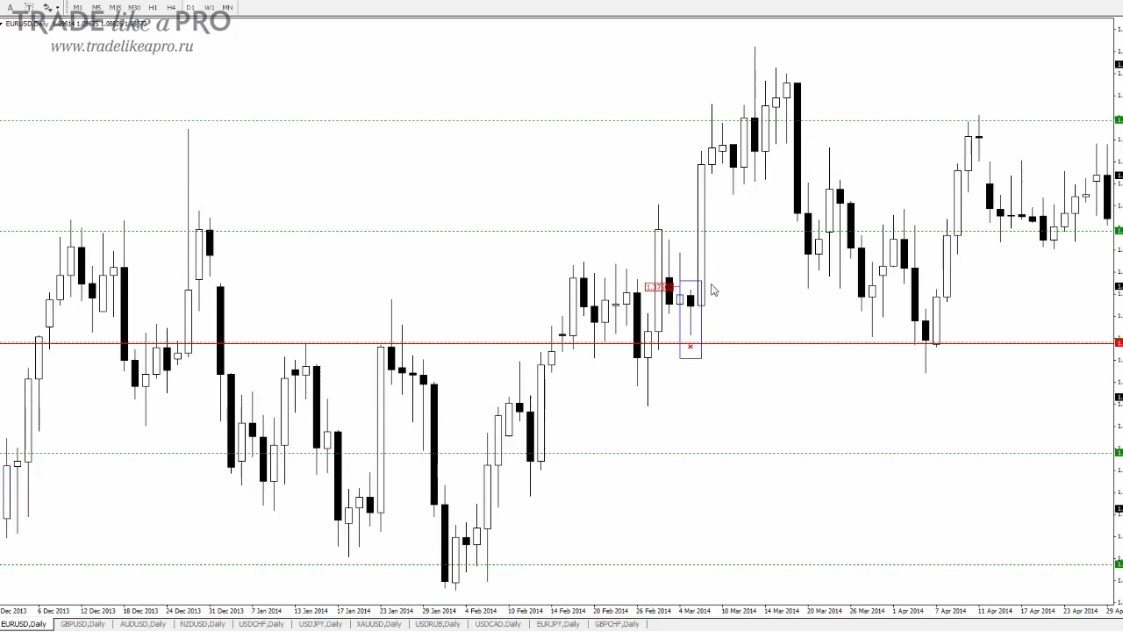
I would set the take-profit at the upper point right here:
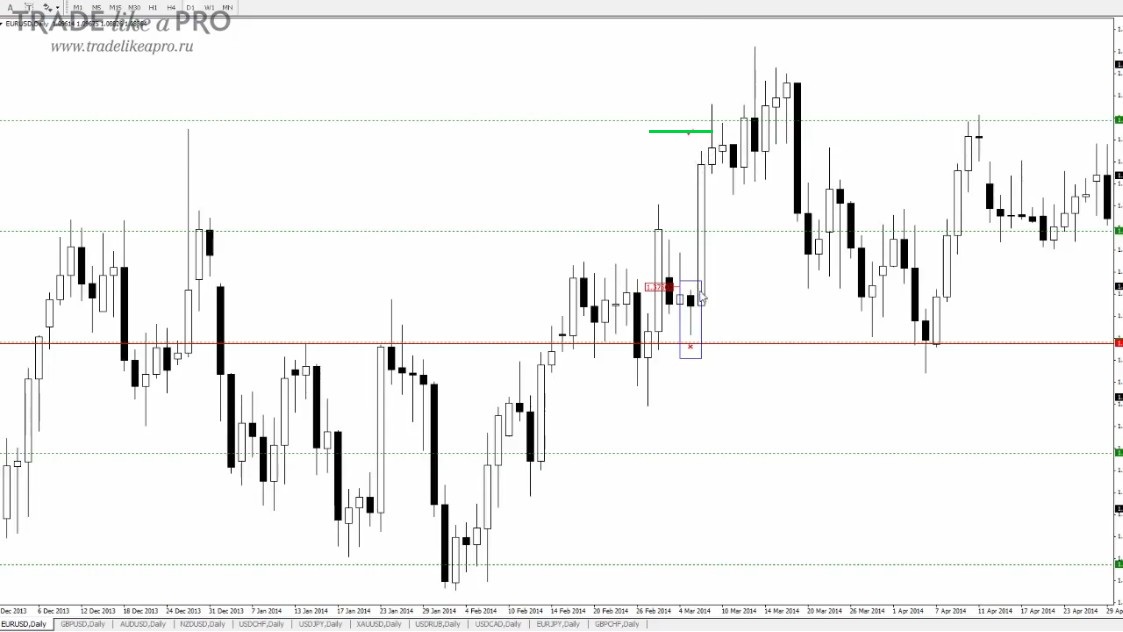
Despite the fact that the stop-loss was large, the take-profit made it possible to exit the trade with a profit.
Conclusion

In conclusion, I would like to advise you to pay close attention to pin bars. This pattern is one of the strongest in the Price Action arsenal.
Do not enter the market against the trend, but only with the trend or after a flat, when there are noticeable movements that precede the pin bar.
Set stop-losses, take levels into account, and do not forget to exit with a profit.
Best regards, Pavel Vlasov TradeLikeaPro.ru