
Price Action: Inside Bar

I continue to publish materials on the Forex trading method called Price Action. The topic of today's video is the Inside Bar pattern. The inside bar, along with the Pin Bar, is a very powerful Price Action setup if used wisely.
This setup is quite well known among Forex traders and is one of the fundamental ones in the Price Action methodology. Most often it is classified as a continuation model of the main trend, although it can also act as a reversal model.
In general, the Inside Bar is a pattern for prepared traders, since beginners in Forex may have difficulties interpreting it. However, if you know how to use the inside bar correctly and what you should pay attention to, then with its help you can catch quite strong trends.
We will talk about this and much more in today's article.
What Does an Inside Bar Look Like?
An inside bar is a full-bodied candle followed by a small candle that lies entirely within the range of the previous full-bodied candle:
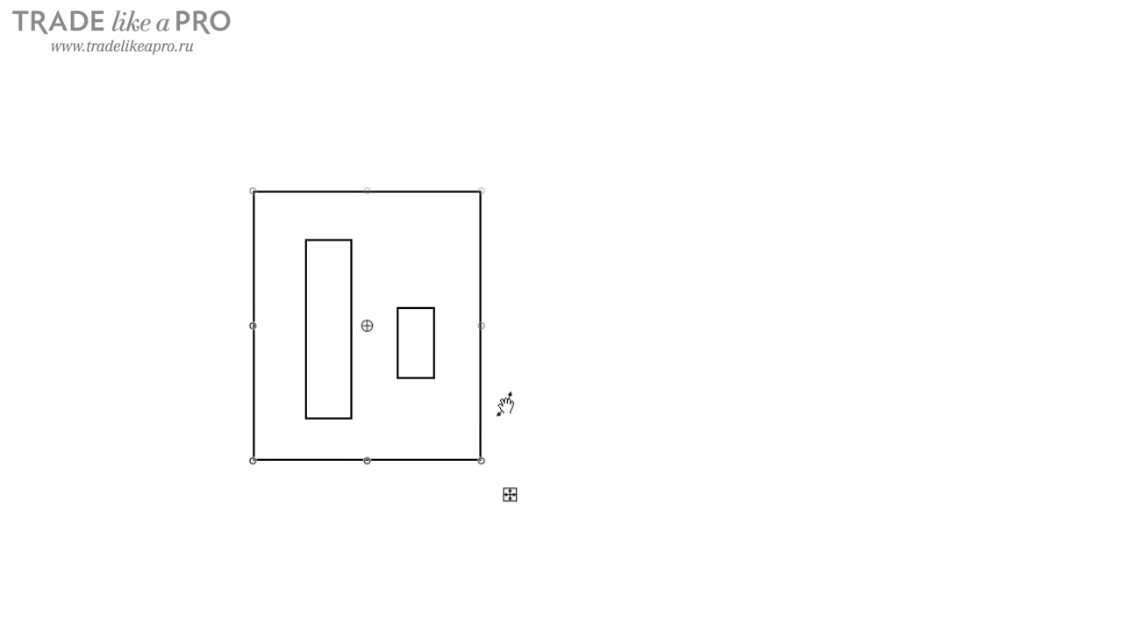
The first full-bodied candle is called the mother candle. This candle should be at least twice as large as the inside candle.
If you see a full-bodied candle on the chart followed by a candle that is inside its range, but it is large in size, then this combination is not a proper inside bar:
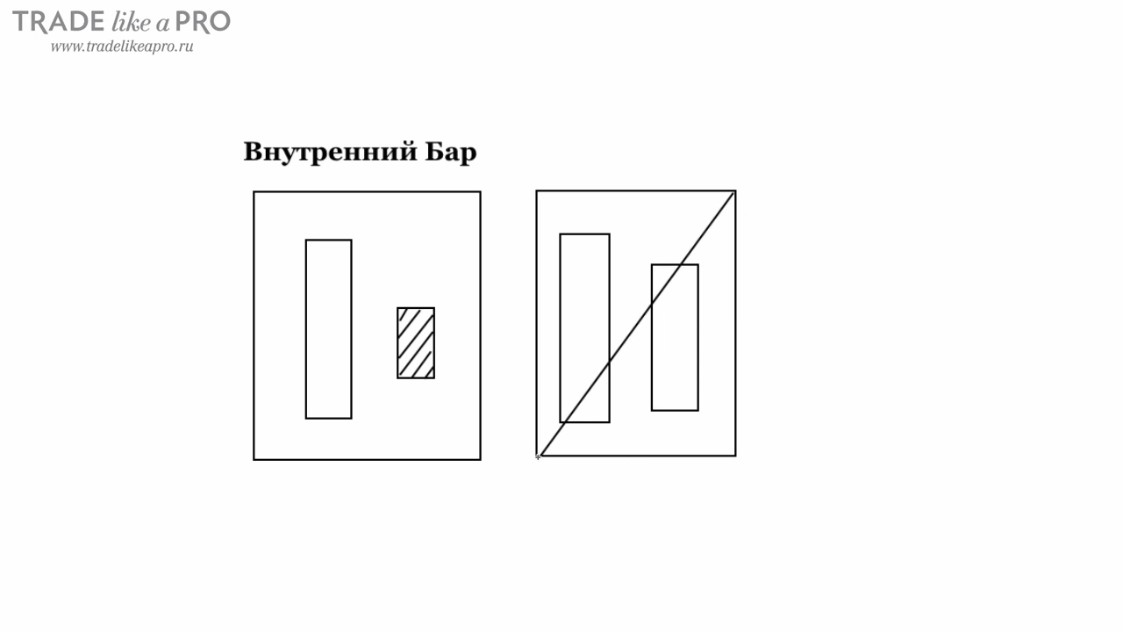
Why? Because in this case the whole logical meaning of this setup is lost. Why do we take this phenomenon into account and why can we trade by it? To do this, it is worth answering another question.
What Does This Pattern Mean?

It means that the force of the current movement has run out, since the next candle is small, and a temporary agreement in price has appeared between buyers and sellers. We can say that this is a small truce before a new battle. During this truce, we can enter the market and follow the established trend. Or enter against the trend.
Next, we will examine which direction to enter correctly and what you should pay attention to.
Just as with other Price Action setups, we need support from a support/resistance level. If you saw an inside bar hanging somewhere in the middle of the chart, then you should not get into such a trade, because the pattern has no support underneath it.
Directly on the chart, the inside bar looks as follows:
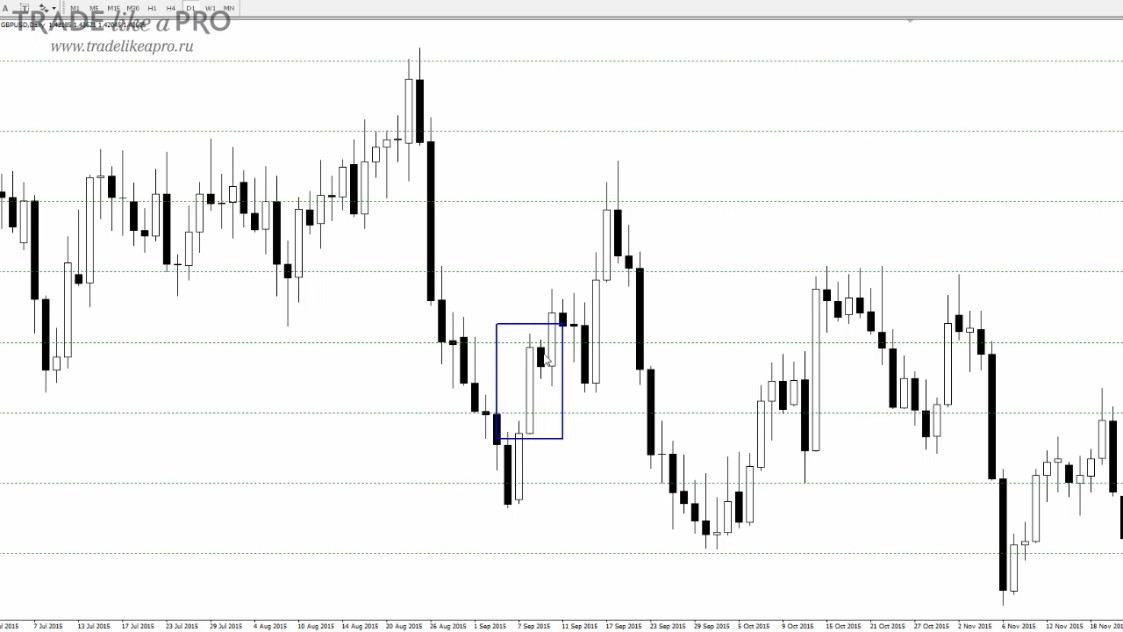
As you can observe, first there is a full-bodied candle, and then a small one follows. In this example, we had an inside bar that was countertrend.
It relied on this level:
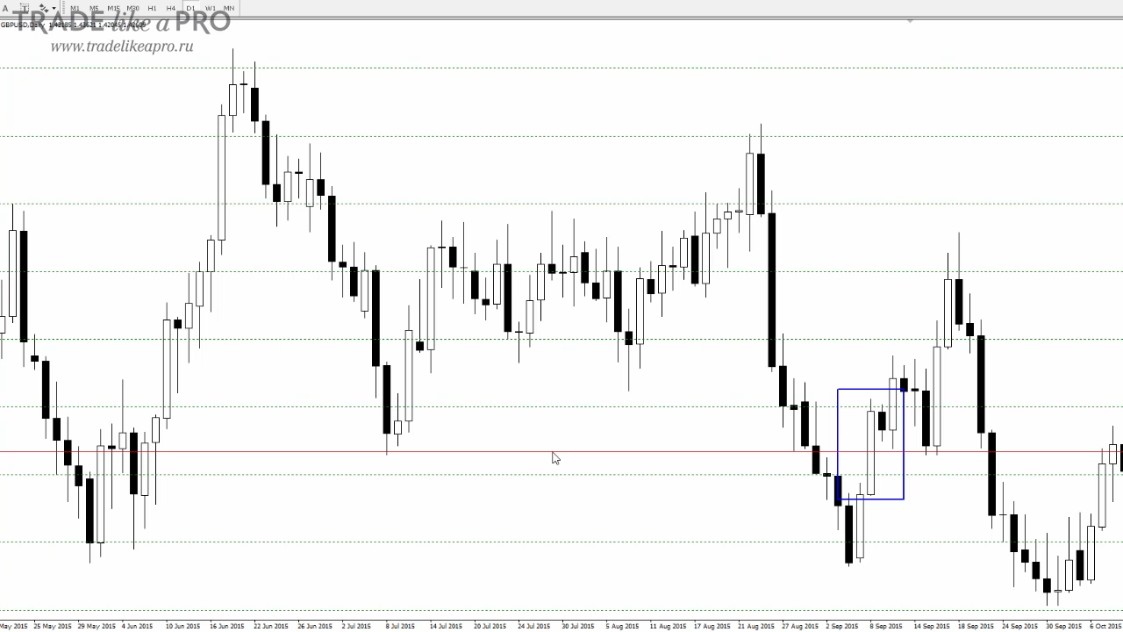
The interesting thing is that it is not at all necessary for the mother candle to rest on the level with its base. If the inside bar itself stands on the level and has support, then you have every reason to enter the market.
This example, depending on the interpretation and the market entry trading method you use, would most likely have brought a loss. However, with a certain approach, it could also have brought profit.
Another example of this setup:
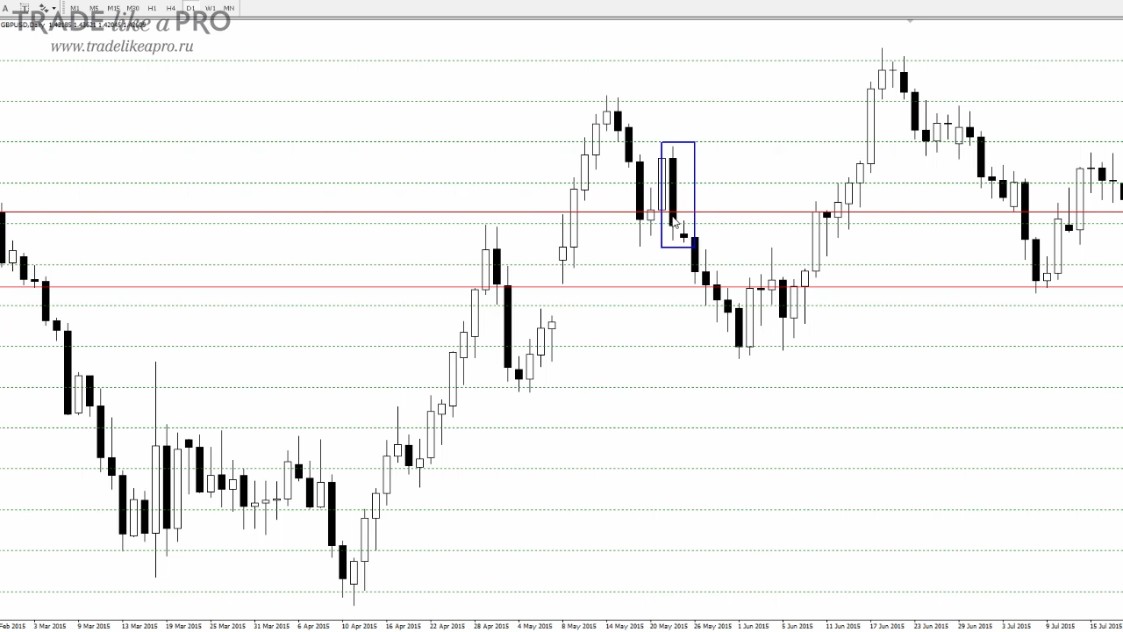
The mother candle breaks the level, and then an inside bar appears that rests on the level. And specifically on the round level 1.5500. As we know, round price values are important support and resistance levels in themselves.
In this example, it is worth paying attention to the fact that the low point of the inside bar is lower than the low point of the mother candle. Such a discrepancy is acceptable. Since this is a daily chart, 4 points can be considered a minor discrepancy.
Remember that technical analysis is an art, not an exact science. And small deviations do happen, so this setup remains valid.
How to Enter the Market Correctly?

Let us assume that we were able to determine that our setup is high-quality, stands at a level, and matches our trading technique.
There are two most common techniques for entering on an inside bar:
- Classic: entry on a breakout of the mother candle.
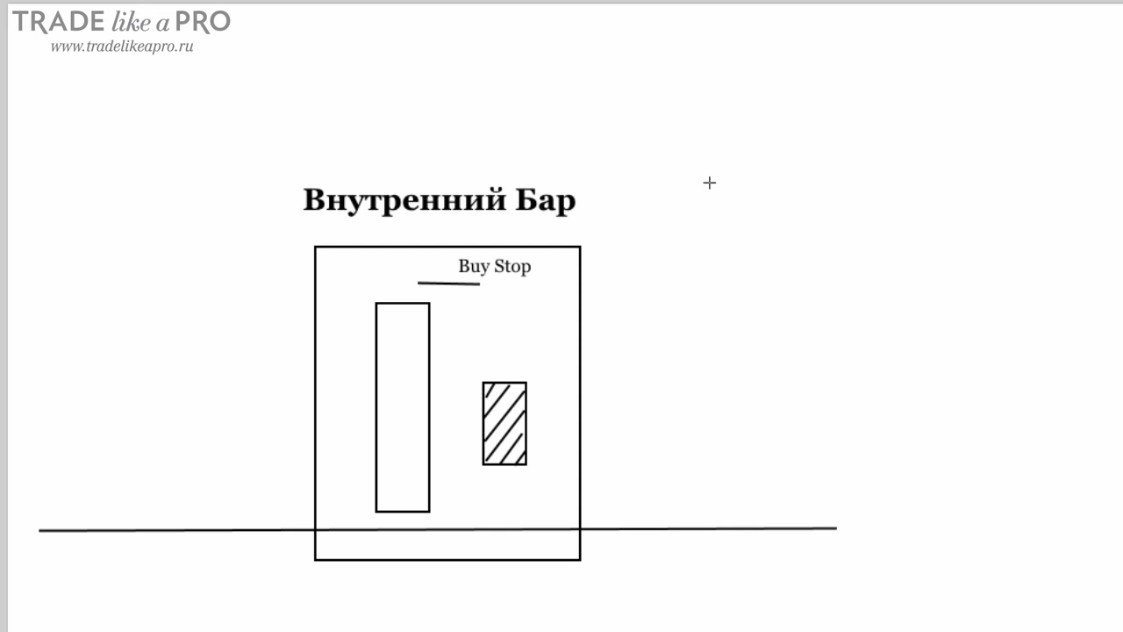
- Entry with a pending order on a breakout of the inside bar itself:
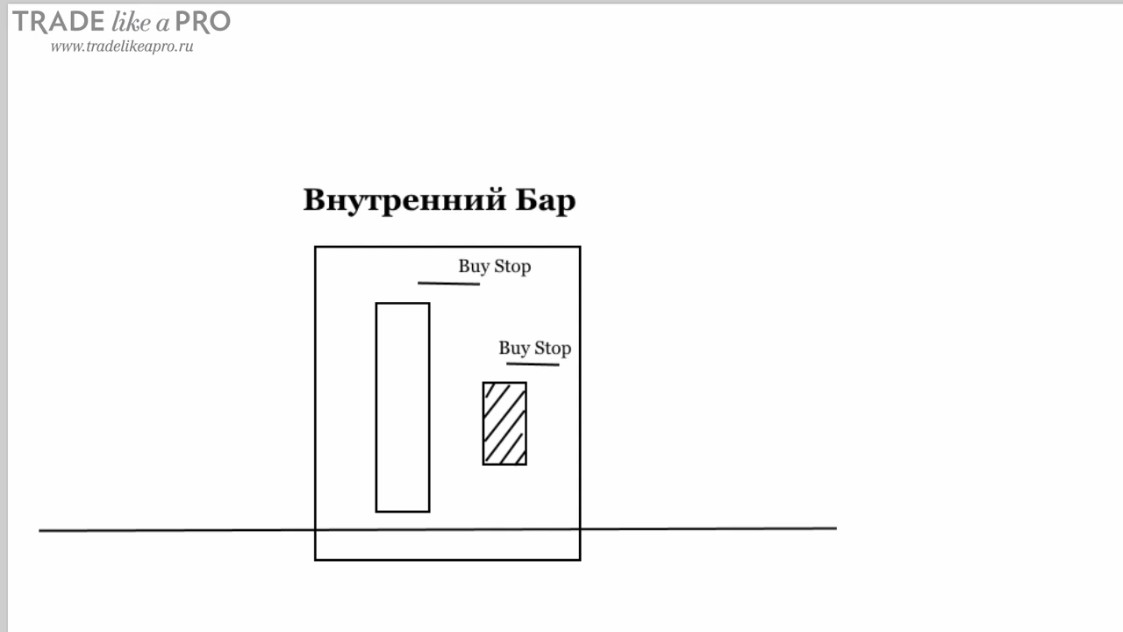
Which method will be the most correct for your trading?
Everything depends on how confident you want to be about entering the market. The classic entry on a breakout of the mother candle at the high or low point works more slowly. The point is that you enter the market later, but in return you get more confidence in the chosen price direction.
Entry on a breakout of the extreme point of the inside bar is earlier, but at the same time riskier. You will enter the market sooner, but if price breaks the extreme point of the inside bar and then reverses, your stop loss will be triggered, which might not have happened otherwise.
Personally, I am inclined to work with a breakout of the mother candle. At the same time, you always need to look at the situation. You need to assess where the inside bar is located in relation to the mother candle, how large the mother candle was, and where the level representing support is located now. All this requires that you have experience in the Forex market.
How to Set a Stop Loss Correctly?
In any trade, we always set a stop loss. This is necessary to protect your trading account and avoid taking large losses. There are several options for setting a stop loss for this setup.
The first of them is the classic one. The stop loss is placed beyond the opposite edge of the mother candle:
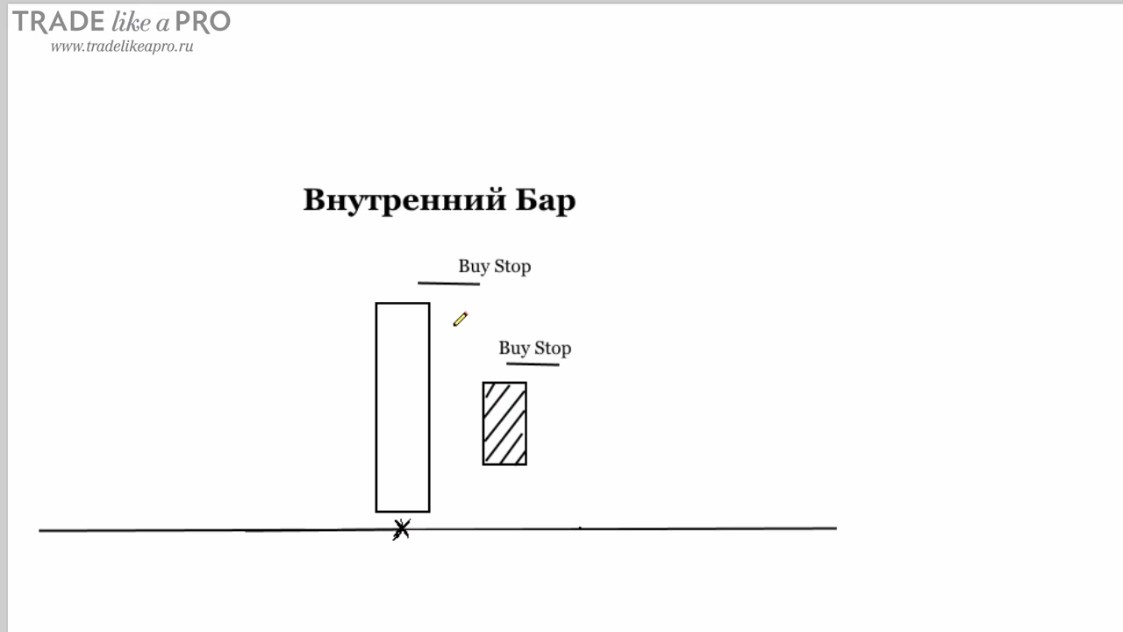
This option is not very effective, because the mother candle can be very large, therefore the stop can also be too large, and if such an order is triggered, it will hurt your deposit quite a bit.
The next option is placing the stop loss beyond the level:
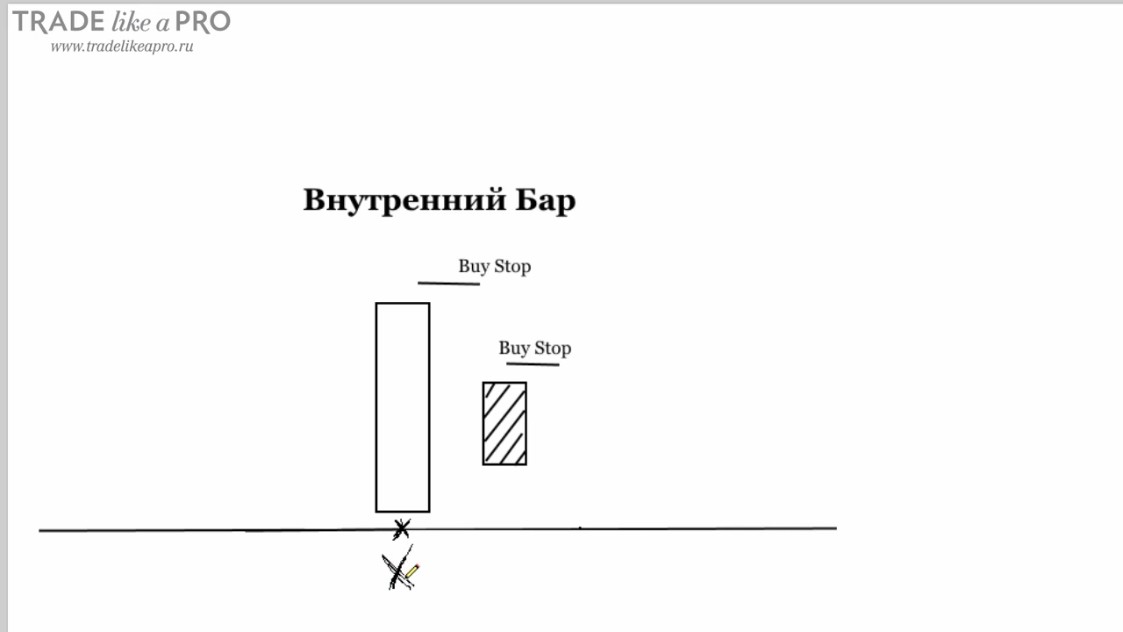
This option is already more reasonable, because crossing the level would mean that we were wrong. It should be used when it is appropriate. That is, when it does not carry risk in an enormous number of points. If the level is not very far from the entry, then this option can definitely be used.
And the final option is placing the stop loss beyond the opposite edge of the inside bar itself.
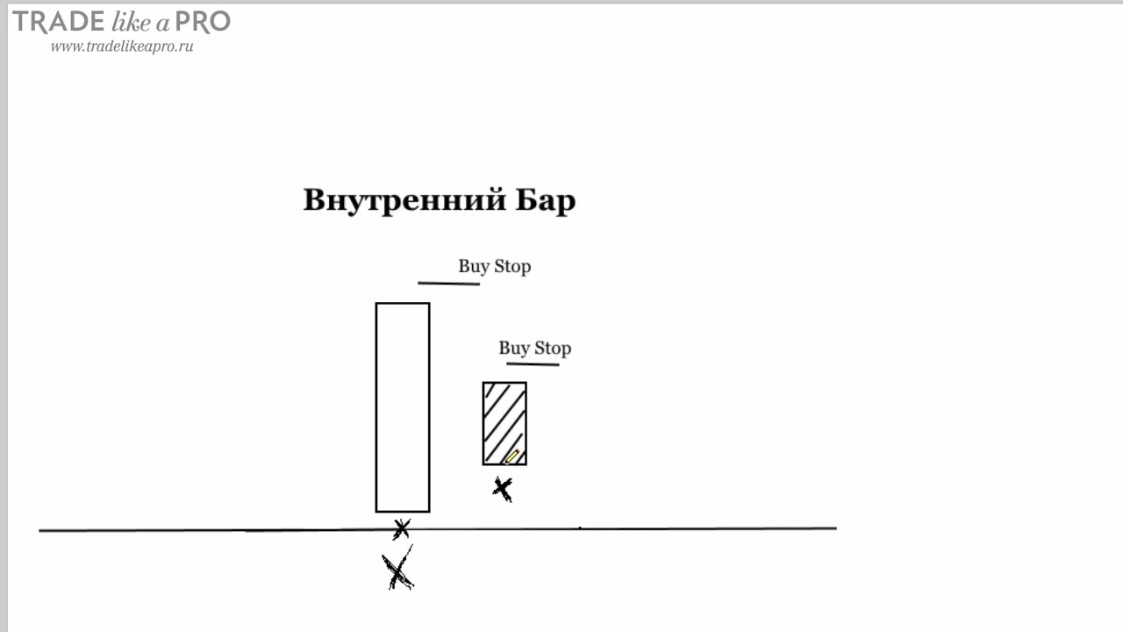
This is also an adequate trading option.
One might think that such a stop loss is very easy to knock out. Let this cause us to make mistakes many times, but it will also allow us to periodically take profitable trades that will be several times larger than our initial stop loss.
Thus, when we are wrong, we will lose a minimal number of points.
How to set take profit correctly?
After we have set the stop loss, we need to set a target and place the take profit.
What options are possible here?
First, you can place the take profit at the next support/resistance level:
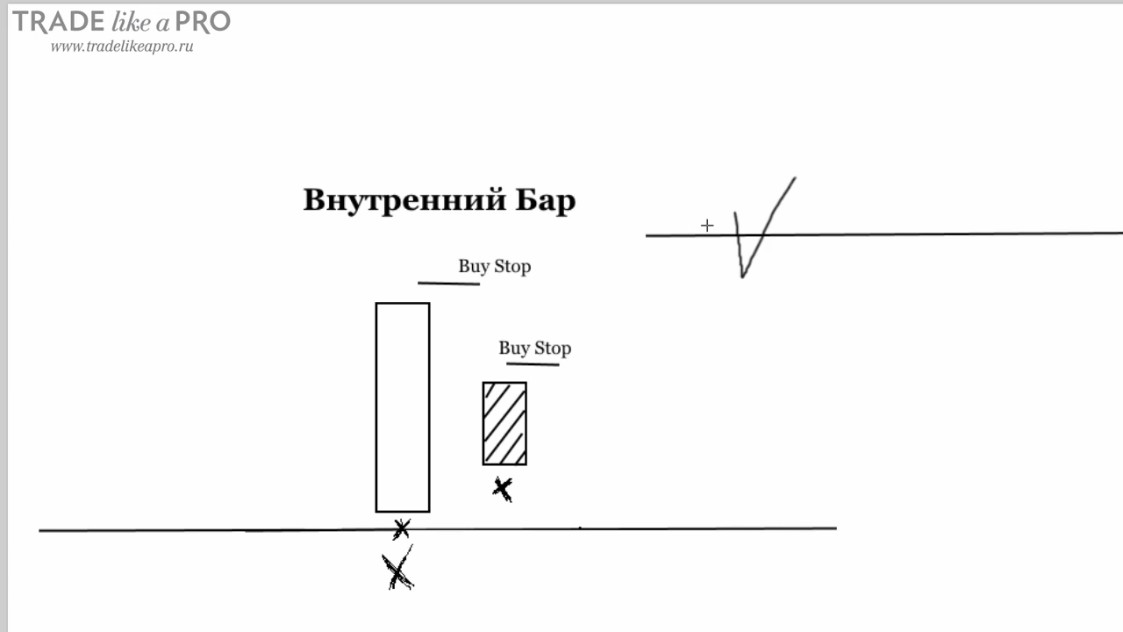
Second, the stop loss multiplied by an N-th number of points.
A fixed take-profit equal to 30-40 points on the daily chart is also possible. If you trade on lower charts, then use a smaller number of points.
This option will suit those who like confidence that profit will be taken. It may not be quite as large as it could be, but the probability of getting it will be high. If you use such an approach with a small stop loss, then it is quite viable. We can also use a trailing stop in order to exit trades automatically.
Let us imagine that our stop loss is set at 20 points. The price moves 40 points, and we move the trade to breakeven. That is, we move the stop loss to the entry point level. Next, we set a trailing stop or some distant target. Even if the market turns against us, we will still lose nothing. The most common methods of taking profit for this setup are the next level, a fixed number of points, and the stop loss multiplied by n.
Which of them is best to choose?
It depends on your trading and the market situation. For beginners, I advise using a fixed level. Set a certain number of points, depending on the currency pair and the timeframe. But it is worth remembering that this fixed number must be greater than the inside bar itself.
Nuances of working with the inside bar

Enter with the trend
I am sure that you could have read and heard this many times already, but I still want to repeat that you need to enter with the trend. This increases the probability of making a profit on the trade.
Size of the mother candle
If the mother candle is disproportionately huge and exceeds the inside bar by 10 times, then most likely a significant pullback will follow and such a setup is not worth taking.
If the mother candle is too large, then it is best to skip such a setup:
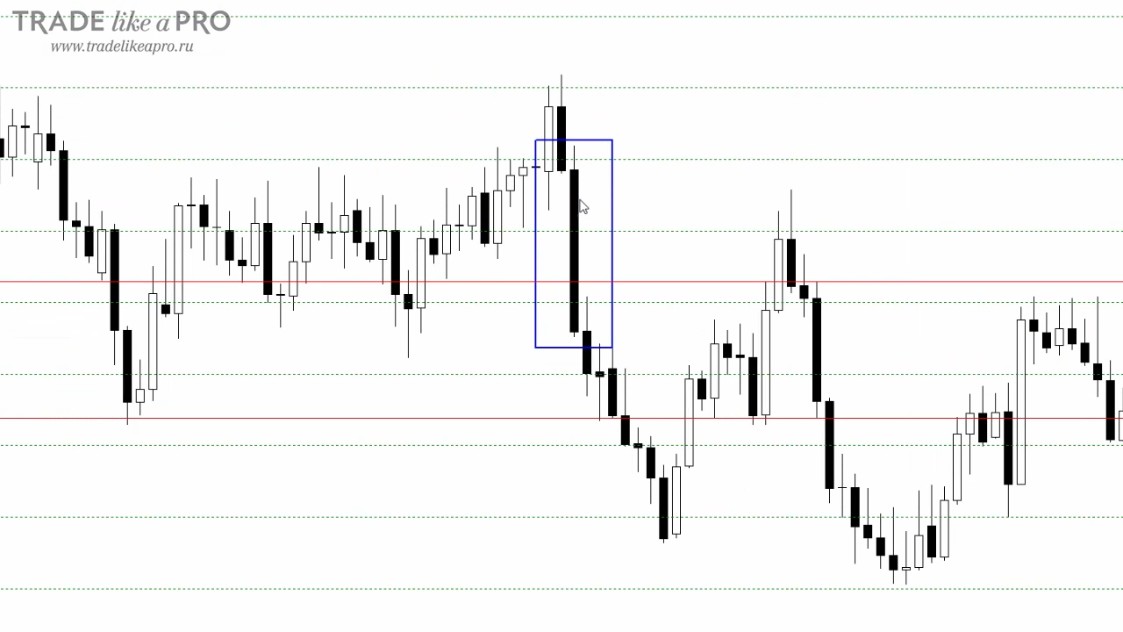
If an inside bar formed after such a candle, then it is not worth entering the market. The candle is too large and there is a high probability that a pullback is possible. We try to skip large candles.
Do not trade flat
Any setup consisting of one or two candles should come after some kind of movement. If candles are moving one after another and a setup appears, then there is no need to get into it. Better to skip it than to risk in vain.
Take small inside bars
As we found out earlier, an inside bar means temporary agreement in price between buyers and sellers. What kind of agreement in price can there be if the inside bar is large? If it is not small, then there is no agreement, and most likely the market situation is completely different.
Enter in the direction of the inside bar
This can significantly increase the effectiveness of your work with this setup. What do I mean?
Let us imagine that the mother candle is bullish, and the inside candle is bearish. That means we consider entry only in the direction of selling. If the inside bar is bullish, then we consider entry only for buying.
Why does this happen?
As we found out earlier, the inside bar is temporary agreement between sellers, but there is still some imbalance. That is exactly what the inside bar shows. In my trading, I try to take setups that match the color of the inside bar. If the inside bar is bullish, then we look for an opportunity to enter buys. If the inside bar is bearish, we look for an opportunity to enter sells. This filter will help increase the overall profitability of trading this setup. Remember that you can also ignore the color of the inside bar. It will work in any case, but the effectiveness of the pattern will be slightly lower.
Trade only during the American and London sessions
Like other Price Action setups, the inside bar starts to work well from the hourly timeframe and higher. If you trade intraday, then try to trade during the American or London session. Because after we have found an area of agreement between sellers and buyers, we need some movement to take profit. If the setup forms during the Asian session, then such movement may not happen, but if so, what is the point of entering the position, right?
If the inside bar is a doji or a pin bar
If the inside bar formed a doji pattern or a pin-bar shape, then in such cases I would not advise getting into the market, because the situation is unclear:
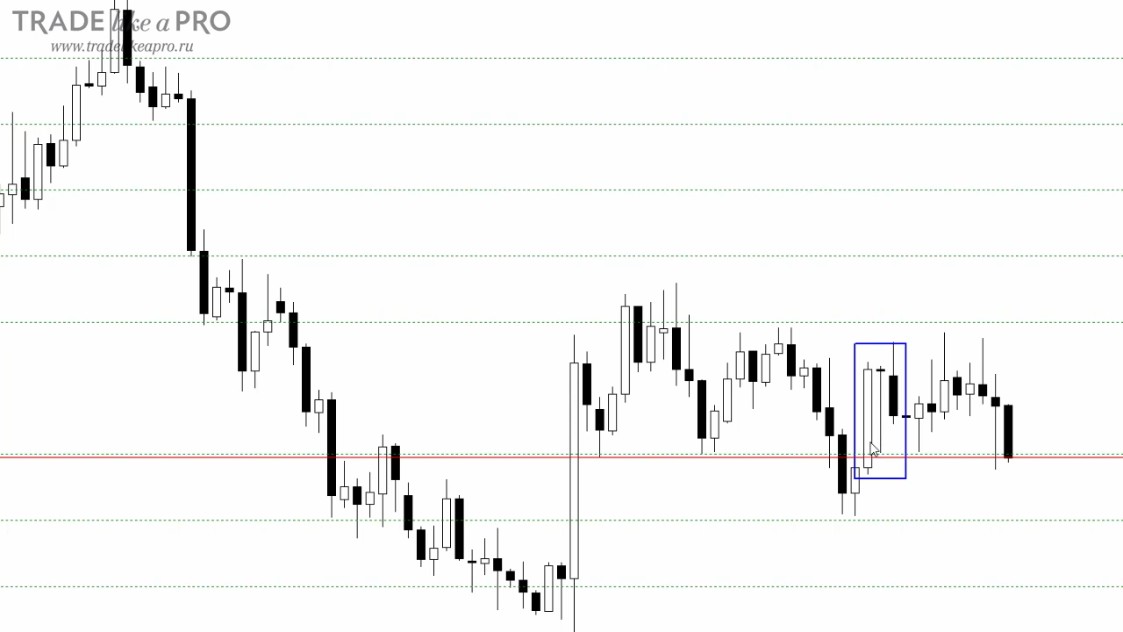
The chart shows a bullish candle, followed by an inside bar. But at the same time this bar is a pin bar with a huge tail. It is better to skip such a signal. It is better to calm down and wait for further developments. As you can observe later, nothing special happened on the chart.
Several examples
On the chart we can observe an inside bar with support at a level:
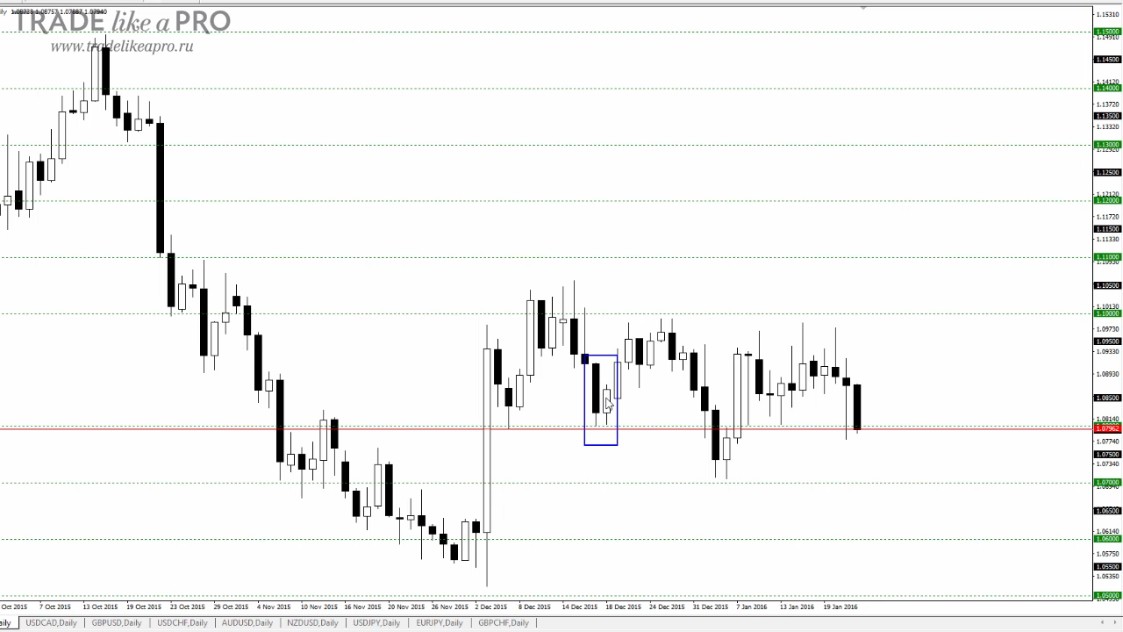
Pay attention to the fact that the inside bar takes up half of the mother candle, and in this case I would not recommend entering the market.
Even if later we observe a small rise, next time everything may turn against your positions.
Another pattern that should have been skipped is shown in the next screenshot:
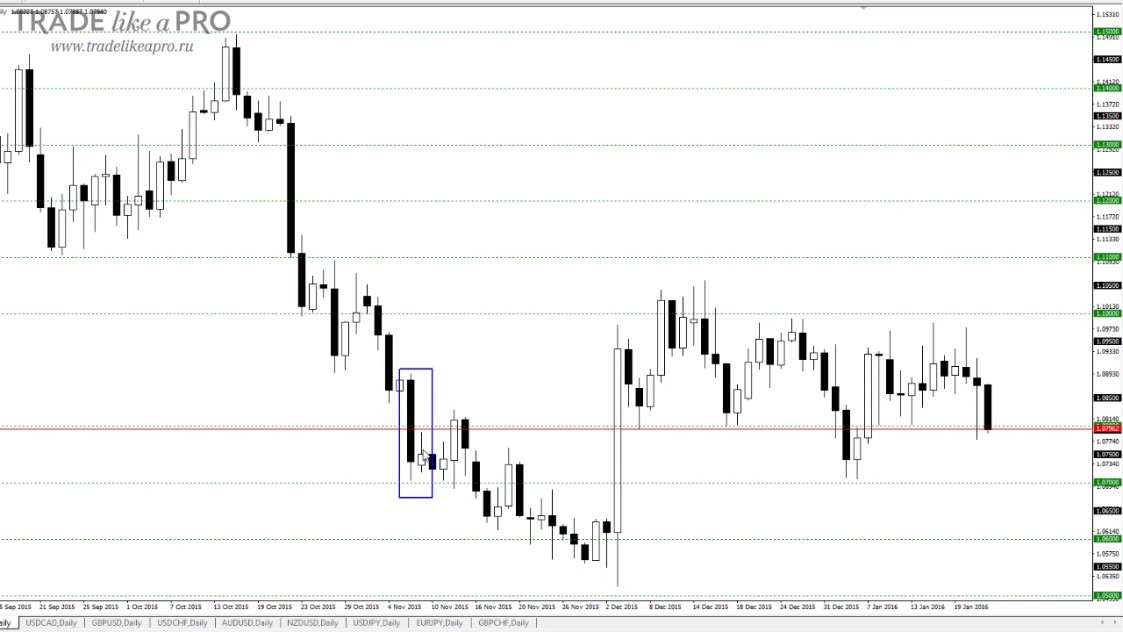
The inside bar has a very long tail. As we can observe later, no rise occurred, so here we would not enter the market.
The next example shows an adequate situation:
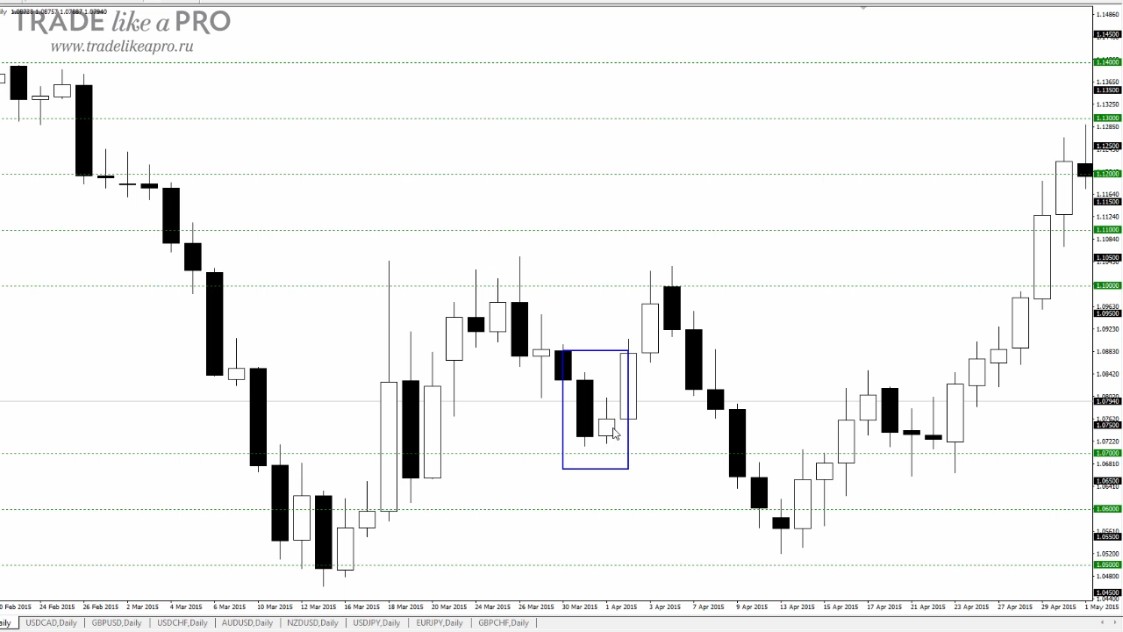
The inside bar is within reason. The tail is a bit long, but not critical. We can say that there was agreement in this place.
Pay attention to the fact that the bar was bullish. That means the most adequate option would be to trade buys. Next we can observe movement upward. The nearest resistance level is located slightly below the inside bar. In this case it was possible to enter buys with a pending order slightly above the high of the inside bar and take some profit.
We would place the stop loss slightly below the low point of our inside bar:
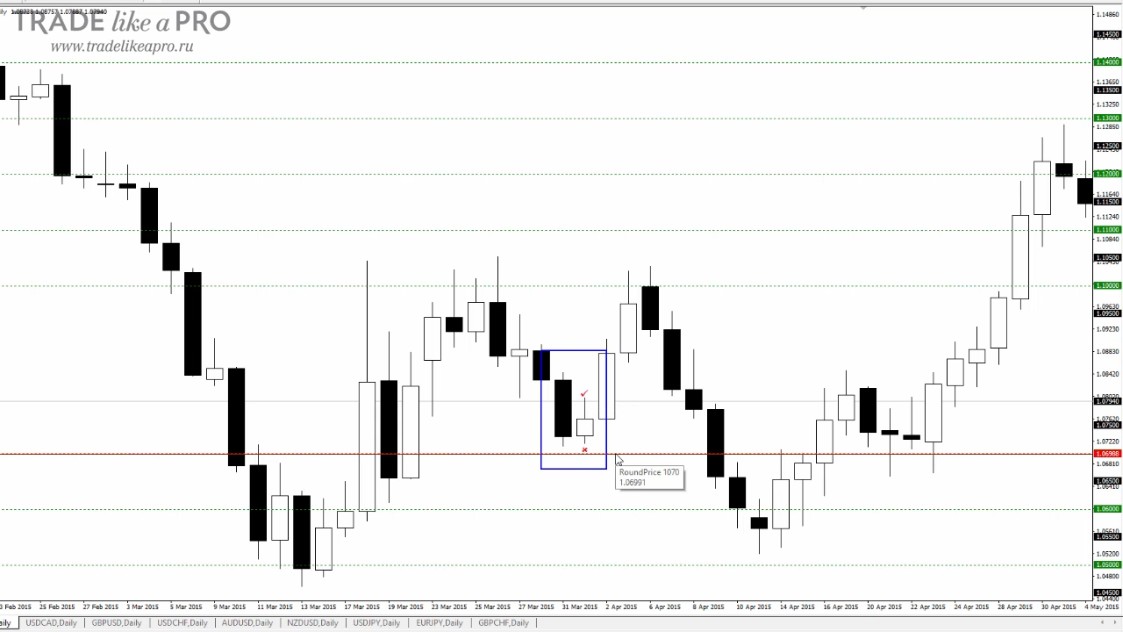
With such a not very strong resistance level, I would consider a small target the size of the inside bar. In this case, about 85 points. And although we could have taken a slightly larger number of points, with such weak support it is not worth taking much risk.
Now I would like to show you the following section:
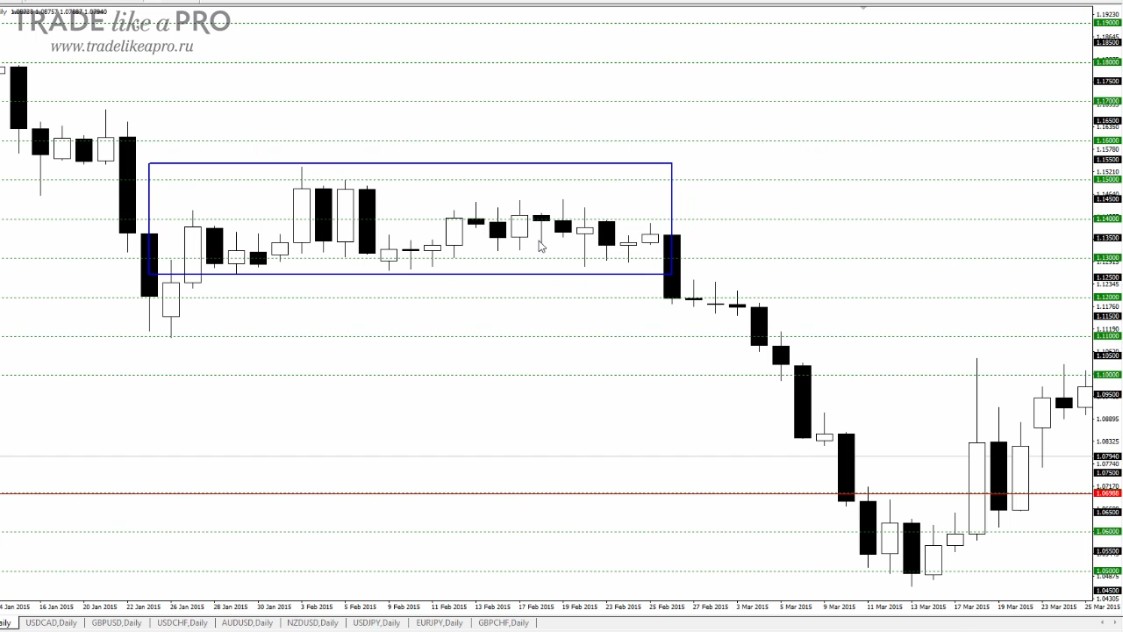
Here you can find: pin bars, inside bars, rails, and much more. But there is no preceding movement on this segment. Therefore, we simply ignore this price behavior. Any pattern consisting of one or two candles must be preceded by some movement that is visible to the naked eye.
Let us consider one more interesting example:
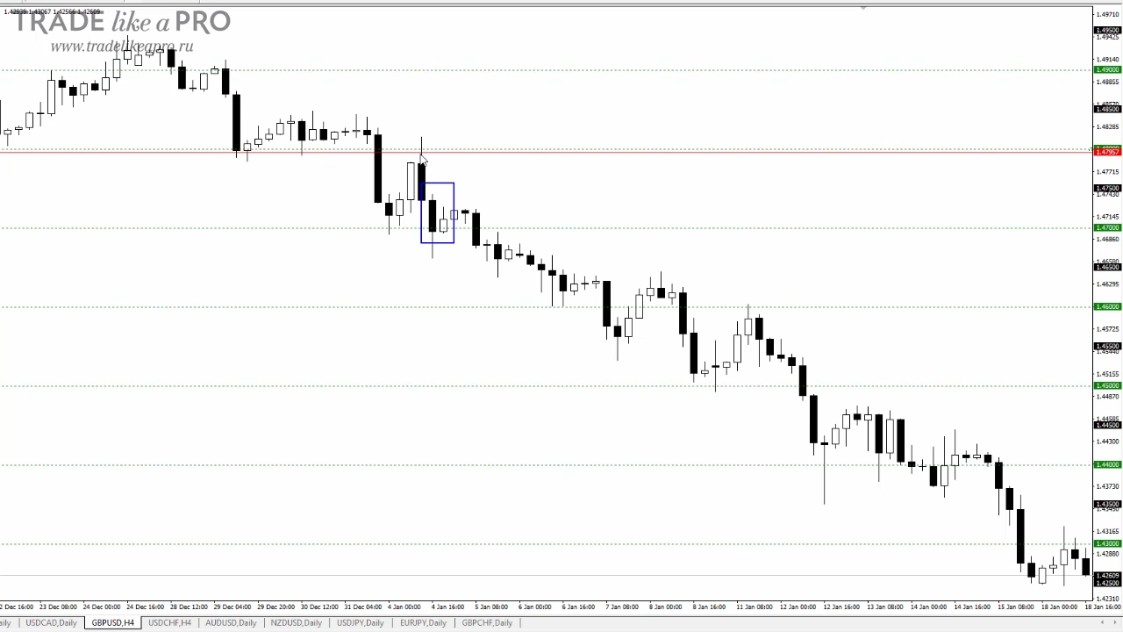
On it we observe that rails emerge from the level. You can view material about this setup on our website. After it, a bearish candle appears, and then the inside bar pattern forms. Although the level is far from the setup that appeared, it nevertheless rests on the previous setup. And this combination gives us the opportunity to enter a trade. We would place the stop loss slightly above the inside bar.
As we can see on the chart, the trend was clearly bearish, and therefore it would have been possible to make a good profit. The setup itself was not very strong. But nevertheless, using a trailing stop, it would have been possible to collect a great many points.
The next example shows a situation when the mother candle has a very long tail:
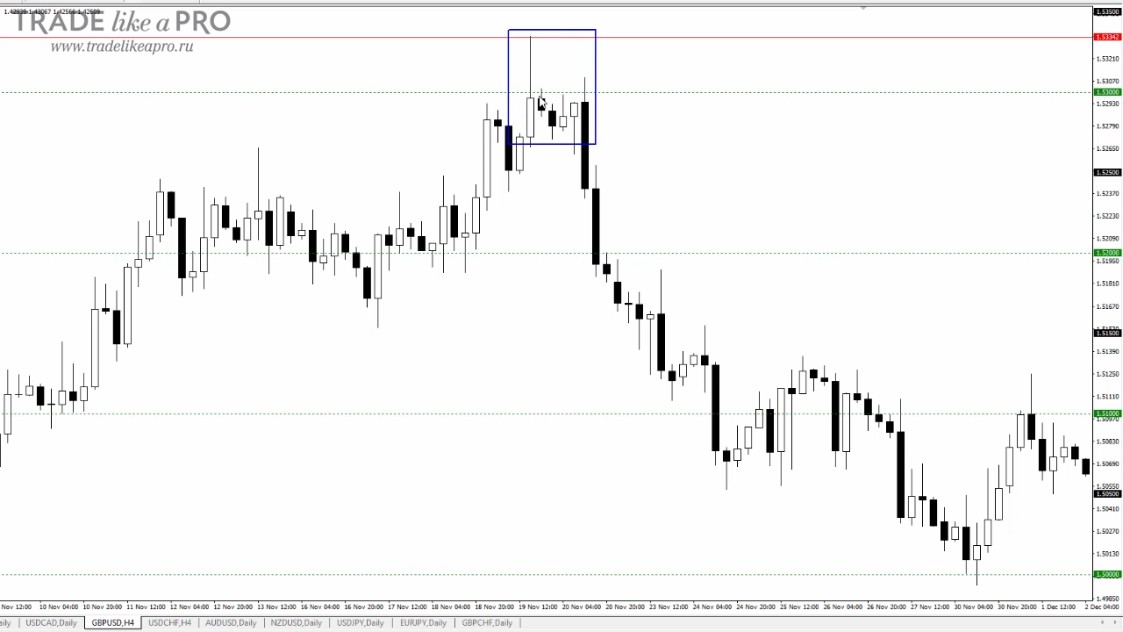
Here there were prerequisites for a trend reversal. When opening positions against the trend, it is worth counting on small targets, and if you are not greedy, then the take profit in this case would have been reached.
One more setup with support from a level:
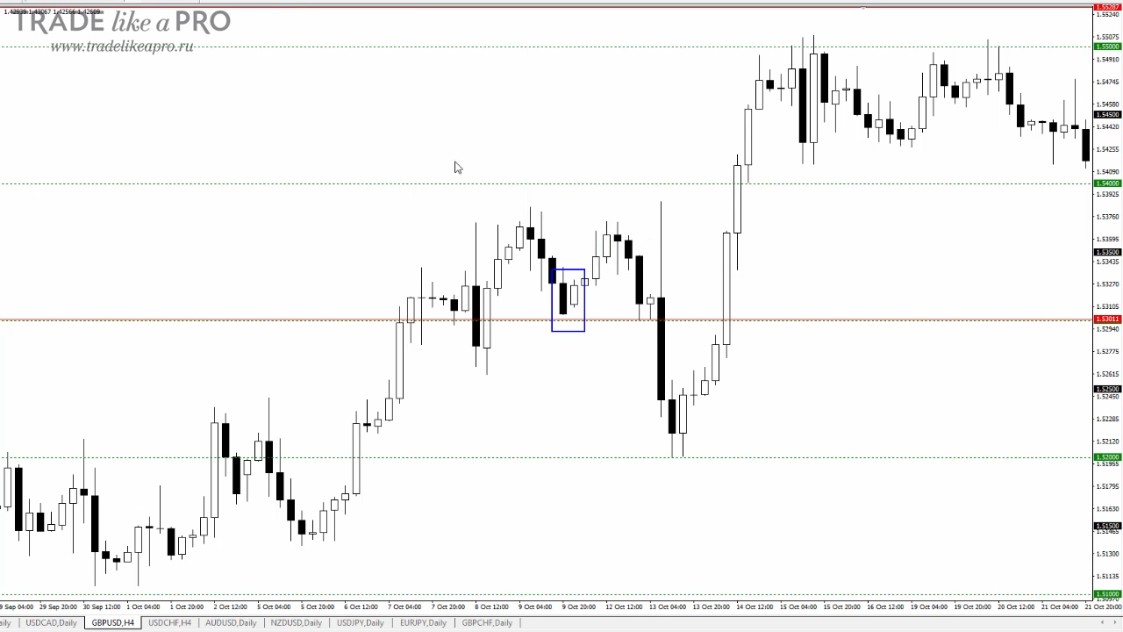
As I have already repeated to you more than once in this article: "Do not be greedy." Set small targets and stop losses. In this case you also could have taken a small profit.
One more countertrend example:
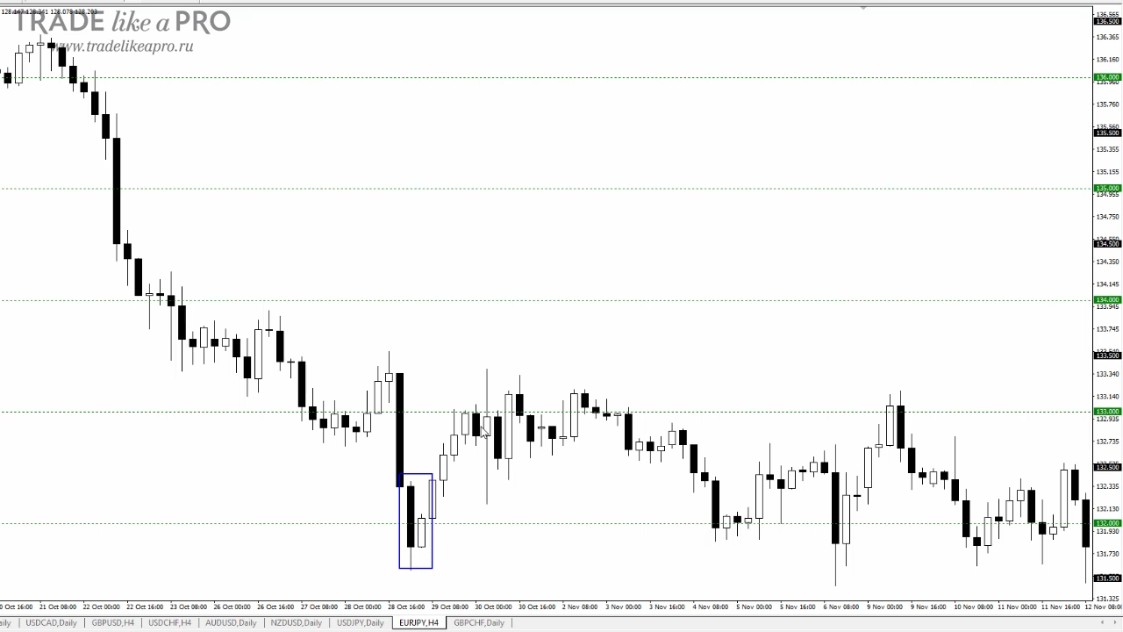
As you can observe, after the setup formed, the price went quite a considerable distance upward. It would have been possible to take a target 2 or 3 times larger than the set stop loss.
I think many people have a logical question: How should one correctly enter the market on an inside bar? With the trend or against the trend?
The answer to this is very simple. You should look at the inside bar itself. At its direction, and also whether there are obstacles to price movement in the form of support and resistance levels.
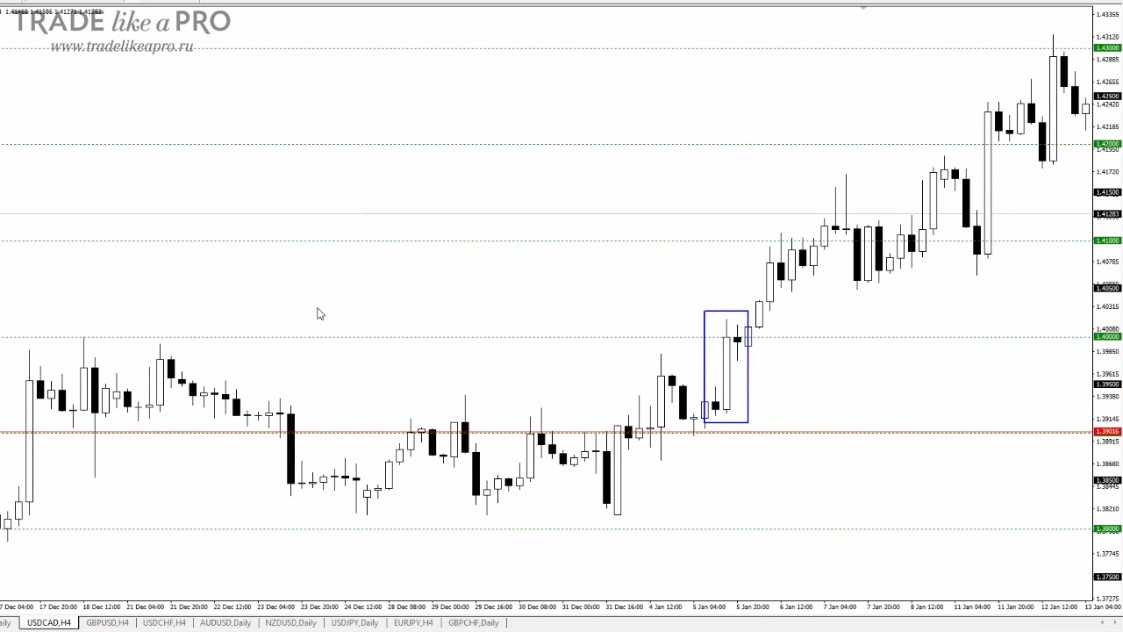
It is interesting that the inside bar appears more often on low timeframes. These include hourly and minute charts. This is explained by the fact that days of price agreement are less likely than hours of agreement between buyers and sellers. All because many different events occur in one day.
One more example where the price is in a channel, and there is no clear trend:
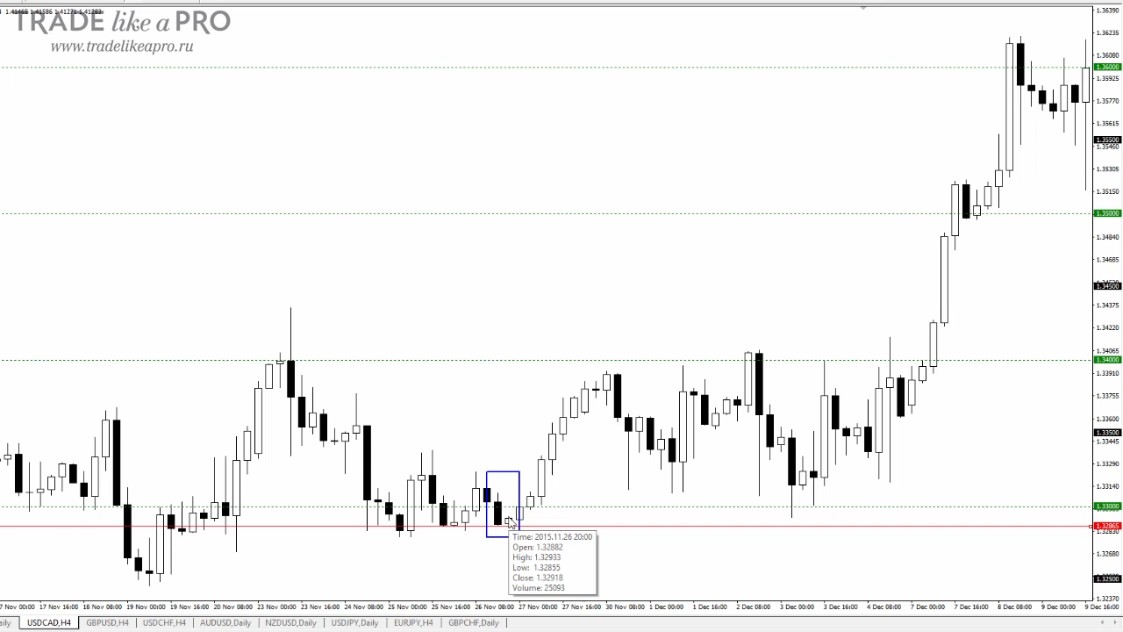
But if we had paid attention to the inside bar and placed a buy order, we would have made a decent profit.
Conclusion

The inside bar is not the easiest pattern to interpret. Good inside bars do not appear on the chart very often, so do not look for them where they do not exist. If you are not sure, then it is better not to enter the market. Always look at the direction of the inside bar, as it very often suggests the further direction of the price.
It is best to enter with the trend, although there are also cases when the inside bar appears against the trend. Pay attention to the size of the mother candle and the inside bar. If the mother candle is very large, then you should not enter, because a pullback is possible. Try not to trade signals in a flat market. There should be at least some movement before the setup appears.
If you trade intraday, open positions only during the London and American sessions. If the inside bar itself is a pattern like a doji or a pin bar, then it is not worth getting into such a setup, as nothing good will come of it.
Respectfully, Pavel Vlasov TradeLikeaPro.ru