
Price Action Infopanel: Your Control Over the Market
 Hello, ladies and gentlemen, Forex traders!
As everyone knows very well, automation is the engine of progress, but it also helps speed up analysis, which in Forex trading can take quite a lot of time. Automation also helps get rid of guesswork in the decision-making process. When you clearly follow a program's signals, you stop looking for setups on the chart where they do not actually exist. Today we will talk about such an interesting tool as the Price Action infopanel. What the authors of this tool did was select 3 strong patterns and automate their detection. All that remains for us is to check the support/resistance levels, determine the trend, and decide whether it is worth entering a trade.
Indicator Characteristics
Platform: MetaTrader4
Currency pairs: any
Timeframe: preferably H1 and above (D1 is best)
Trading time: around the clock
Indicator type: informational
Recommended brokers: Alpari, RoboForex
Installation and Setup

The indicator is installed in a completely standard way. A detailed guide on installing indicators in MT4 is available on our website. To launch it, simply drag the indicator from the Navigator window onto any chart. For convenience, you can dedicate a separate chart to the infopanel and perform analysis on others. Or you can switch directly to the necessary charts from the infopanel.
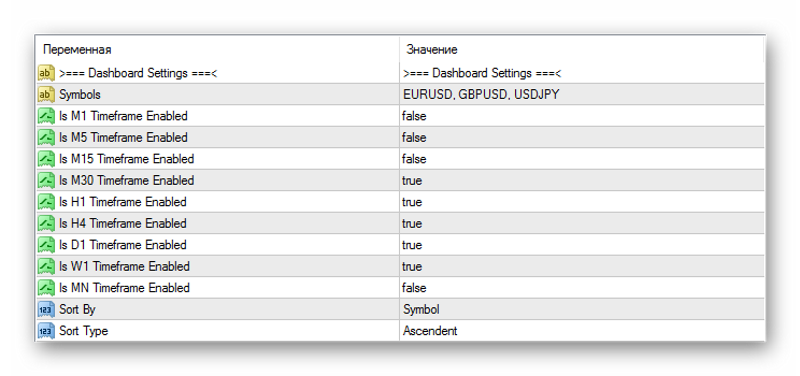
The first thing we need to specify is the symbols. By default, setups are searched on three pairs:
- Symbols - EURUSD, GBPUSD, USDJPY
You can add any other symbols as well, and they do not have to be currencies (commodities, stocks). After that come the buttons for enabling/disabling timeframes. By default, M1, M5, M15, and MN are disabled. As we remember, searching for Price Action setups on low timeframes (up to H1) is rather difficult and ineffective. A little lower, you can choose the method and type of table sorting by default.
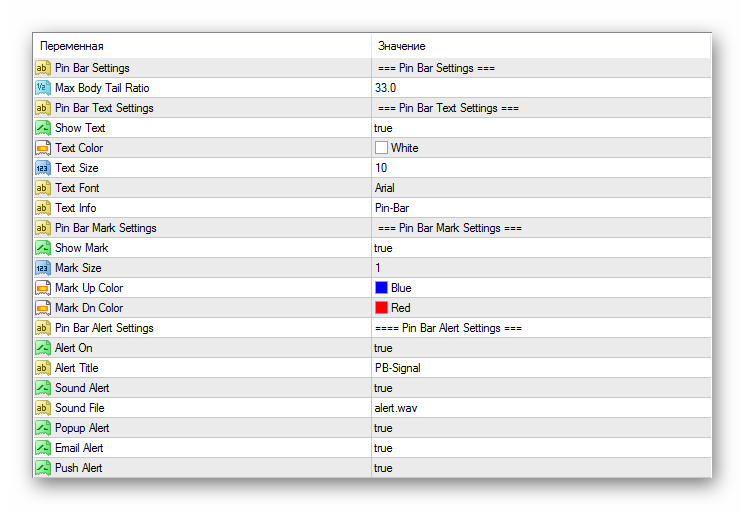
 Next come the settings for the Pin Bar, one of the setups identified by the panel.
- Max Body Tail Ratio - maximum ratio of body to tail.
Most of the settings relate exclusively to the panel's appearance and alert methods.
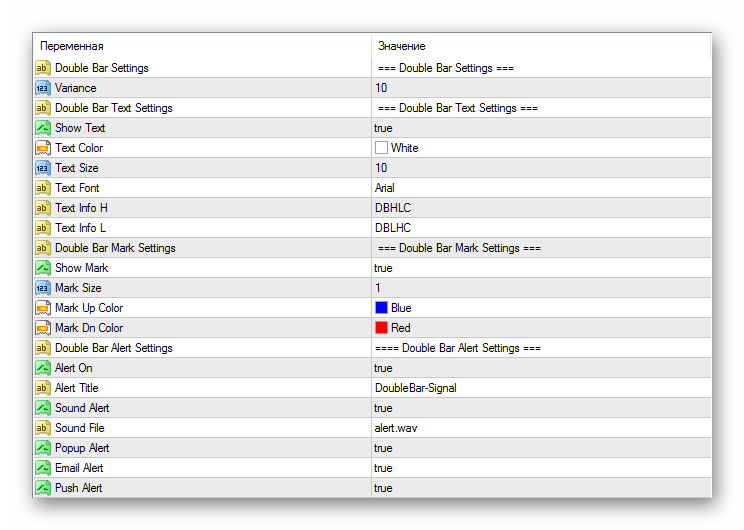
 Next come the settings for the “Double Bar” pattern, which on our website is listed as Double High / Double Low. Basically, all the settings concern the interface.
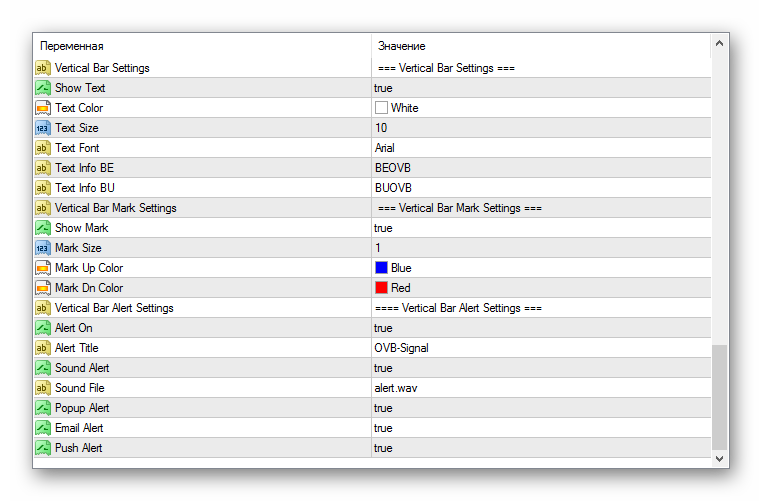
 Finally, there are settings for the vertical bar, or the engulfing pattern.
 Click “OK,” after which a table of setups is displayed on the chart. From left to right, the columns shown are:
- Symbol;
- Timeframe;
- Direction (bullish/bearish);
- Pattern name;
- Age (how many bars ago the setup was formed);
- Price at the completion of setup formation;
- Chart.
The values in the table can be sorted by clicking the column name.
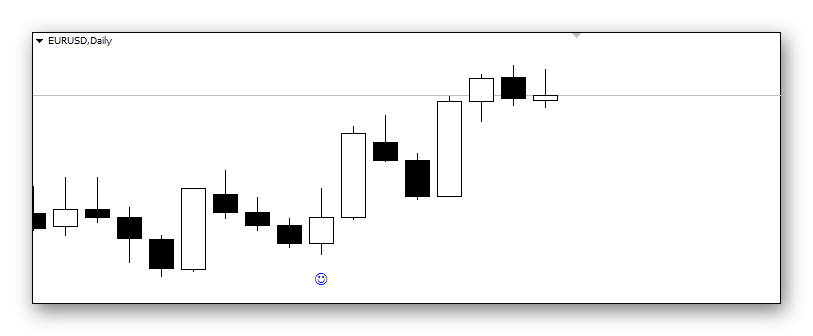
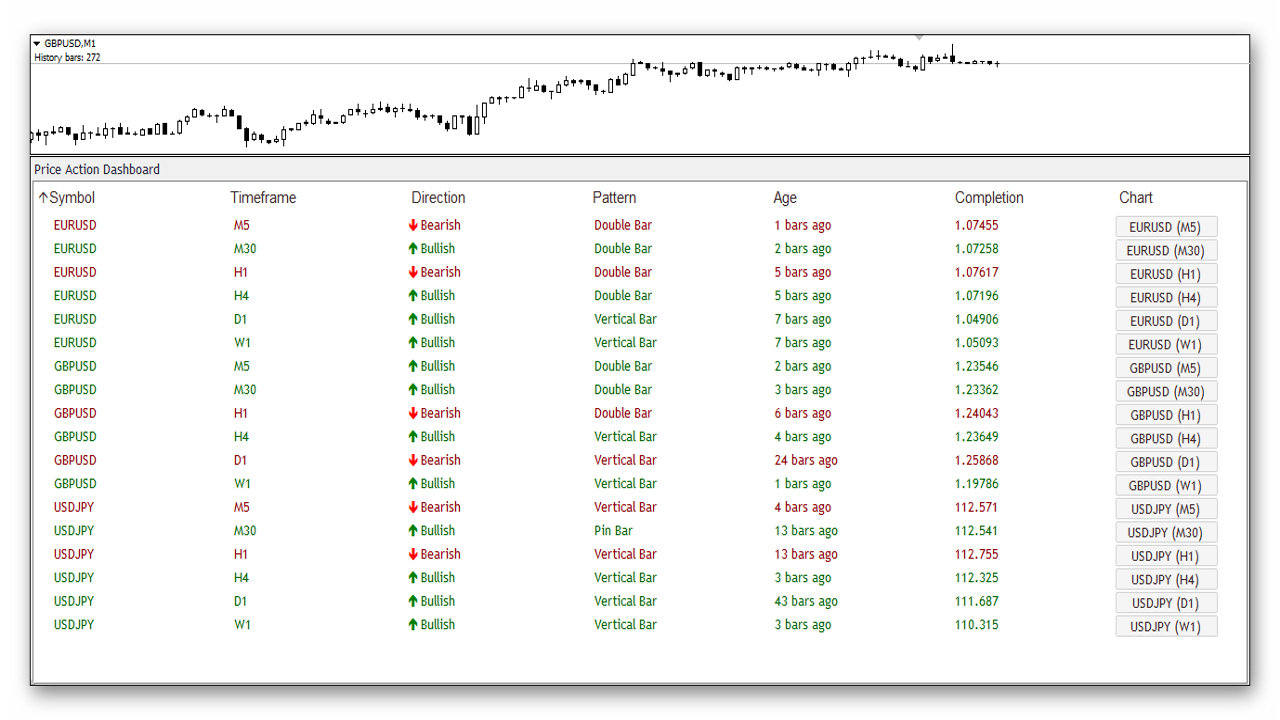 By clicking the chart name, you will go directly to the setup. When clicked, the current chart's symbol and timeframe will change, and the setup itself will be marked with a smiley face.
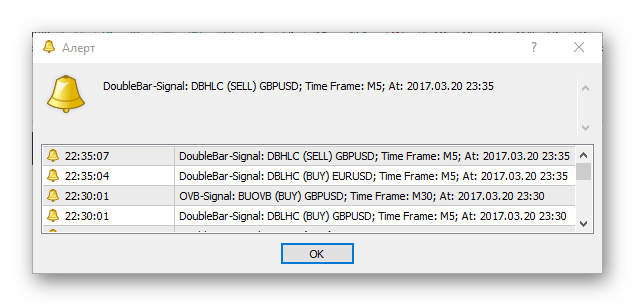
 As soon as a new pattern appears on one of the charts, you receive an alert in the terminal.
 So, in total the indicator recognizes three patterns: the Pin Bar, the Engulfing Pattern, as well as Double High / Double Low, a setup presented in the indicator as Double Bar. This pattern is formed when neighboring candles have nearly identical highs or lows. Our website contains information on how to trade each of these models.
Practical Application

First, we wait for a signal to enter the market. After receiving an entry signal, we check for the presence of levels. Next, consider whether the price has support, that is, how close the price is to the support level. If, however, there is a resistance level in the way that is too close to the opening price, it may be worth waiting for the level to break and entering later.
Otherwise, you can set a small target for the trade, or closely monitor the breakout of the level. Also, in this example, the established bearish trend should be taken into account, which does not correspond to the direction of the entry signal.
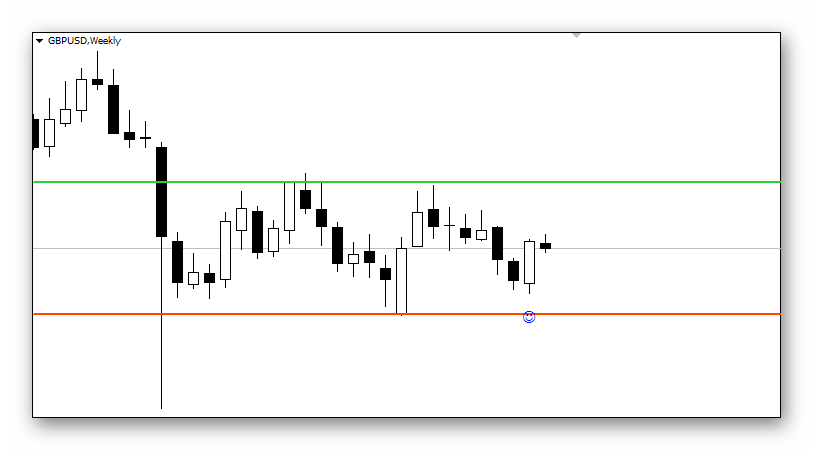 As a result, we get a signal, check for the presence of levels and the presence of a supporting trend. It is also worth looking at the higher timeframe to find out what is happening there. The setup rules for placing stop orders are described in the relevant articles on our website.
Conclusion

In the end, we have a decent process automation tool with a convenient interface. For beginners, the indicator will be suitable because it limits the use of various patterns. In fact, there is a practice of using only one pattern at all, for example, the Pin Bar. This is necessary so as not to scatter your attention by trying to see setups where there are none, and not to try to trade more complex patterns, such as the inside bar, where this should not be done. So this tool will definitely be useful for beginners and not only for them.
Download the Price Action info panel

Respectfully, Pavel Vlasov Tlap.io
