
Price Action: Engulfing Pattern
 Hello, friends!
We continue studying the methods and patterns of forex trading with Price Action. This time we will talk about the Engulfing Pattern (another name is the Outside Bar), which is very similar to the Inside Bar, but in the Engulfing Pattern the signal candle and the preceding candle are, as it were, swapped. Watch the video and you will understand everything yourself.
In this article, we will examine the Price Action engulfing pattern, one of the main candlestick patterns that traders value for its reliability and high signal follow-through rate. Confirmed by other factors (key levels, indicator signals, fundamental prerequisites), the engulfing pattern can become an effective tool for making a profit.
What Does This Pattern Mean?

The engulfing pattern (outside bar) is predominantly a reversal pattern (although in rare cases it may also indicate a continuation of the trend). It looks like two candles, the first of which is small, and the second is large, with a body larger than the entire previous candle, and directed in the opposite direction.
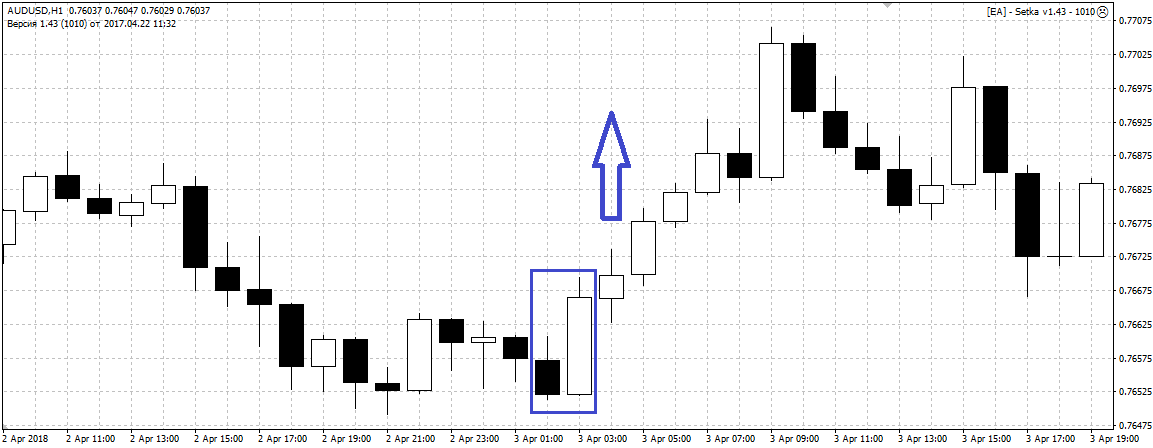 From the point of view of crowd movement, such a pattern means that the strength of the current trend is running out (this is indicated by the small size of the first, engulfed, candle). The crowd does not know which direction to move in and, figuratively speaking, marks time. The appearance of a powerful candle that engulfs the previous one and closes in the opposite direction signals the beginning of a new, strong trend.
In the example above, it can be seen that the bears, having found no support, stopped the downward movement, after which the bulls, organizing an upward price impulse, collected the stop losses of traders who opened short positions when the price was still moving downward by inertia at the beginning of the formation of the reversal candle. After the reversal and the stop-out of these traders from the market, the bulls finally strengthen and a powerful upward trend forms.
There are several mandatory conditions that a pattern must meet so that its signal provides the maximum probability of follow-through:
- Before the pattern itself, there must be either a downward or an upward trend in the market. The movement may be small, but its presence is mandatory;
- The body of the second candle must be of a different color and direction (bearish after bullish and bullish after bearish). The shadows may or may not be engulfed, but then the signal is considered weaker;
- The body of the second candle must have a contrasting color relative to the body of the first. The exception is cases when the body of the first candle is very small (a doji or close to it).
Important Nuances of Trading the Engulfing Pattern
In addition to the basic rules for identifying the outside bar pattern, there are other important nuances that, if taken into account, make traders more likely to improve the effectiveness of their trading.
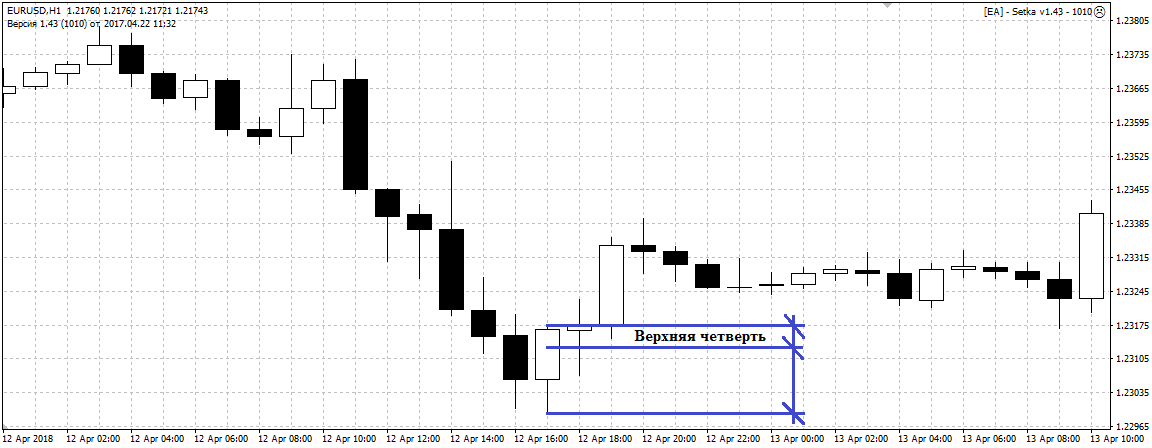
The closing level of the signal candle is located in the outer quarter (25%) of the entire range.
For a bullish candle, this means that the closing level should be located as high as possible and closer to the maximum, and for a bearish candle, closer to the minimum. From the point of view of market psychology, this means that the crowd not only reversed the price, but also continues to adhere to this direction. If the price has rolled back and the candle has closed with a large shadow in the direction of movement, this may mean that a reverse correction has begun, and it is better to skip such a signal.
 It is worth refraining from trading in a flat market
In sideways movement, engulfing patterns are quite frequent, and if you trade each of them, you can get many losing trades. A reversal pattern presupposes the presence of a trend. If you open a position on an outside bar signal only after a clear movement, the number of false market entries will decrease significantly, and accordingly, the overall percentage profitability of trading will increase.
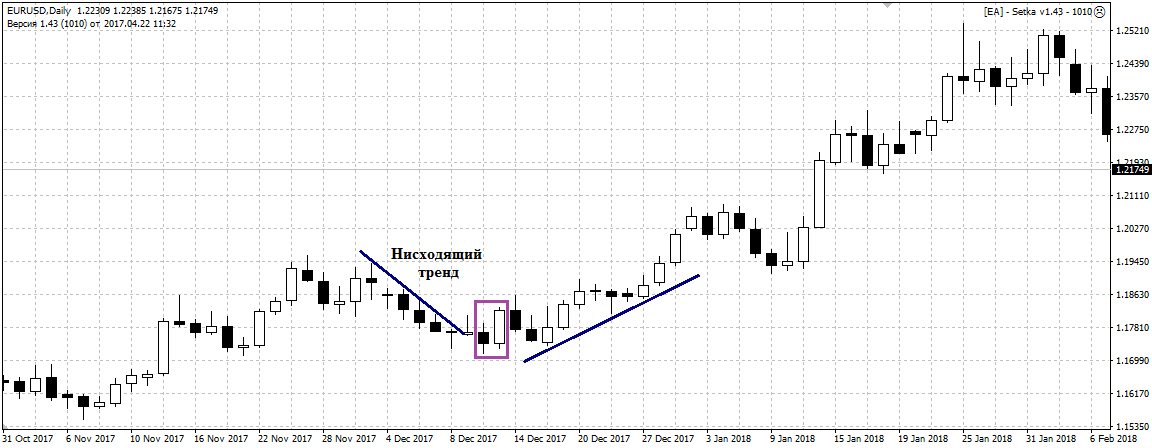 You need to take the context into account (the overall market situation)
Before opening a trade, it is necessary to evaluate what happened to the asset price earlier. The example with a flat market and the consequences of trading in a sideways market for a trader is described above. If, before the formation of the reversal pattern, there was a strong trend that gradually weakened and then reversed sharply, such a signal will be strongest, since it is confirmed by a quite understandable context.
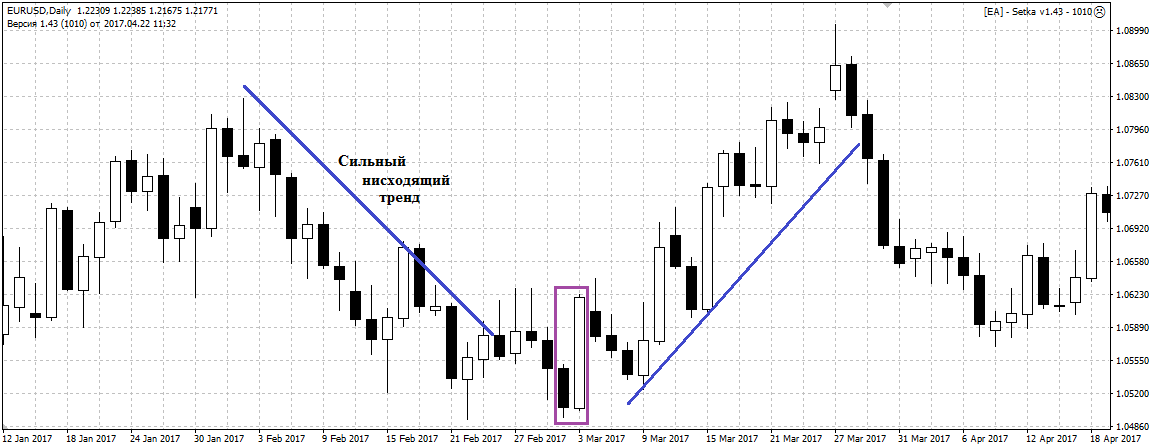 A full-bodied candle gives a more reliable signal
The size of the body of the outside bar should be larger than that of the previous ten candles. This size is determined visually and serves as reinforcement of the signal's strength. If the signal bar is small, this may mean that it formed accidentally and carries no weight in the overall market context.
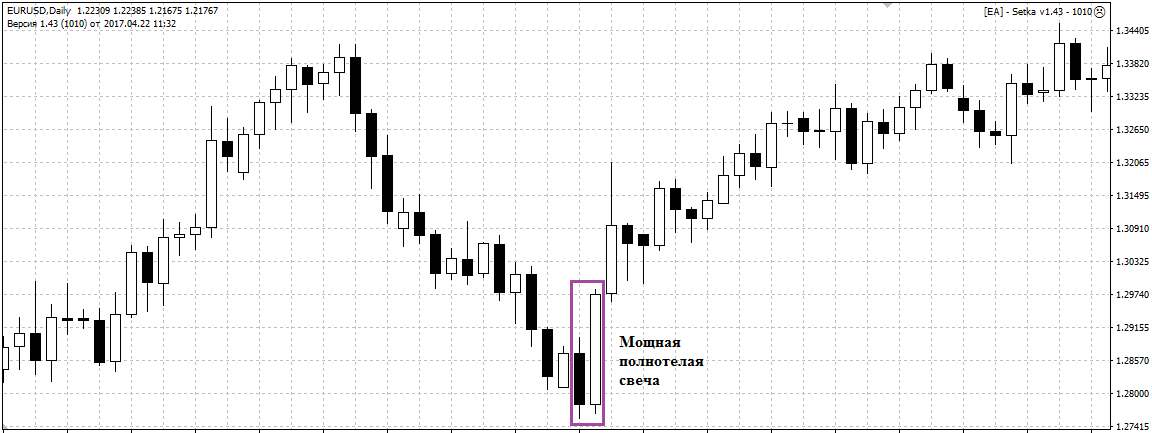 On the other hand, a candle that is too large, and moreover has no shadow in the direction of movement, may entail a quick correction. In this case, it is also better to refrain from trading such a signal, or to place a tighter stop loss.
Trading the Price Action Engulfing Pattern

If all conditions are met and the signal is strong enough, you can enter the market. Let us consider exactly how trading by the outside bar is conducted.
Market Entry
Entering a trade based on the engulfing pattern is best done with a pending stop order. It is placed a few points above the high of the bullish signal candle, or a few points below the low of the bearish one. A breakout of the signal candle will confirm the market reversal and the correctness of the opened position.
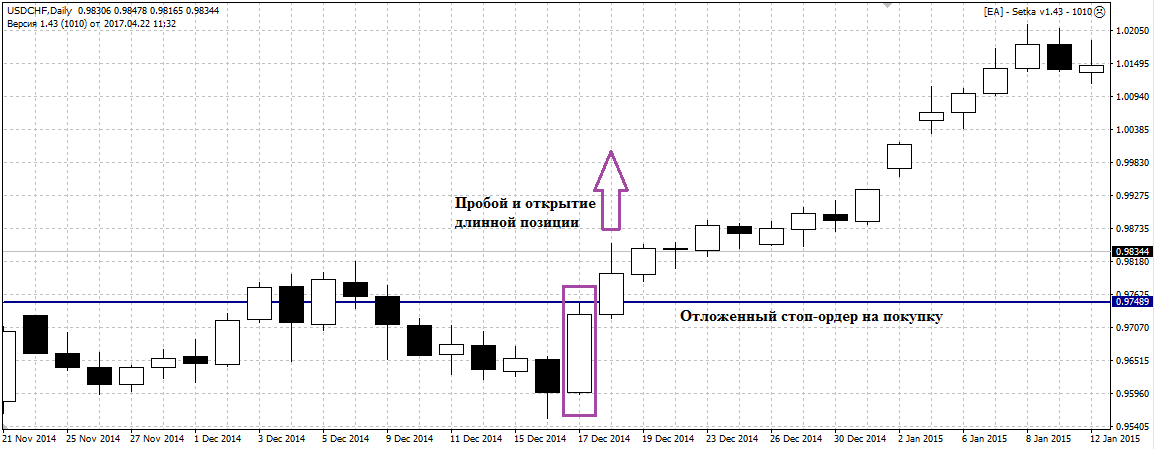 Placing a stop loss
There are two ways to place stop losses when trading the engulfing pattern:
- At the extreme of the signal candle (a few points above the high of the bearish candle or below the low of the bullish one);
- By the ATR indicator (the indicator value is multiplied by 2 and the stop loss is placed the resulting number of points away from the pending order);
Placing the stop by ATR is considered optimal, although it often coincides with the extreme of the signal candle.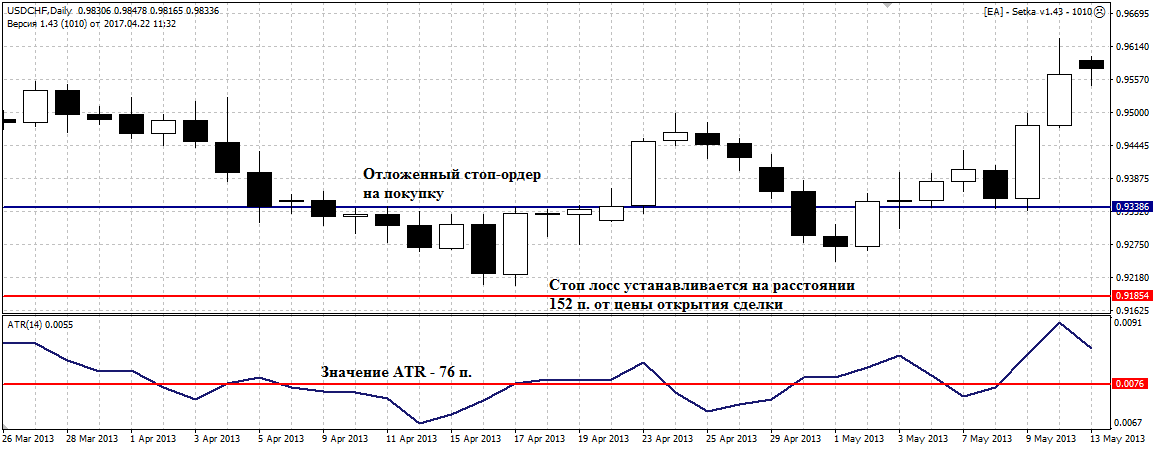 Take Profit Placement
There are also several options for placing take profit:
- By a ratio of 3:1 and higher to the stop loss;
- By key levels.
The 3:1 ratio provides a positive mathematical expectancy, but this method has no connection to the real market situation and is therefore less effective. Placing the take by levels is optimal, since in this case the probability of the price reaching the specified mark and locking in profit increases. When placing TP at a key level, a take-to-stop ratio of less than 3:1 is acceptable, but not less than 1:1.
Pattern Trading Statistics

In order to test the profitability of trading the engulfing pattern in practice, tests were conducted on a demo account under various conditions and using several tests.
Initially, entry into the market was made on any outside bar pattern, regardless of the presence of a trend and key levels. Under such conditions, only trading on daily charts showed stable profitability: on H4 the profit turned out to be insignificant, and on H1 a loss was ultimately recorded.
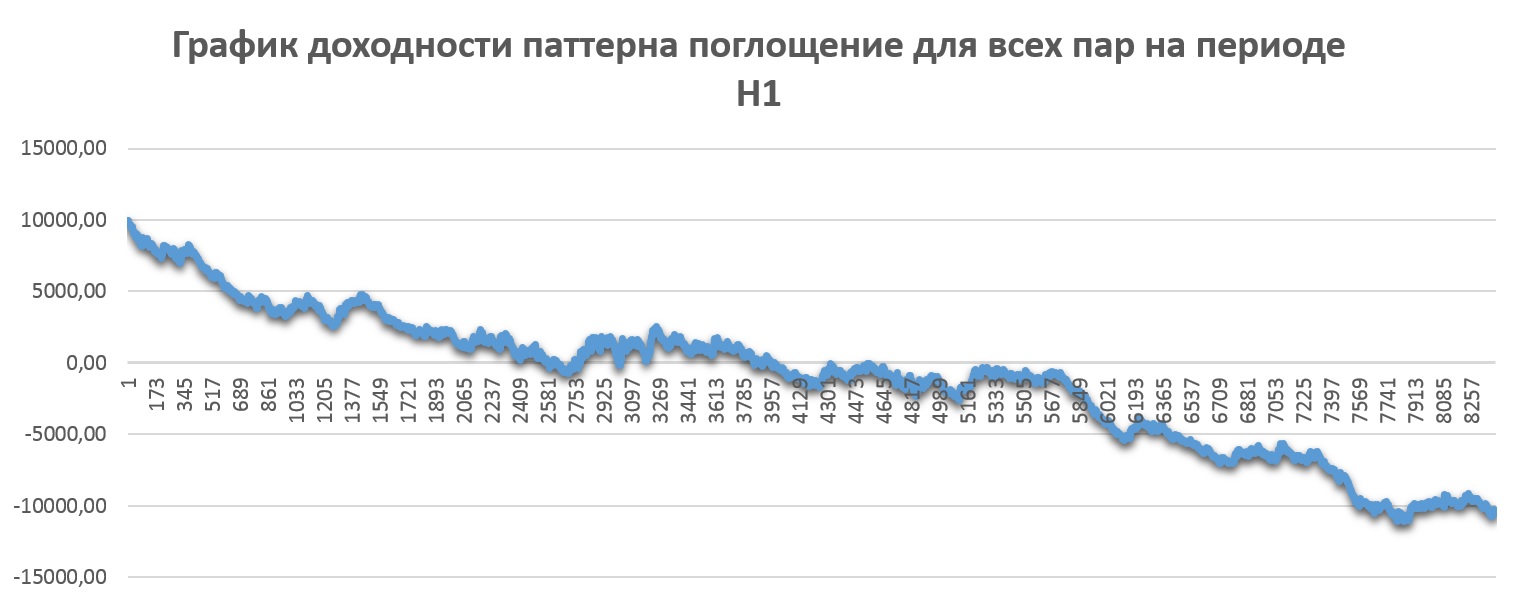
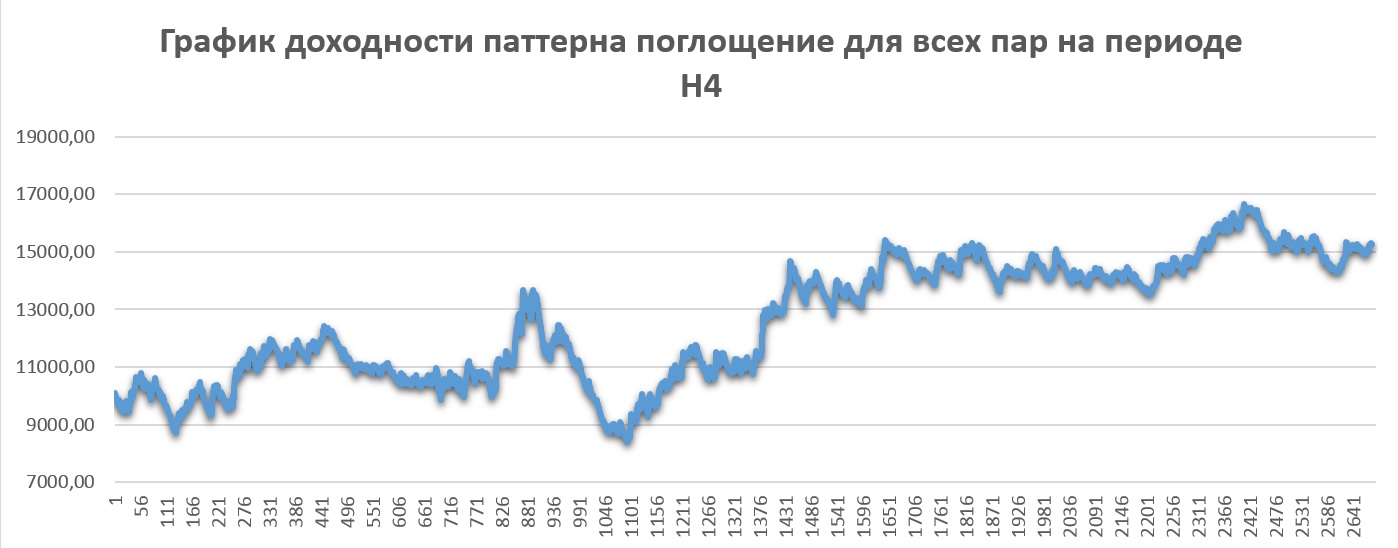
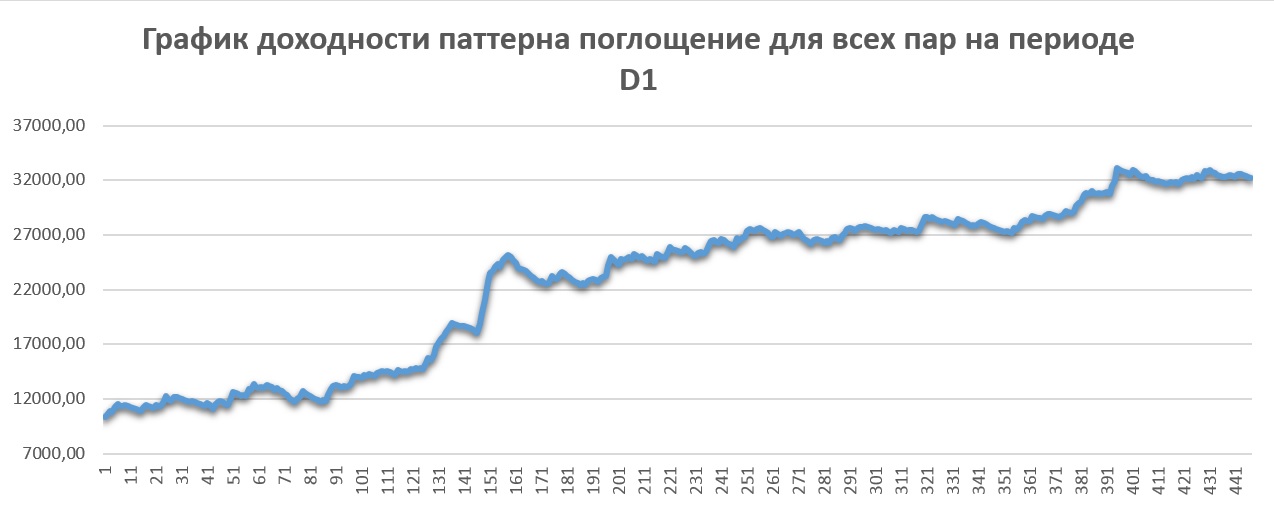 However, when the condition of entering only in the presence of a trend and exiting the market by levels was observed, the situation changed for the better.
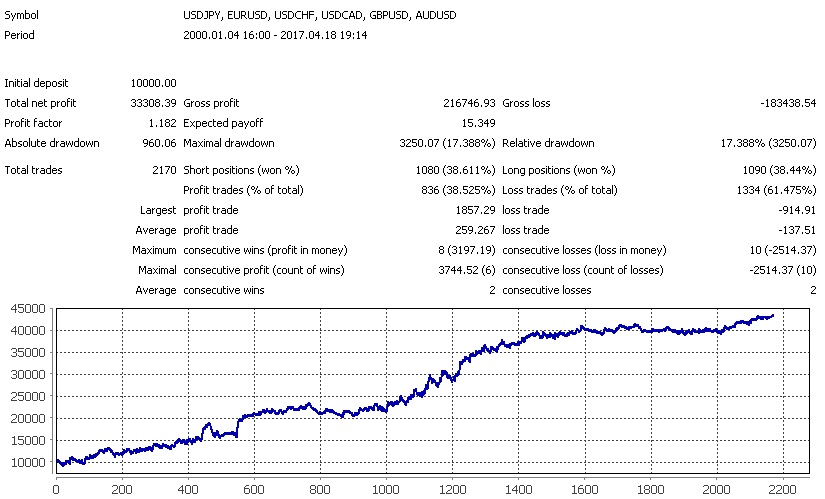 On both H1 and H4, the trading dynamics are positive. The largest income on H1 was recorded when setting the stop loss using ATR.
But exiting the position on the opposite signal turned out to be the least profitable, although the trading remained profitable.
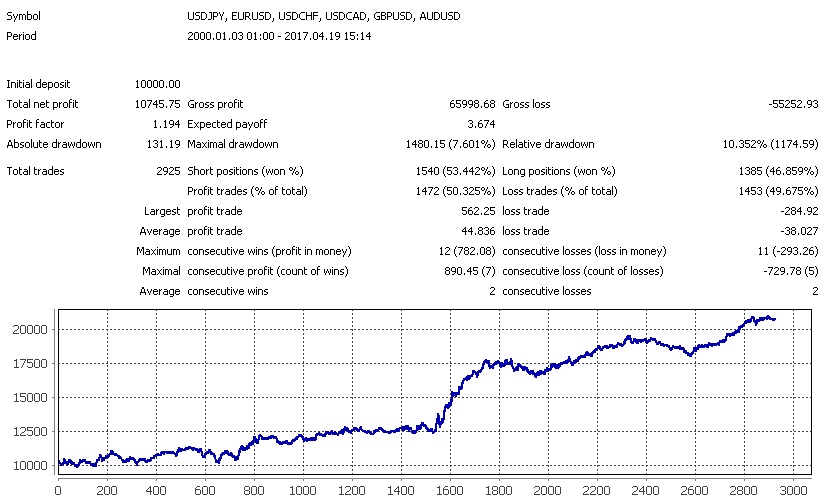 On H4, trading with a stop loss placed beyond the extreme of the signal candle and one set by ATR gave approximately the same result.
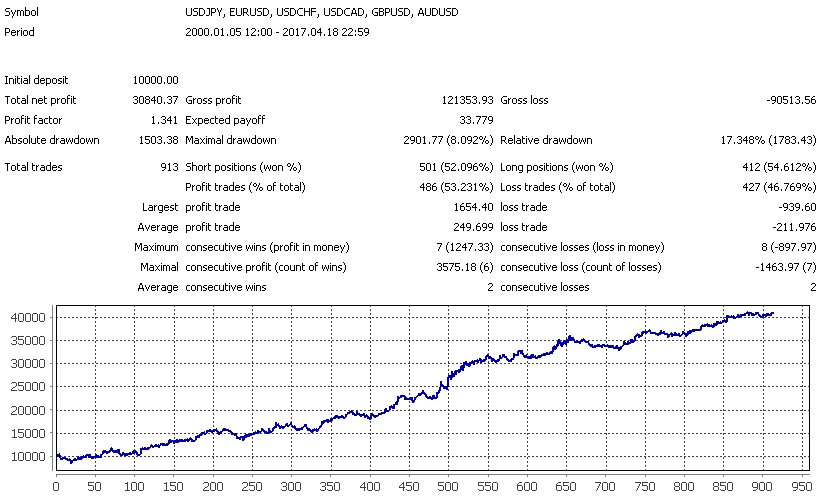
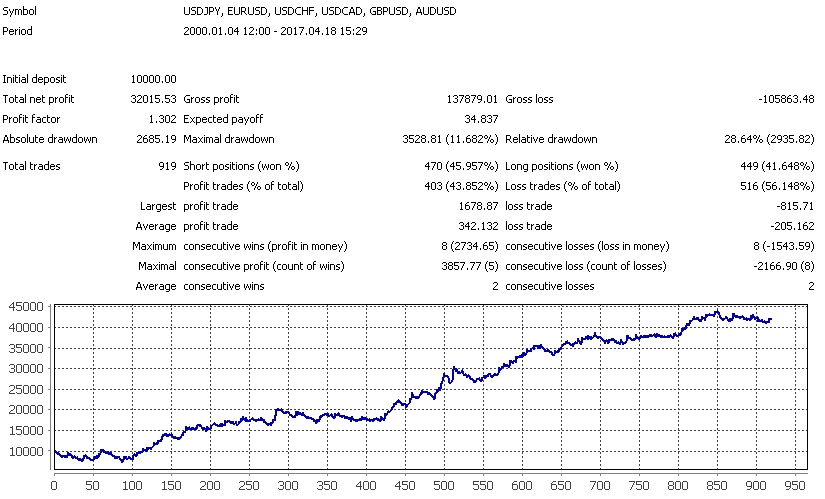 However, placing a trailing stop and exiting on the opposite signal turned out to be a less profitable solution.
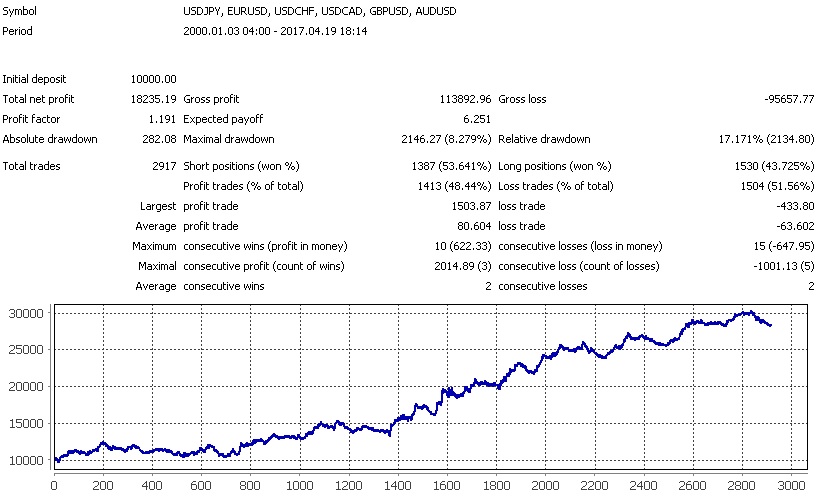 So here as well, exiting by a pre-set take profit or an ATR stop is the most optimal.
Examples of Trading the Engulfing Pattern

For an example, let us consider a trade on the hourly chart of USDCHF.
After a prolonged bearish trend, a reversal pattern formed: a bullish candle engulfed the last bearish one, with the close occurring in the upper quarter, and the signal bar itself turned out to be larger than the previous ten. Based on this signal, a buy stop order was placed above the high of the engulfing candle. The stop loss was set by the ATR indicator (parameter 0.0010) at 20 points from the order, and the take profit was set near a key level at 30 points from the order (a 1.5:1 ratio in favor of the take is quite acceptable).
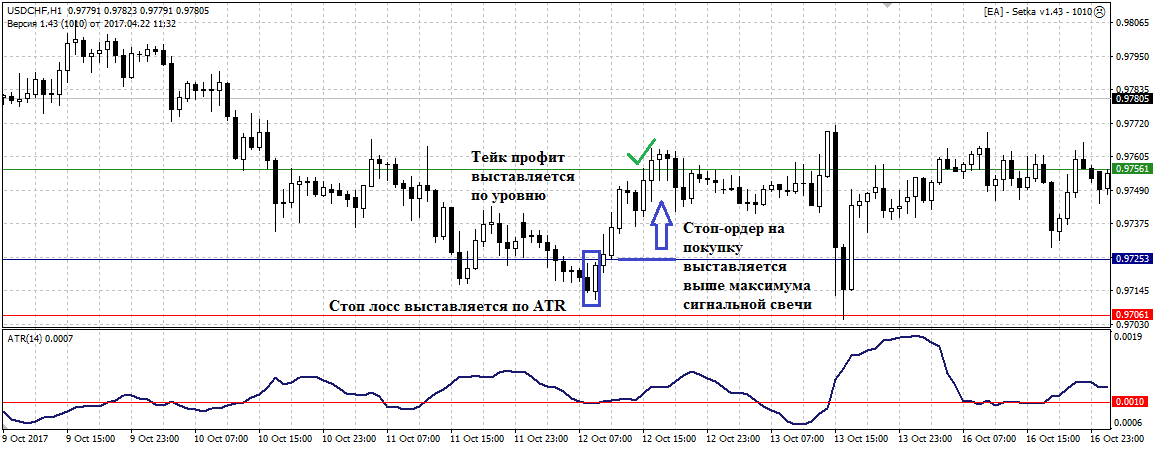 The pending order was activated by the very next candle, and the price went up. A few hours later, the trade was closed by take profit.
The next trade was opened for a sell on EURUSD, also on H1.
All conditions were met: a slight upward trend, a strong full-bodied bearish candle that closed in the lower quarter. A pending sell order was placed at its low. The stop loss was set by ATR 20 points upward, and the take profit at the nearest level. The resulting ratio was 1:1, which, although not ideal, is acceptable.
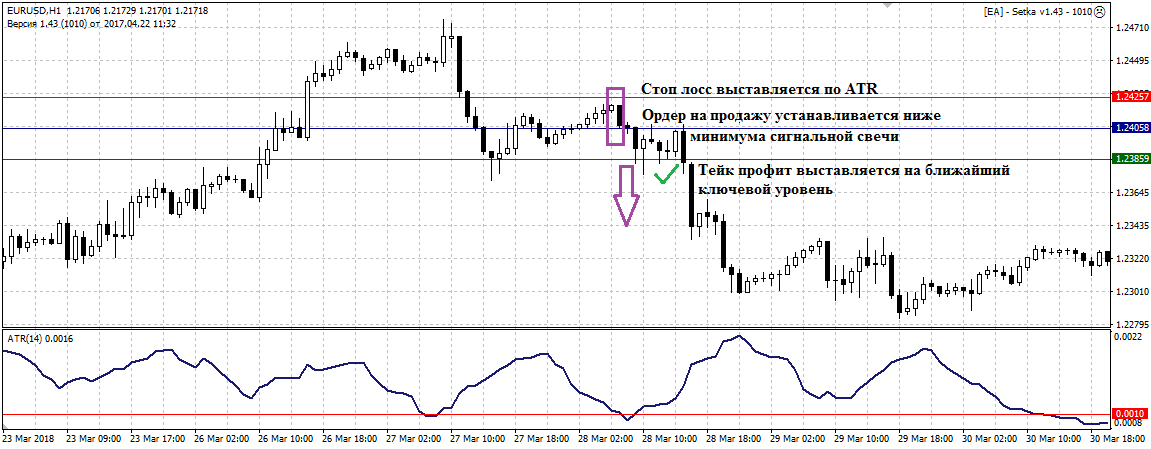 On the very next candle, the order was activated, and another hour later it closed by TP. In this case, five times more profit could have been taken from the trend, but the nearest level was located too low.
Outside Bar Indicator for MT4
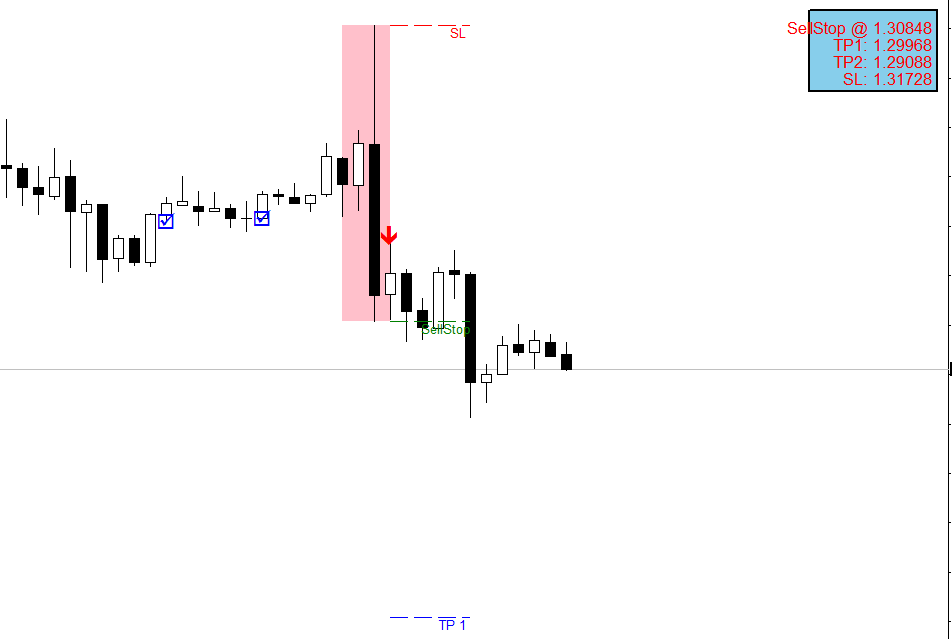
At first, beginners may find a helper indicator for the MetaTrader 4 terminal useful, which identifies the setup on the chart for you (without taking levels and other nuances into account), and also gives take-profit and stop-loss placement levels.
The indicator is installed according to the standard instructions.
Description of the indicator settings
- Size Ratio - if you specify an ATR coefficient here, the signal filter is activated, in which the indicator shows only those outside bars whose signal candle is greater than or equal to the resulting value in points. For example, if we specify 1, all signal candles smaller than the current ATR value will not be shown;
- ATR Period for Size Ratio Comparizon - ATR period when using the filter from the Size Ratio parameter;
- Wicks Ratio - coefficient for filtering out candles with tails that are too large (shadows). How many times the total length of the candle should be greater than the shadows;
- Buy Signal Arrow Color - arrow color for the buy signal;
- Sell Signal Arrow Color - arrow color for the sell signal;
- Arrow size - arrow size;
- Maximum history bars to search back - how many candles back in history to analyze;
- Entry break plus points - how many points to add to the entry point;
- StopLoss Calculation method - stop-loss calculation method: in points (specified in the StopLoss plus points setting), by ATR, or through the High/Low of the signal candle;
- StopLoss plus points - how many points to add to the stop-loss;
- StopLoss ATR Multiplier - multiplier for the stop-loss when calculated by ATR;
- StopLoss ATR Period - ATR period for stop-loss calculation;
- TakeProfit Calculation method - take-profit calculation method: in points (specified in the TakeProfit 1/2 plus points settings), by ATR, or by multiplying the stop-loss by the coefficient specified in the TP1 Reward and TP2 Reward settings;
- TakeProfit 1 plus points - how many points to add to the first take-profit;
- TakeProfit 2 plus points - how many points to add to the second take-profit;
- TakeProfit ATR Period - ATR period for take-profit calculation
- TakeProfit 1 ATR Multiplier - multiplier for the first take-profit when calculated by ATR;
- TakeProfit 2 ATR Multiplier - multiplier for the second take-profit when calculated by ATR;
- TP1 Reward - ratio of the first take-profit to the stop-loss size;
- TP2 Reward - ratio of the second take-profit to the stop-loss size;
- Settings for the colors of the indicator elements in assortment);
- Alert settings ( Alerts ).
Download the Engulfing Pattern indicator

Conclusions

When trading Price Action, you need to consider several factors at once. Candlestick patterns provide guidance for action, but at the same time you cannot lose sight of the main trend and price levels. The pattern itself must always have a point of support. Such a comprehensive assessment will help avoid obviously false entries, and the habit of a calculated approach is only for the better.
Respectfully, Pavel Vlasov Tlap.io