
Popular and Controversial Vdubus Divergence Wave Pattern: Theory and Practice
Vdubus Divergence Wave Theory was developed by a trader under the pseudonym vdubus, who first presented it on the ForexFactory forum in early 2019.
The author combines traditional wave analysis of charts with the principles of "geometry and physics": in his concept, price levels (geometry) show where a reversal may occur, while instantaneous momentum indicators (physics) show when the energy of the trend has run out.
The theory attracts the attention of a fairly wide audience: at the time of writing, vdubus has more than 16.1 thousand followers on TradingView.
In this article, we will examine the evolution of the author's views that led to the creation of Vdubus Divergence Wave Theory, note its strengths and weaknesses, and also analyze the popular Vdubus Divergence Wave Pattern Generator indicator, which was highlighted by TradingView editors at the end of 2025.
Who vdubus Is and How He Came Up with Divergence Wave Theory
Who Is Hidden Behind the Pseudonym vdubus
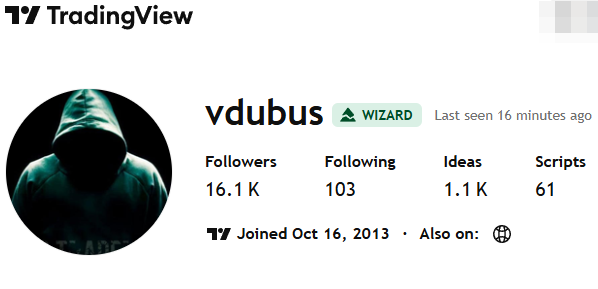
Behind the pseudonym vdubus is Howard Wolsey from the United Kingdom, who presents himself as a trader and analyst. On the professional network LinkedIn, this very person identifies himself as the developer of Vdubus Divergence Wave Theory.
The vdubus profile appeared on TradingView in October 2013. By the end of 2025, more than 16.1 thousand users were subscribed to it. Over 12 years, vdubus published 61 scripts on the platform and left a total of about 1.1 thousand comments.
Vdubus registered on the ForexFactory portal in 2014. His activity there is much lower: he published about 260 posts, and 103 users follow him.
On the MQL5 portal, the vdubus profile was registered on September 17, 2014. He is not active here, except for requests to port Pine scripts from TradingView to MQL5.
The Evolution of vdubus's Views and Trading Style
At an early stage (before ~2015), vdubus talked a lot about fast strategies and tools for binary options, emphasizing simple signals (MA, HMA, fast oscillators) and frequent entries. Scripts from that time: BinaryPro, Trend Master, etc.
From 2015 to 2018, vdubus significantly expanded his toolkit. He began using more complex indicators (Rejection Spike, HMA Bands, Atlas, and others).
In an attempt to move from short binary entries to more sustainable positions, he shifted the focus to trend trading. Ideas about filtering out "noise" and holding the move appear, which leads to reflections on a more "structural" analysis of market behavior (divergence + wave logic).
During those years, some Russian-speaking traders analyzed his approach and compared it with the Sniper trading system.
At the same time, vdubus begins publishing visualized Pine scripts and makes attempts to make the system scalable and applicable to Forex/crypto. This reflects the transition from short-term techniques to a more systematic approach with an understanding of momentum and market structure.
The modern stage in the development of vdubus's ideas began in 2019. At that time, he finally formalized his Divergence Wave Pattern, after which he presented it on the ForexFactory forum.
At the same time, vdubus stopped publishing scripts until 2025, at the end of which he released three indicators at once:
- HMA 34 Dual-Fractal Projections - Vdubus
- Vdubus MacD Divergence Trend Break Signal Generator
- Vdubus Divergence Wave Pattern Generator, which became a TradingView Editors' Pick.
Thus, vdubus evolved from the author of utilitarian "fast" indicators into the founder of his own methodology, where the central idea is the combination of price structure and momentum (MACD histogram and its trend lines). In practice, this looks like an attempt to reduce the number of false signals of fast systems through additional momentum filters.
What Divergence Wave Pattern Is in Simple Terms
Vdubus combines traditional, though simplified, wave chart analysis with the principles of "geometry and physics."
According to his concept, price levels (geometry) show the point at which a reversal may occur. In turn, instantaneous momentum values (physics) show the moment when the trend's energy has run out.
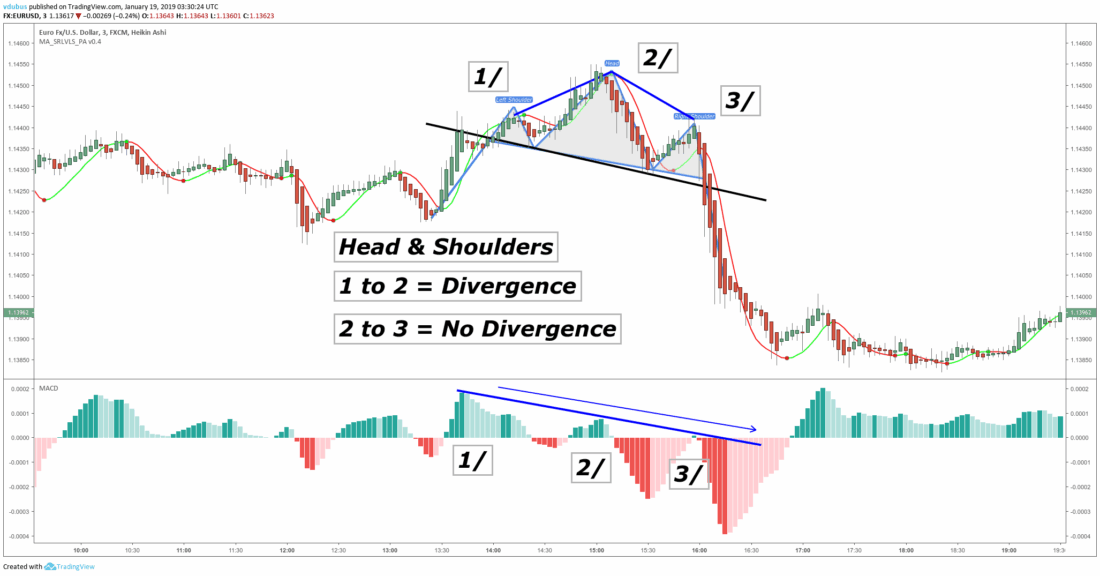
The fundamental rule of the theory is three waves of momentum instead of the usual divergence by two points.
If the first wave (wave 1→2) is accompanied by a discrepancy between price and the indicator (divergence), and the second wave (wave 2→3) does not confirm the momentum, this indicates a weakening trend and readiness for a reversal.
Wave 1→2 = divergence, wave 2→3 = no divergence = weakening trend (reversal).
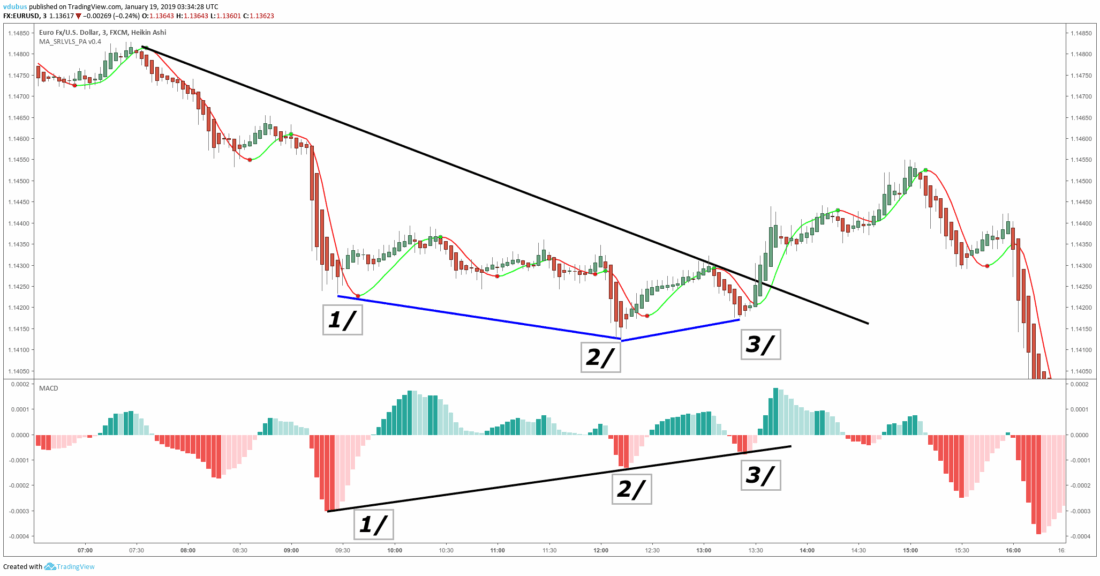
Reverse logic (for a trap): wave 1→2 without divergence (it seems that the trend is strengthening), while wave 2→3 suddenly shows divergence ("Strong → Weak"), which denotes a trap and a reversal.
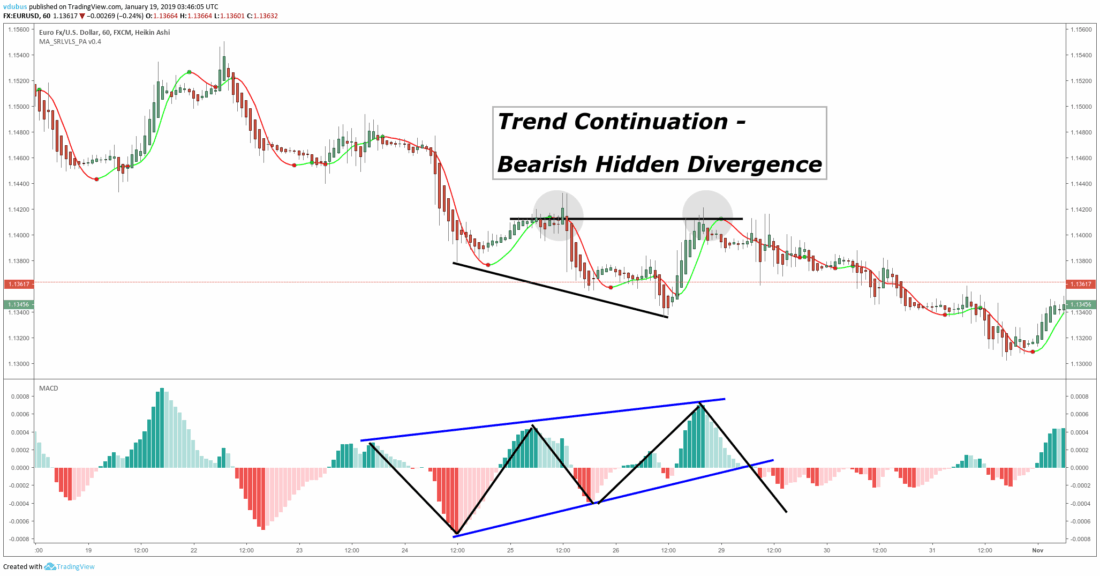
Hidden divergence (Predator): if in a trending move the price makes higher lows, while the MACD forms lower lows, this is a signal for the continuation of the main trend (the "weak bottom" vs "strong trend" trap).
Thus, the theory can be formalized through a 3-wave "momentum machine": the standard reversal (Exhaustion) is conservative, the trap reversal (Climax) is aggressive, and trend continuation occurs through hidden divergence.
The author emphasizes the "clean path" principle (Clean Path): a trade is considered valid if at the moment of entry the opposing force (the momentum of the countertrend) is weak or absent.
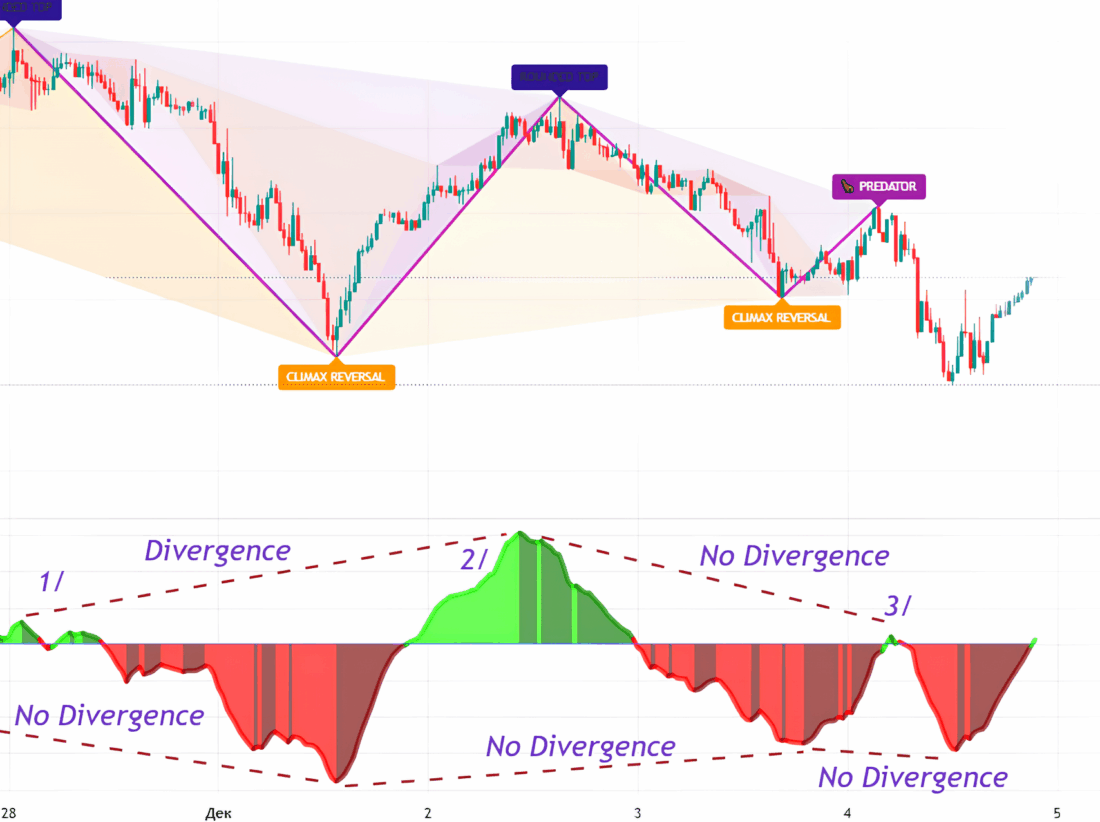
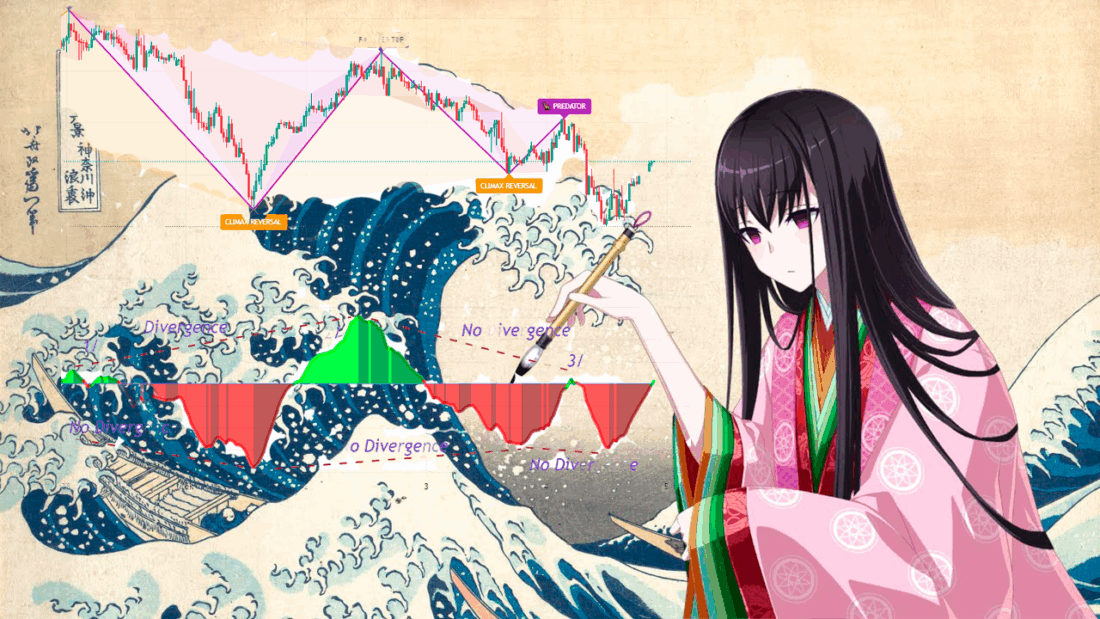
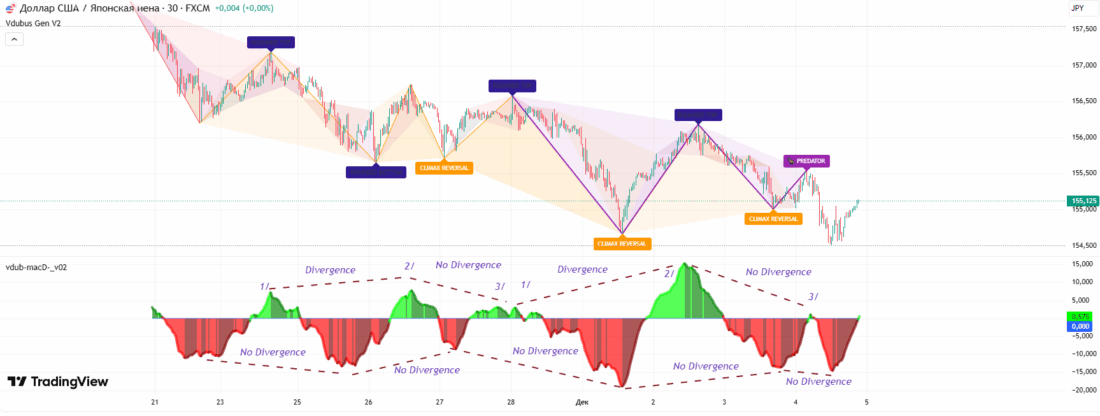
The illustration clearly combines the geometry of price waves and the dynamics of the MACD in the spirit of the Vdubus method.
Using the USD/JPY chart as an example, the key signals of the Vdubus theory are shown: waves 1-2-3 and the corresponding divergences on the MACD are highlighted.
The moment "1→2 = divergence, 2→3 = no divergence" (Standard Reversal) is shown at the beginning: the MACD histogram declines, then wave 2-3 ends without noticeable momentum.
The chart also marks the Climax Reversal pattern (a trap with a sudden "breakdown" of momentum on wave 3) and Predator (hidden divergence on a pullback, serving as a signal of trend continuation).
Indicators Based on Divergence Wave Theory
The theory is based on the author's trading strategy, so it is adapted first and foremost by vdubus himself. In 2025, he released a number of indicators and scripts for platforms that implement these rules.
Vdubus Divergence Wave Pattern Generator Indicator
On TradingView in December 2025, the Pine script "Vdubus Divergence Wave Pattern Generator V1" appeared, which automatically builds price structures (in the form of 5-point "Gartley Bat" patterns) and searches for three-wave divergences on the MACD.
This script immediately became TradingView Editors' Pick and gained the highest number of views that month.
The idea in one sentence: it is necessary to combine recognition of price geometry (ZigZag / 5-point X-A-B-C-D patterns) with a three-wave momentum check (3-Wave Momentum Filter) on the MACD, taking signals when the "geometry" is confirmed by the "physics" (momentum).
Main settings and elements:
- The "golden" settings of the MACD core (by default fast=8, slow=21, signal=5; lookback=3 - a sensitive configuration).
- The script recognizes 4 setup types: Standard Reversal (Exhaustion), Climax Reversal (Trap), Predator (hidden divergence / trend continuation), Rounded Top/Bottom, etc.
- Color coding: green/red - standard; orange/"climax" - trap; navy/maroon - rounded tops/bottoms.
Signal Types
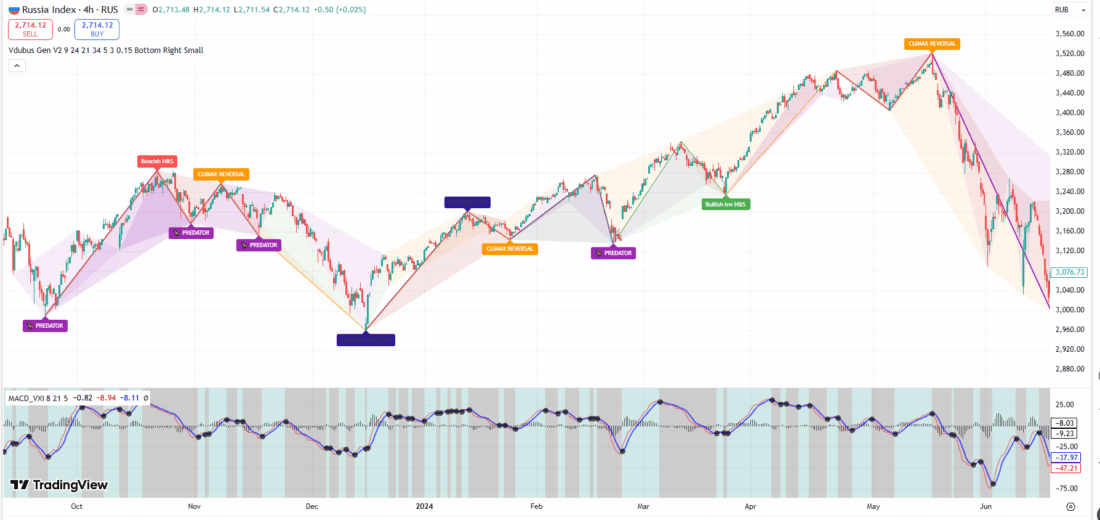
1) Standard Reversal (green / red)
- Geometry: ZigZag finds a 5-point structure of the Gartley/Bat/Butterfly type.
- Physics: MACD momentum confirms the divergence and then weakening -> a reversal signal. The indicator draws the corresponding colored pattern and labels.
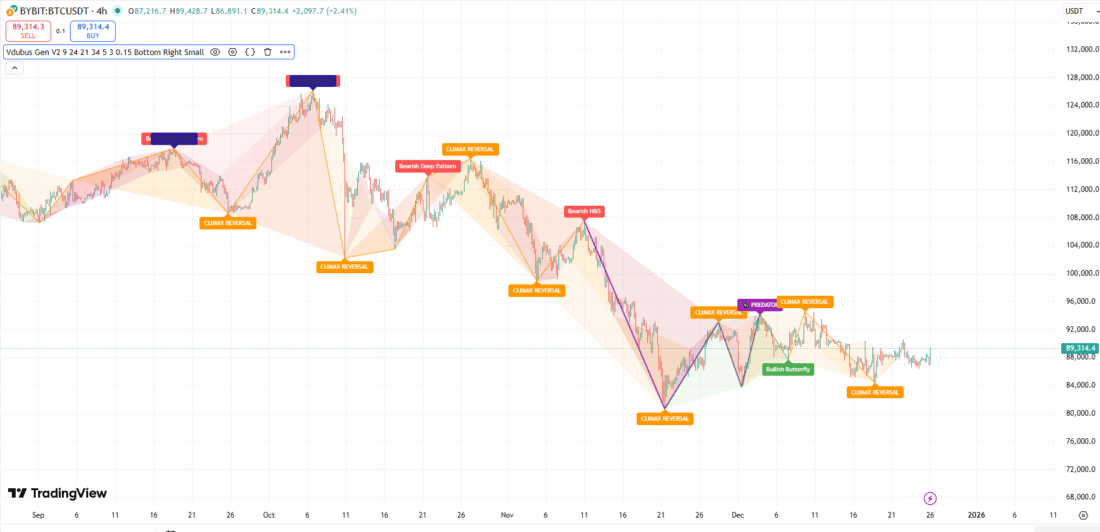
2) Climax Reversal (orange)
- Geometry: again a 5-point figure.
- Physics: the dynamics first show strength and then a sudden drop in momentum -> a trap/aggressive reversal.
3) Rounded Top/Bottom (dark blue)
- Geometry: price changes direction smoothly (without sharp peaks).
- Physics: a check for a 4-wave decline in momentum -> a rounded reversal signal. This signal captures reversals without sharp extremes.
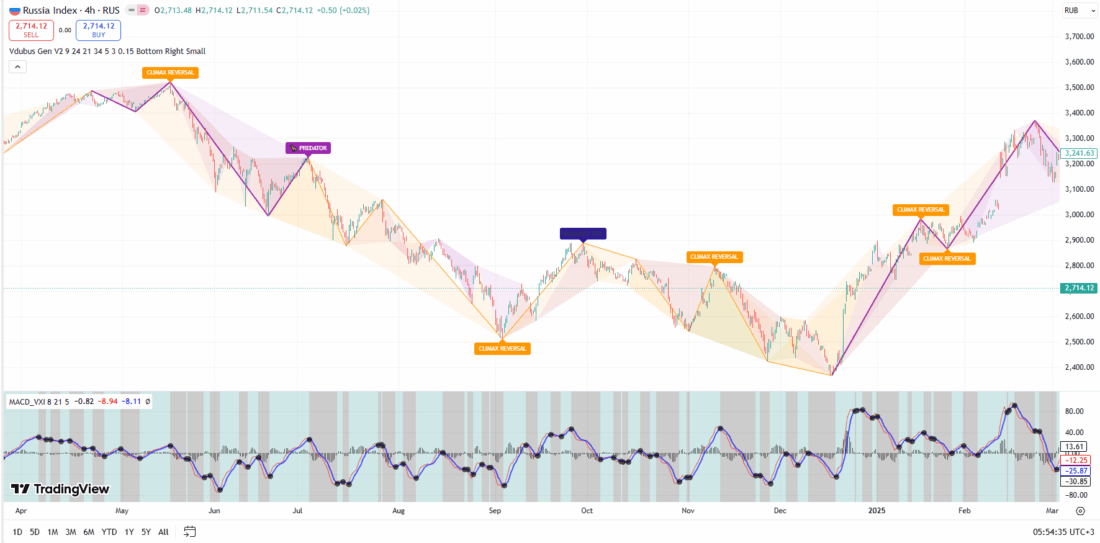
4) Predator (purple)
- Geometry: a pullback with the trend structure preserved (Higher Low/Lower High).
- Physics: hidden divergence (momentum makes a lower low). This mode points to trend resumption after a correction.
5) Confluence Dashboard - additional signals
In the corner of the screen, the indicator displays the state of forces (bulls/bears) based on the latest momentum extremes. This panel works as a "safe signal filter":
- 🟢 Bulls Strong - BUY is preferable, SELL is risky
- 🔴 Bears Strong - SELL is preferable, BUY is risky
- ⚪ Neutral - forces are balanced.
Author's trading recommendations:
It is necessary to wait for the 3-wave filter (Wave 1->2 = divergence; Wave 2->3 = no divergence -> reversal confirmation) or catch "Strong->Weak" climaxes; do not trade geometry in isolation from impulse.
Vdubus MacD Divergence Trend Break Signal Generator Indicator
At the end of 2025, the script "MacD Divergence Trend Break Signal Generator" was also introduced, where the crossing of trendlines on the MACD histogram serves as the entry point.
The author claims: "momentum breaks trendlines earlier than price, and divergence in the past foreshadows a future break of the trend in momentum."
The momentum "engine" is a specially modified MACD + dynamic trend projections (projection lines) on the MACD histogram. The system catches compression on the MACD and trades the breakout of this compression.
Main settings and elements:
- Custom MACD parameters: fast=12, slow=34 (slower than the standard), signal smoothing=5.
- The algorithm looks for pivot points in momentum (MACD histogram) and projects resistance/support lines on the histogram; a signal is generated when the MACD physically crosses these projections.
- Signal classification: Reversal vs Continuation (depending on the position relative to the zero line).
Dynamic Trend Projections on the MACD (Pivot Trendlines)
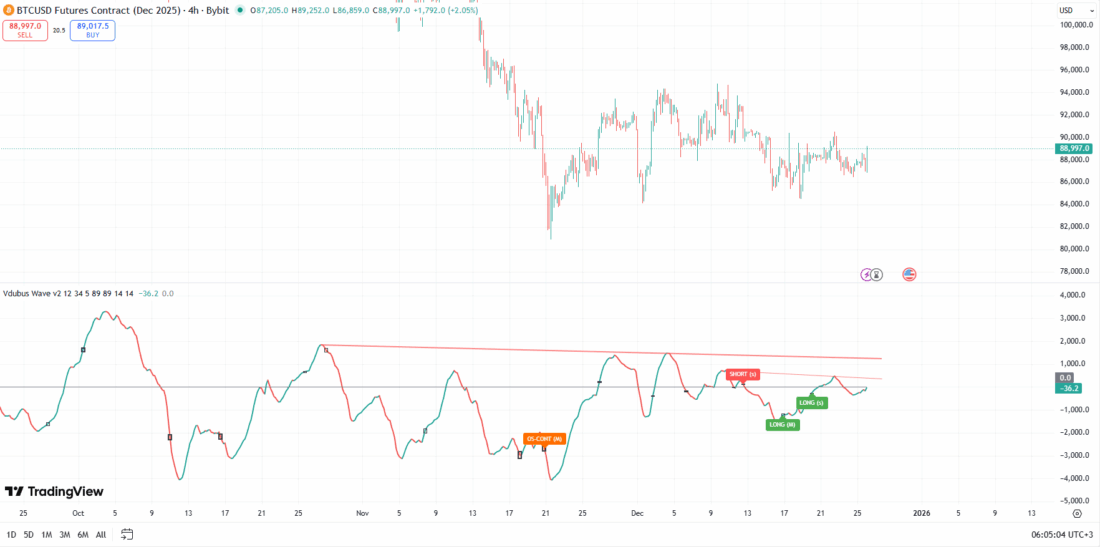
The indicator uses a pivot algorithm to automatically find extremes (peaks and troughs) on the MACD histogram and builds trend line projections forward. The signal is triggered when the MACD line crosses one of these trend lines.
Signal Classification
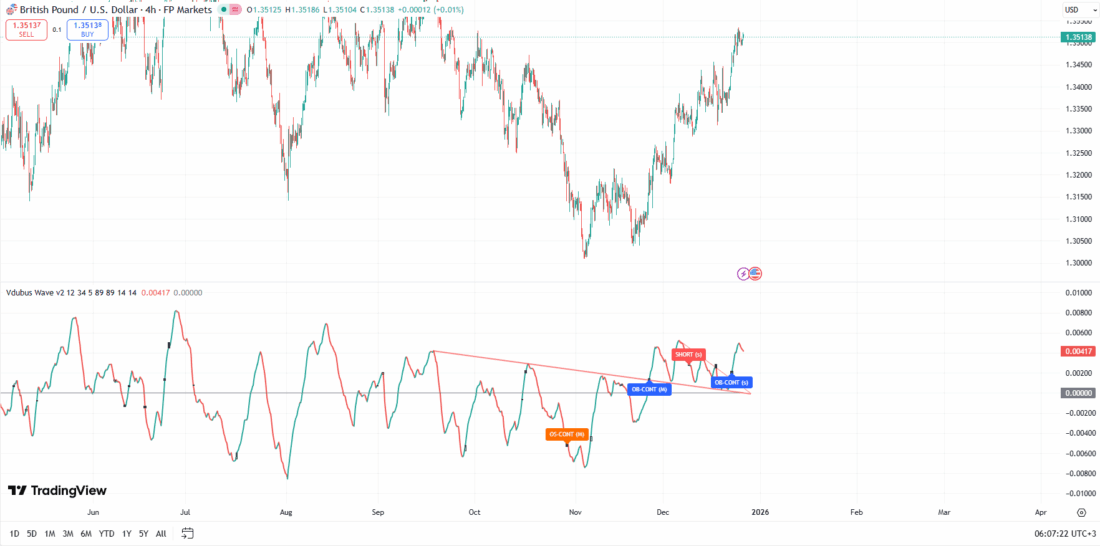
The system distinguishes reversals (Reversal) and trend continuation (Continuation) depending on the position of the crossing relative to the MACD zero line.
🟢 LONG (Standard Reversal):
- Condition: MACD breaks above the resistance line while below zero.
- Meaning: momentum stops supporting the decline and begins to reverse upward — a buy signal ("Buy the bottom").
🔵 OB-CONT (Overbought Continuation):
- Condition: MACD breaks resistance above zero.
- Meaning: the trend is bullish, momentum compressed briefly, and then continued upward — a trend continuation signal.
🔴 SHORT (Standard Reversal):
- Condition: MACD breaks the support line above zero.
- Meaning: the upward impulse is fading — a sell signal ("Sell the top").
🟠 OS-CONT (Oversold Continuation):
- Condition: MACD breaks support below zero.
- Meaning: the trend is bearish, and after a short pause the decline will continue — a signal of continued downtrend.
HMA 34 Dual-Fractal Projections Indicator
The indicator builds a dual-fractal (Macro / Micro) structure based on the Hull Moving Average (HMA). It does not draw lines across all bars, but applies a pivot algorithm to the HMA to filter out candle "tails" and draw cleaner support/resistance lines.
The author advises using the indicator to look for price compression and assess the development of the current structure. The indicator makes it possible to forecast a likely breakout, as well as early warnings of a reversal (if Micro begins to diverge from Macro).
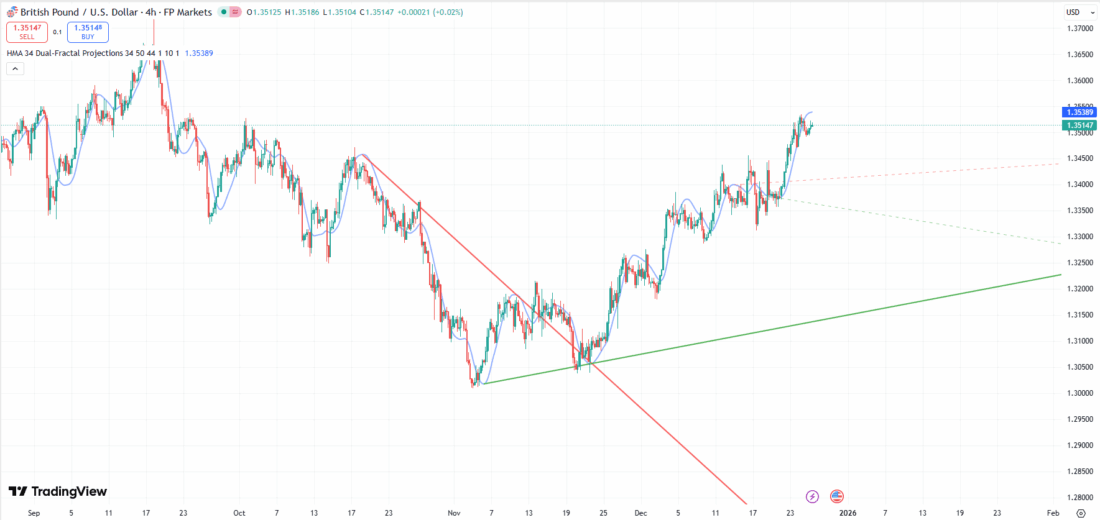
Main settings and elements:
- HMA line (default length = 34).
- Macro (solid, large lookback ~44) — the main channel / long-term structure.
- Micro (dashed, lookback ~10) — local boundaries forming a wedge / pennant / flag.
- Alerts: Micro/Macro cross — an alert when the microstructure "crosses" the macro (high probability of a breakout).
Critique and Assessment of the Vdubus Divergence Wave Theory
The Vdubus theory is an experimental proprietary approach that does not have a strict academic or fundamental basis.
Many TradingView users and forum members note the practical usefulness of the indicators.
Open vdubus scripts help quickly visualize potential reversals and momentum breakout points; several of its indicators have received many downloads/likes. Users note the convenience for finding setups and testing them on charts.

In turn, many professional traders are usually skeptical of divergence-based strategies. In favor of the model is the fact that waiting for the third wave (the "lazy impulse") does in fact filter out some of the market "noise." However, the delayed signal is an obvious drawback: while waiting for wave 3, the strategy may miss a significant part of the move or enter too late. On the other hand, this results in fewer false signals.
Critics also point out that overlaying wave patterns onto divergences is subjective: in some cases one can see the "correct" shape, while in others the market continues moving contrary to expectations.
Part of the criticism is related to the fact that the methods originated in the binary options environment (fast entries), so some traders fear that the strategy may be "tuned" to specific timeframes/noise and scales poorly to long-term trends.
The lack of large statistical backtests with detailed risk/return metrics is especially noted.
Conclusion
The vdubus approach has attracted the attention of traders: one can find forward tests and discussions of this system. It is noted that the idea is not tied to a specific market; its indicators can be applied both in forex and in cryptocurrencies.

The trading community perceives Vdubus Divergence Wave Theory as a practical, "applied" proprietary approach, useful for those who are ready to adapt the indicators and test them.
At the same time, a number of experienced traders note the need for testing and understanding that the method gives delayed (filtered) signals and was historically developed for a specific set of instruments/timeframes.
Vdubus Divergence Wave Theory is not a strategy, but a mechanism for reading impulse. It can be a good context filter and shows reversals fairly well. Like all other systems, it requires additional confirmations using other approaches.
Respectfully,
Ivan Rusin