Pivots – key points on the chart, let's see what's what

Hello, fellow Forex traders!
Key support and resistance levels are the technical analysis tools on which many traders base their decisions. And this is not surprising, because if, in the opinion of a trader, the support or resistance zone is strong enough, it is near it that limit or stop orders are placed, which are used in the currency market. In other words, it is a zone of general interest.
These levels, like everything in technical analysis, are quite subjective. They are drawn in different ways and in different places. However, if we take the levels that are drawn according to a strict formula, we get the lines that are not subject to different interpretations. They will always be the way they are. This is what Pivot Points or Pivot Points are. You have probably come across the mentioning of pivots in the description of various strategies. Today we will get acquainted with them in more detail.
What are Pivot Points?

Every trader tries to find his own approach to profitable Forex trading – some rely on intuition, others clearly follow the rules of their trading system. But there are also those who approach the Forex market from a mathematical point of view, trying to find regularities in the price behavior and calculate its possible direction, as well as rebound or breakout of the corresponding levels. Thus, one famous trader and mathematician Henry Chase, long before the appearance of computers (in the 30s of XX century) developed Pivot levels, which are calculated based on the maximum, minimum and closing price of the previous day. By making simple calculations, you can get the levels from which you can expect a price breakout or rebound.
In English, “pivot” means “reversal” and in financial markets it is commonly called a pivot point (pivot points).
In technical analysis the definition of pivot point is very important and the methodology of its calculation and trading strategies based on pivot points are used practically on all financial markets. This simple calculation system has been used by major banks and funds for more than half a century. Professional traders also use pivot points (pivots) to identify important support and resistance levels. Pivots are especially useful for traders who prefer intraday trading and short timeframes, whose goal is to take advantage of relatively small price movements.
Despite the age of discovery and the changing behavior of the currency market over the years, Forex Pivot levels continue to work and trading on them is profitable. Moreover, numerous indicators of Pivot levels have been developed, which greatly simplify the trader’s work. Now you do not need to make complex mathematical calculations, the computer will do everything for you. But to fully understand what the essence of these levels is, we will consider in detail how they are calculated and plotted on the chart, as well as get acquainted with the varieties of Pivot levels, typical indicators and peculiarities of trading on them.
Varieties of Pivot Points

Classic pivots are almost ninety years old, so it is not surprising that several different variants of their calculation have appeared. There are the following variants of Pivot Points:
- Traditional;
- Fibonacci;
- Woodie;
- Classic;
- Demark;
- Camarilla.
Traditional and Classic are very similar. The DeMark Pivot Levels are somewhat different from the classic Pivot Levels, and rather represent the levels that the price can reach within a certain period of time. They were developed by the famous analyst Thomas DeMark, who is also the author of the famous oscillator.
Woody’s Pivot Levels are similar to the standard Pivot Levels, but their calculation is slightly different, giving more importance to the closing price of the previous period. Camarilla’s Pivot Levels are a set of eight levels that serve not only as areas of support and resistance, but also as areas for setting protective stop losses and possible take profit targets. This is a development of Nick Scott, a well-known bond trader.
Traditional Pivot calculation formula

Pivots and their associated support and resistance levels are calculated using the values of the last trading session. The opening, closing, minimum and maximum values are used. Since Forex trading does not stop 24 hours a day, most traders use the closing time of the New York session at 4pm EST as the closing time of the previous trading session. Depending on the time of year, this is 12am EST or 11pm EST.
The simplest way to determine support and resistance zones has been used on Wall Street for decades. It takes the maximum price, the minimum price, the closing price for a certain period and divides it by 3 – this is how you get the pivot point, aka pivot.
Let’s see how the pivot point is calculated. First, let’s calculate the Pivot level itself:
Pivot = (High + Low + Close) / 3, where
high – yesterday’s maximum;
low – yesterday’s minimum;
close – yesterday’s closing price.
Then we calculate resistance and support levels using the values obtained for the pivot:
R1 = 2Pivot – Low;
S1 = 2Pivot – High;
R2 = Pivot + (R1 – S1);
S2 = Pivot – (R1 – S1);
R3 = High + 2 × (Pivot – Low);
S3 = Low – 2 × (High – Pivot), where:
R1, R2, R3 are resistance levels;
S1, S2, S3 – support levels.
DeMark Pivot calculation formula

Another popular way to calculate a simple technical indicator that helps predict the future of a trend is Tom DeMark’s pivot levels. Rather, these are not really pivot levels, but rather the predicted levels of the highest and lowest value for a given period. To calculate DeMark’s pivot levels, follow these rules:
IF (Close < Open), THEN Pivot = High + 2 × Low + Close,
IF (Close > Open), THEN Pivot = 2 × High + Low + Close,
IF (Close = Open), THEN Pivot = High + Low + 2 × Close.
New support level S1 = Pivot / 2 – Low,
New resistance level R1 = Pivot / 2 + High, where
high – yesterday’s maximum;
low – yesterday’s minimum;
close – yesterday’s closing price.
Woodie Pivot Calculation Formula

Woodie pivot levels are quite similar to regular pivots, but are calculated in a slightly different way, giving more weight to the closing price of the previous period. Use the following rules to calculate such levels:
Pivot = (High + Low + 2 × Close) / 4
Resistance (R1) = 2 × Pivot – Low
R2 = Pivot + High – Low
Support (S1) = 2 × Pivot – High
S2 = Pivot – High + Low
Camarilla Pivot Calculation Formula

Camarilla pivot levels are a set of eight levels that correspond to support and resistance values for the current trend. The source and exact method of calculating these pivot levels is not entirely clear. More importantly, these levels work for all traders and help to set the correct stop and profit values. You can use the following rules to calculate Camarilla’s pivot levels:
R4 = (High – Low) × 1.1 / 2 + Close
R3 = (High – Low) × 1,1 / 4 + Close
R2 = (High – Low) × 1.1 / 6 + Close
R1 = (High – Low) × 1.1 / 12 + Close
S1 = Close – (High – Low) × 1.1 / 12
S2 = Close – (High – Low) × 1.1 / 6
S3 = Close – (High – Low) × 1.1 / 4
S4 = Close – (High – Low) × 1.1 / 2
Online calculation of Pivot Points

On the Investing website, there are several types of pivot points available at once (they are called pivot points there). You can select a suitable interval (timeframe) on the side:
It remains to find these points on the chart and apply them by hand on the current quote.
The larger the timeframe, the more significant the support or resistance level will naturally be.
Pivot Point Indicators

Fortunately, we live in a time when all complex calculations can be entrusted to a computer. And pivots are not an exception. You can find a wide variety of indicators for MetaTrader 4 that calculate pivots in automatic mode at the link to the forum topic. There are all types of Pivot points with descriptions and screenshots. In addition, there is an open source PAC of indicators – this folder will be interesting, first of all, for programmers and those who like to see how indicators are written.
Also keep in mind that some Pivot Points indicators give additional options to calculate the third support and resistance level, intermediate level or median levels. These additional levels are not as significant as the main five, but it doesn’t hurt to pay attention to them as well.
Practical application of Pivot Points

You can work effectively with pivot points by knowing just three elements:
- the margin of safety for the trading session or day, usually taken from the average daily volatility;
- the reversal point during the trading session or day;
- trend direction.
There is the following rule regarding the trend definition. If the market of the current trading day opens above the central level of Pivot, then during the trading day preference should be given to deals to buy the asset. If the price on the market at its opening is below the central level, then preference should be given to short trades. If the market opens above the level, but then breaks it down, you should probably count on working in a channel.
In the picture below you can see the weekly Pivot levels on the 4-hour chart of the EURUSD currency pair.
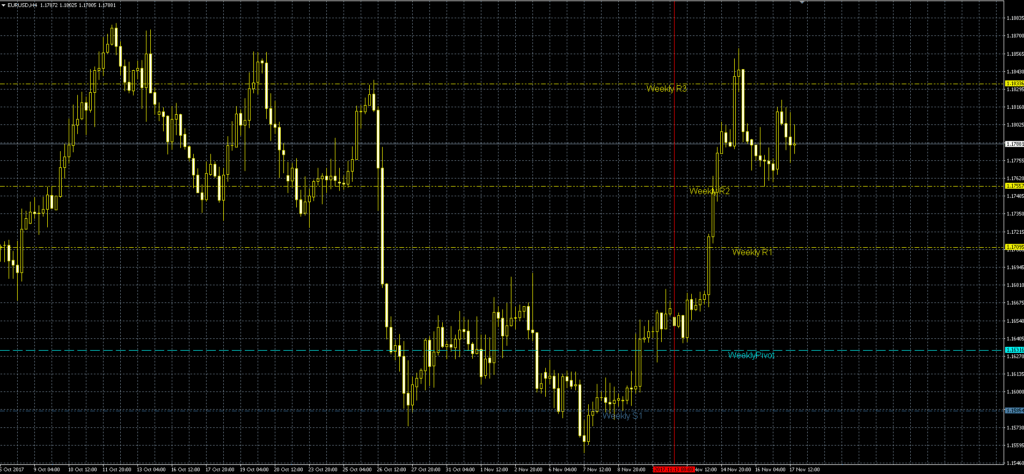
In this case, in the new week the market opened above the weekly Pivot level, so we should consider that this week the trend will be upward, which happened.
In general, the most important for practical trading are the reference center and reference points R1, S1. How does trading on these levels take place in general?
First of all, it is necessary to determine how the market opened relative to the pivot. In case it opened higher from above, it means that we will mainly look for buying opportunities. Then we wait for an approach to one of the levels – R1 and S1, depending on how the market opened. In our example, we will wait for the price at the R1 level and then wait for a breakdown or reversal:
And it worked out just like the textbook. The price broke through the R1 level, then there was a small pullback to the broken level and at this moment the most correct decision would be to place a pending order to buy on the hay of the pullback candle. In case the breakout is false, we simply delete the order and start to act according to the strategy that implies working in the channel (about it below). Stop Loss for our order is set at the minimum of the candle that broke through the level plus a small margin of a couple of points, in our case the stop was 27 points.
It should be taken into account that the shorter the stops, the more often they will be knocked out. Therefore, if you like to leave time for price maneuvers, you can set a stop for the nearest minimum or maximum. And if you like a high percentage of profitable trades, you can set the stop behind the Pivot level. Its crossing by the price is a guaranteed sign that everything is not going according to the original plan. Another interesting and really effective way of setting stops you can learn from this article.

I suggest dividing the initial order into two parts with different targets. Take Profit for the first order is set at the level of R2, for the second order – at the level of R3. When Take Profit of the first order is activated, the second order should be set to breakeven and start moving the stop following the price. To do this, you can use the standard trailing stop of the terminal, or download any auxiliary advisor from the forum.
Quite often by the time the market reaches the Pivot levels S2, S3 or R2, R3, the market is already overbought or oversold and these levels should be used to exit positions, not to open new ones. Therefore, splitting a position, partially closing it and transferring the remaining part to breakeven when the R2 or S2 level is reached can save you from getting a stop more than once. At the same time, this approach leaves the possibility of getting a bigger profit, as it happened in our example.
In addition, you should not forget about the average daily volatility – the average number of pips by which your chosen currency pair usually moves during the day. I advise you to determine it as follows:
ATR indicator determines the volatility of the instrument. ATR on daily charts determines the length of daily candles, i.e. just how far the price can move after the opening of the day. ATR with a period of 120 defines the average length of a daily candle on a period of six months – 20 working days per month.
So we can put 80 pips away from the day’s opening price and in our example it coincides with the R2 level. But of course this is not always the case, so the average size of the movement should always be taken into account in trading, especially when trading intraday – at least in order not to buy at the maximum of the day and not to sell at the very minimum. Also, when the price reaches such a distance from the opening level of the day, it can be used as a signal for breakeven, for example, or for closing a part of the position.
Well, if the R1 and S1 levels are not broken, or if the price breaks the Pivot Level in the other direction, you can consider a possible entry into the market when the price bounces from these levels and further work in the channel between the R1 and S1 levels.
Trading from pivot levels does not differ from trading on usual classical support and resistance levels. Therefore, it is worth paying attention to the price behavior near these levels and do not forget about the basic candlestick sets.
As you can see, theoretically the rules of trading using pivot levels are quite simple. However, in a real market situation, pivot levels do not work every time. The price has a peculiarity to fluctuate near the pivot levels, and sometimes it is very difficult to foresee what will be the direction of its movement in the future.
Sometimes the price stops before it reaches one of the pivot levels and turns around before reaching a few pips to your target. In other cases, for example, it seems that the pivot level looks like a strong support level and you open a long position. But right after that the price turns around and starts a rapid downward movement towards your stop.

Therefore, the trading template I have proposed is designed to simplify your task as much as possible.
- Look at the opening of the week – if it is below the Pivot Point, sell, if it is above – buy;
- Watch the price, wait for it at the S1 level for selling and at R1 for buying;
- If the price crossed the Pivot level in the other direction, we switch to the channel mode – we will work on the rebound from any levels – Pivot, S1 or R1, until the price reaches S1 or R1. In this case, we suspend trading – on the one hand, these levels are already quite far away and there is a high risk of a rebound from them, on the other hand, the price has been in the channel for some time and may have accumulated enough strength to continue the movement;
- If the price successfully reached S1 or R1 depending on our direction and broke the level, we expect another candle after closing the candle that broke the level. As a rule, the price usually rolls back to the level, giving us an opportunity to place a pending order;
- S2 and S3, or R2 and R3 levels can serve as targets. Either the nearest local maximum/minimum or the ATR reading multiplied by 2-3 is taken as a stop. For M5, M15, H1 and H4 I recommend a period of 24, for D1 – 20;
- When working in the trend mode, I advise you to enter with two orders – the first one you will close on S2 or R2, and the second one after closing the first one you will move to breakeven and pull up the stop following the price. In case the price is a few points short of take profit and starts to turn around, you should close the deal with your hands without waiting for the order to trigger;
- When working on the channel strategy, I do not recommend beginners to work from the Pivot Point level, I advise you to take only S1 and R1 levels. The thing is that when working with Pivot Point there are a lot of false signals and it is quite easy to get confused – the price often passes this level in different directions without actually moving anywhere.
Let’s try to visually analyze a few fresh situations to better consolidate the knowledge in your memory. I do not recommend beginners to trade on periods below H1. That’s why we will analyze the examples for this timeframe, but all the basic rules of working with Pivot Points also work on any timeframe. You just need to choose the right pivot period for each timeframe. For D1 it should be monthly pivots, for H1 and H4 – weekly pivots, everything below H1 works well with daily Pivot levels.
Example 1. AUDUSD currency pair.
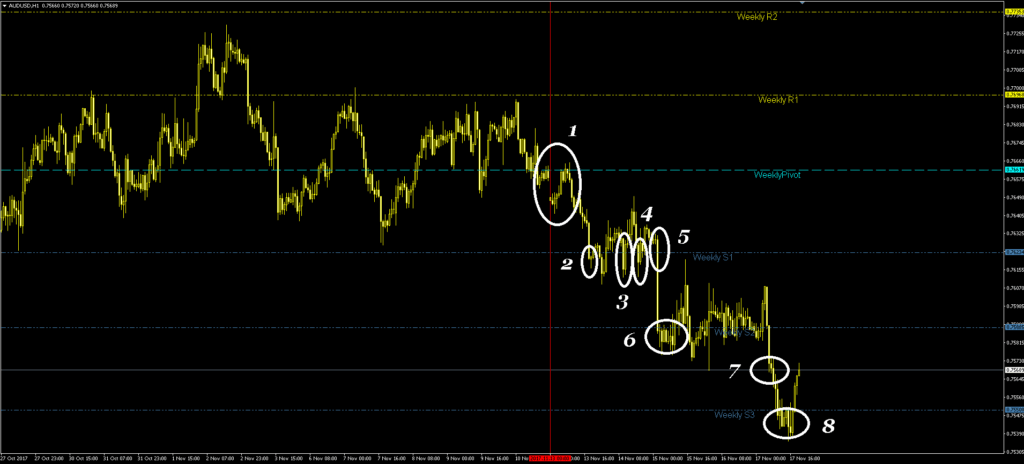
- The week opened below the level, so first of all we are waiting for an opportunity to sell from the S1 level after its breakdown;
- At point 2 there is a breakdown, after which the price rolls back to the level on the next candle after the breakdown. The candlestick definitely looks like a pinbarpending , but we still (let’s say) set a order at the minimum of this candlestick;
- Then our order will be activated, and if not, we will have a few more entry opportunities at points 3 and 4;
- In case you place your stop far enough away (the last high in our example coincides with the Pivot level), after activating the order, you will successfully reach the first target at point 6 – the S2 level;
- You could then break-even because the price has bounced quite a long distance from S2;
- If this did not happen, you would successfully reach the average daily volatility level at point 7 and then the S2 level. In either case, you would have at least taken about 35 pips profit with half of the order, while the other half would have closed at breakeven.
Example 2. USDCAD currency pair.
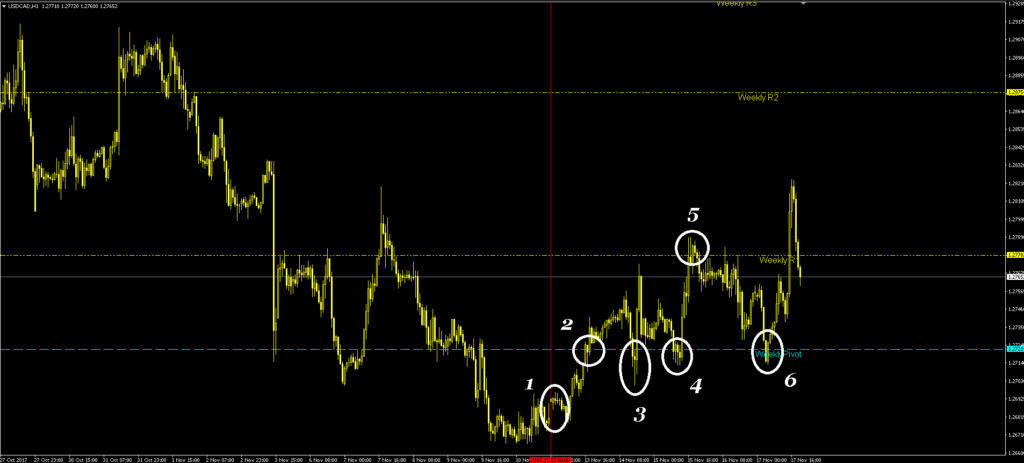
- The market opened below the pivot at point 1. So we expect selling;
- Then there was a breakdown of the Pivot Level in the direction of buying in point 2. So, now we will switch to working in the channel – we will work on the rebound from the Pivot, S1 and R1 levels;
- At point 3, there was a breakdown of the Pivot Level, and since we are working in the channel, we place a pending order slightly above the level. Stop, as usual, can be set on the nearest minimum or on the ATR indicator;
- Our pending order was activated, but it did not reach the target. This happens often in the channel mode with Pivot Points, so I would recommend either to set the TP a little in advance, or to observe the situation on the market and close manually, if the price is a little short and begins to turn around. As they say, a bird in the hand is better;
- At point 4 we again had an opportunity to enter the pending order to buy and this time the price confidently reached the target;
- At the same point 5 the level was broken, so this time we set an order to sell. This order was quickly activated and brought us 55 pips, while hanging around in the market for about 1.5 days – it can’t be helped, the market can be like that. But at the same time, following the rule of premature closing, it was possible to do it within 24 hours – the price was only 4 pips away from the target 12 hours before point 6, and then turned around;
- Again at point 6 there was a level breakdown again. Well, you have already realized what should be done. This time the price broke far through the level R1, but then came back. There was no sense to trade here, as it was already Friday evening and the new week will have completely different levels.
Example 3. USDJPY currency pair.
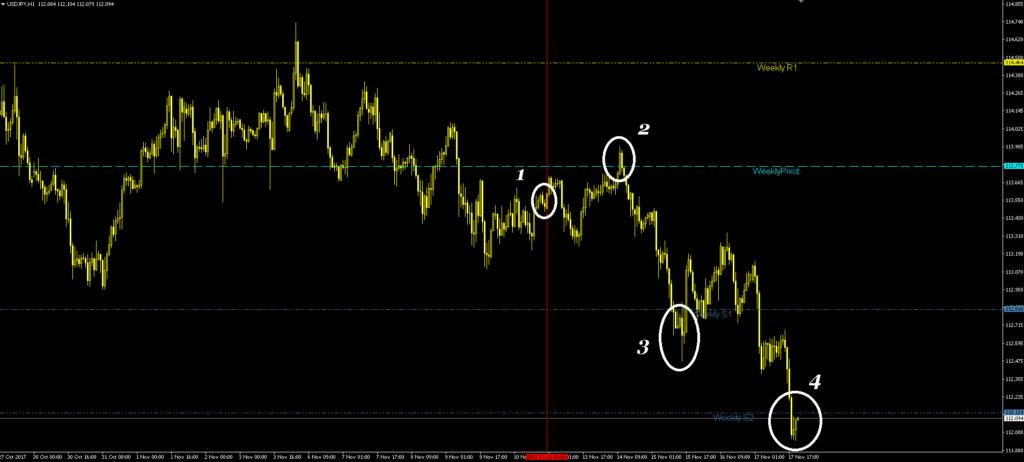
- The opening of the week was below the pivot, so we are looking for sales;
- At point 2 we almost broke the Pivot level. If this had happened, we would have switched to the channel mode. Well, in our case we will continue to wait for the price to reach the S1 level and break it, or bounce back to the pivot level;
- At the 3rd point, the S1 level was broken and we managed to take only the first target at the S1 level. There are a few hours left till the weekend, and in this case it would be reasonable to close all trades and go on vacation.
Example 4. GBPUSD currency pair.
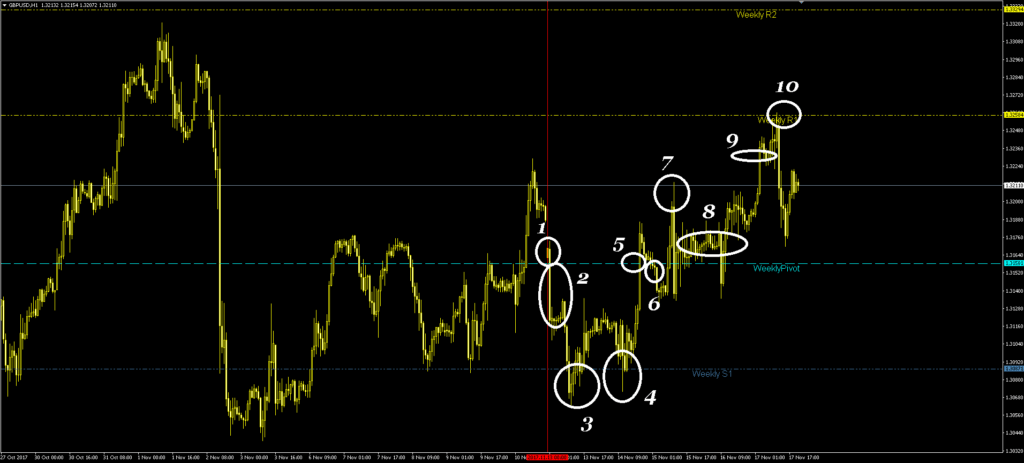
- Perhaps, this is the most interesting example. So, we opened the week above the pivot, which means that we expect to buy;
- Almost immediately the price broke through the Pivot Point, well, and we switched to the channel mode;
- At point 3 we entered the market by activating a pending buy order with a target near the Pivot Point. Latecomers could jump in at point 4;
- At Point 5, we took profits from our purchases and prepared to sell;
- At point 6 our order was activated, and we took a stop loss at either point 7 or point 9. As I said, I do not recommend beginners to work with the Pivot level just because of this behavior;
- If we got a stop at point 7, then at point 8 we could buy with the target R1 and make a profit at point 10. We did not place an order at point 10, because the level was not really broken – the candle hit it with its tail and did not close above the level.
Example 5. USDCHF currency pair.
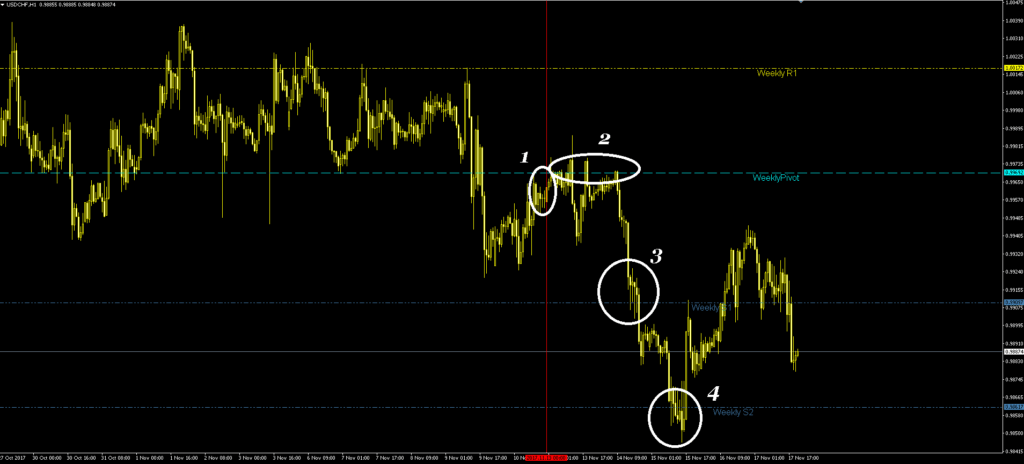
- Again we look at the opening and see selling;
- Several times the price tried to break through in point 2, but still stayed in place and in point 3 we reached S1;
- In general, there was no real breakdown of the level at point 3, as the price touched it only with tails, and then sharply flew away from the level. So, perhaps, someone would have missed such a signal, and someone would have placed a pause;
- Those who put a pending order would have made money on taking the first target at point 4, and the second order would have closed at breakeven;
- The price turned back and we forgot about this pair until next week.
And the last example, illustrating the possibility of working according to the same rules on a smaller period. Let’s consider USDJPY on the M15 period and daily Pivot levels.
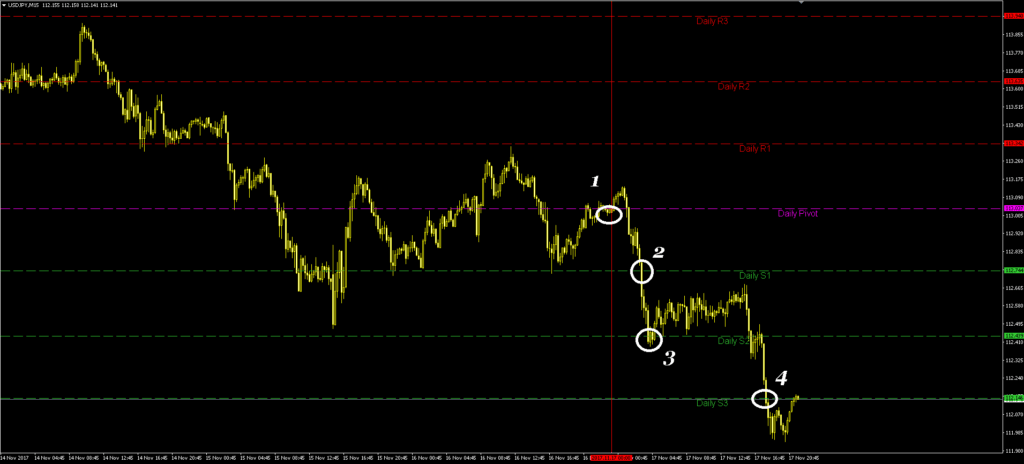
- At point 1 the day opened lower, so we are selling;
- At point 2 the level was broken, and at point 3 the first target has already been reached;
- After a while we took the second target as well.
The only thing to pay attention to when working on small periods is that breakdowns of levels very often occur without pullbacks, with sharp movements that are difficult to catch up. Setting a pending order just for the level before the price has broken through it increases the number of losing trades. That’s why you need some practice and you should start working on this system from the H1 period, and maybe even higher.
Conclusion

Pivot points is a technique used by professional traders and market makers. It allows you to determine entry and exit points for today’s session based on the results of the previous day. Pivots can be extremely useful in forex trading as many currency pairs respect these levels well.
The ease of use of pivots certainly makes them a useful trading tool worth having on hand. Learn to use pivot levels in conjunction with other technical analysis tools such as Japanese candlesticks, MACD indicator line crossovers, moving average crossovers, and stochastic overbought/oversold levels, for example.
Good luck and see you soon!