
Order Book and Depth of Market (DOM): How to Analyze the Order Book

An order book, or depth of market (DOM), is a dynamic register of all active limit orders to buy and sell a financial instrument. It is here, in real time, that the price of any asset traded on an organized market is formed. Unlike a linear price chart, the book shows participants' intentions: how much they are ready to buy or sell and at what price. Understanding how it works opens access to order flow analysis and makes it possible to see market liquidity, hidden support and resistance levels, as well as manipulation by large players.
In this article, we will examine in detail what an order book is, how it differs from Depth of Market (DOM), on which venues it truly exists, how the "book" works at forex dealers, and which analysis methods help make trading decisions.
Order Book and Depth of Market: What Is the Difference?
Both terms are often used as synonyms, and in the interfaces of most trading platforms they really do mean the same thing: a table of prices and order volumes. However, there is a subtle functional difference between the concepts that is important to understand from the technical side.
The order book is the data array itself: the full list of limit orders stored on the exchange server. It contains all unfilled orders with price, volume, placement time, and type (buy/sell). This is the base that the exchange engine continuously processes, matching opposing orders. The trader sees only a reduced version, usually several price levels on each side.
Depth of Market (DOM), or market depth, is a graphical or tabular representation of a slice of the order book, showing the aggregate order volume at each price level from the current market price. In the Russian-speaking environment, it is DOM that is called the "book." Thus, the order book is the source data, while DOM is its visualization for assessing liquidity depth. When a trader says, "I am looking at the book," they are actually analyzing DOM levels. The term DOM levels directly points to those rows in the table where Bid and Ask are grouped by prices and volumes.
On high-tech platforms (for example, terminals for CME futures or crypto exchanges), DOM also means a dynamic interface where orders are displayed as columns, and market trades instantly "hit" volumes at specific prices; this is called a high-definition order book. The essence of the distinction does not change: the order book is the full register, DOM is its displayed part. In practical work, these concepts can reasonably be considered interchangeable.
Where a Real Order Book Exists
A genuine order book is maintained exclusively on centralized exchanges operating under the order-driven market model. This means that prices are formed directly from participants' limit orders, while the venue acts as a neutral intermediary. Such markets include:
Stock exchanges (NYSE, NASDAQ, Moscow Exchange). Here the order book forms the core of trading. There is the concept of Level 2 market data, a subscription that gives access to market depth beyond the best quotes. The trader sees not only Best Bid/Ask, but also queues of orders at lower prices, as well as market maker identifiers (ECN book). It is precisely through the book that NYSE intraday traders work, tracking the appearance of large institutional orders.
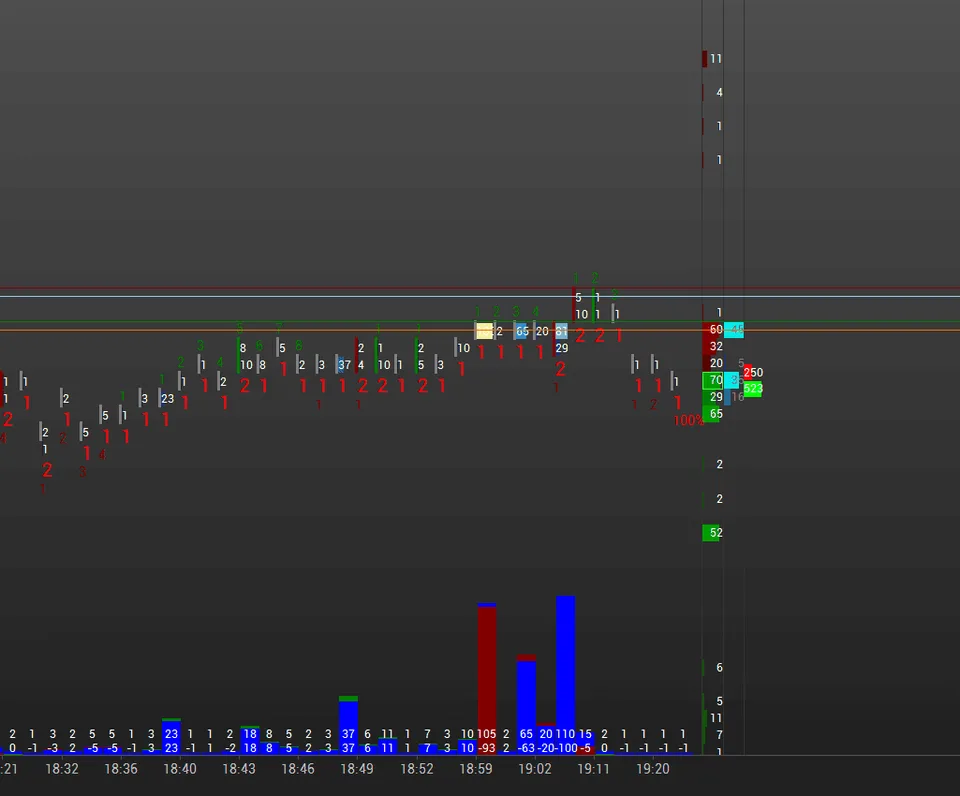
Derivatives markets (CME, Eurex, FORTS). Futures and options are traded through a central order book. For CME futures on indices, currencies, or commodities, DOM is the scalper's main working interface. Platforms such as NinjaTrader, Sierra Chart, or ATAS display the order book as clusters, heat maps, and volume profiles, allowing traders to see aggressive market trades inside each price bar.
Cryptocurrency exchanges (Binance, Bybit, Kraken, OKX). The crypto industry is fully transparent: through a WebSocket API, it is possible to receive the order book in real time with depth of up to several thousand levels. The book on such venues contains anonymized users' limit orders, and this is a real order-driven market. Imbalance indicators, liquidity heat maps, and visual order densities are popular here.
The common principle for all the listed venues is a real consolidated register of orders. Execution is guaranteed by the exchange mechanism: if your limit order becomes the best by price, it is executed when an opposing market order arrives. Order book data is the same for all participants (taking into account the level of paid depth subscription). That is why order book analysis on such markets has an objective basis.
DOM Levels: Anatomy of the Book
A classic DOM book consists of two halves. The left (green or blue) side contains buy orders (Bid), while the right (red or pink) side contains sell orders (Ask or Offer). Bid prices are arranged in descending order from top to bottom, and Ask prices in ascending order.
The best buyer price (Best Bid) and the best seller price (Best Ask) form the so-called inside quote. The difference between them is the spread. The center of the book often shows the price of the last trade.
Each DOM level contains two key parameters: price and volume. Volume reflects the total number of contracts, lots, or coins that participants are ready to buy or sell precisely at this price.
Large clusters of volume are called walls. A buy wall may signal strong support, while a sell wall may signal resistance.
An important characteristic is immediate liquidity. If buy orders are placed at the 50,000 BTC level, a market sale of the same volume will not move the price lower until this liquidity is absorbed.
By studying the proportion of volumes across several levels, the trader calculates imbalance. For example, if the sum of Bid volumes across the first ten levels is twice as high as Ask volumes, this indicates potential bullish pressure.
The higher the DOM detail (the more displayed levels), the deeper the analysis of the current balance of forces.
Order Book at Forex Dealers: Features and Illusions
The Forex market is fundamentally different. It is a decentralized over-the-counter market (OTC), where there is no single center and no single register of orders. Each participant, whether a bank, ECN system, or retail broker, has its own "view" of the market. Therefore, the concept of an order book as applied to forex requires careful interpretation.
The situation differs among different types of forex brokers and bucket shops:
A-Book (STP/ECN brokers). The dealer routes client orders to external liquidity providers. In this case, the book reflects the flow of prices and volumes from a pool of several banks and ECNs (Currenex, Integral, Hotspot). The trader sees the upper layer of market depth, but this is still not the full order book of the currency market; a unified one simply does not exist. Available depth is limited to 5-10 levels, and each provider may have different liquidity.
B-Book (dealing desk). The broker does not route trades to the external market, but acts as the counterparty. The book here is an internal model, a synthetic construct. It displays the prices and volumes that the broker is ready to simulate in order to create the appearance of market depth. This "book" has no influence on the global currency market, and a large order will not move interbank quotes.
Thus, the forex order book is not an objective reality, but rather a "liquidity showcase" of a specific dealer. Nevertheless, experienced traders use even this kind of DOM information.
Depth of Market (DOM) in MetaTrader 5: How the Order Book and Market Depth Work
Depth of Market (DOM) is a tool in the MetaTrader 5 trading platform that allows you to view current buy and sell orders for a financial instrument.
One important feature of MetaTrader 5 is the difference between exchange-traded and over-the-counter instruments.
Exchange Depth of Market
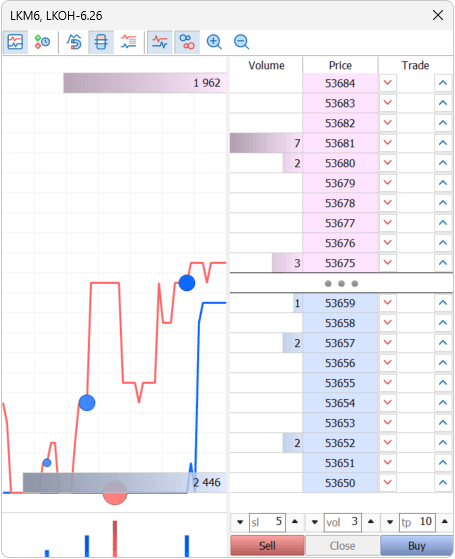
If an instrument is traded through an exchange and orders are routed to a centralized trading system, DOM shows the real prices and order volumes of market participants (as on Bybit). In this case, the trader sees a real order book reflecting the actual state of supply and demand.
This model is typical for:
futures;
stocks;
options;
some commodity contracts;
exchange-traded currency instruments.
Order Book at Forex Brokers
On the Forex market, the situation is different. The currency market is decentralized, so there is no single order book.
In MetaTrader 5, market depth can be formed based on data provided by the broker or liquidity providers. Depending on the company's infrastructure, DOM may show:
real quotes from counterparties;
aggregated data from several liquidity providers;
calculated price levels without displaying real volumes.
If the broker does not transmit volume data, the market depth is used mainly as a tool for quickly placing orders. In this case, levels are calculated based on current Bid and Ask prices, taking into account the minimum price step.
Therefore, when working on Forex, it is important to understand that a forex dealer's order book does not reflect the entire global market and often shows only the liquidity available to the broker.
In MT5, by the Depth of Market indicator, you can assess the current spread width at a specific provider, see at which levels a large aggressive broker order is placed (the so-called “liquidity shoulders”), and notice a short-term thinning of the market before news.
However, building full-fledged order-flow strategies based on a forex dealer's order book is risky because of the lack of transparency and the possibility of manipulation by the broker.
But you have to look at the order book somewhere. And that “somewhere” is the “Order book market depth” tool on TLAP.
The tool allows you to assess the overall depth of the aggregated forex order book and the liquidity placed at different levels. Almost like on a real exchange.
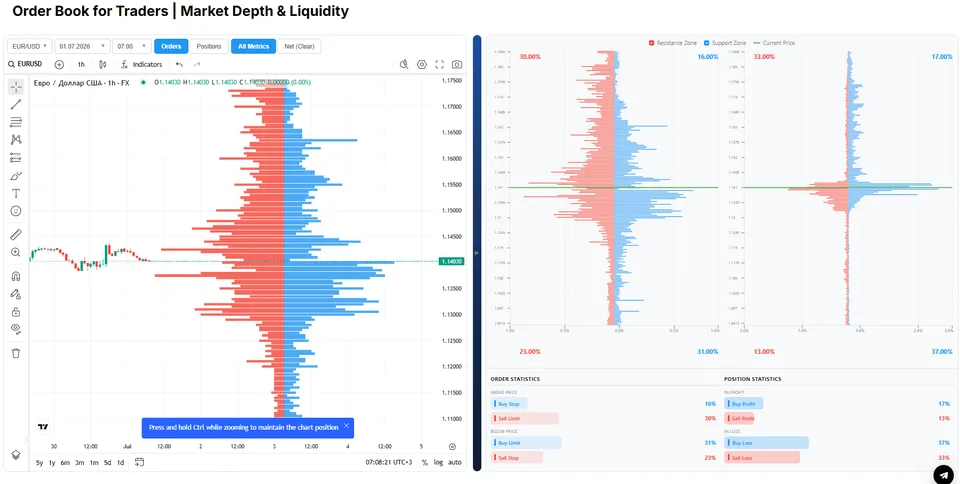
An important advantage of TLAP's over-the-counter order book is the availability of data by order types above/below the price and an indicator of profitable/unprofitable trades.
Trading Through DOM
MetaTrader 5 allows trading operations to be performed directly from the Depth of Market window.
Through the Depth of Market, you can:
open market positions;
place limit orders;
set stop orders;
modify existing orders;
manage Stop Loss and Take Profit;
delete orders with one click.
When the One Click Trading function is enabled, orders are sent to the server without additional confirmation.
How trades are executed in the order book
When a trader sends a large-volume market order, the system begins executing it at the best available prices.
For example, if it is necessary to buy 20 lots, and only 5 lots are available at the first level of the book, the remaining volume will be executed at the next liquidity levels. As a result, one trade may consist of several executions at different prices.
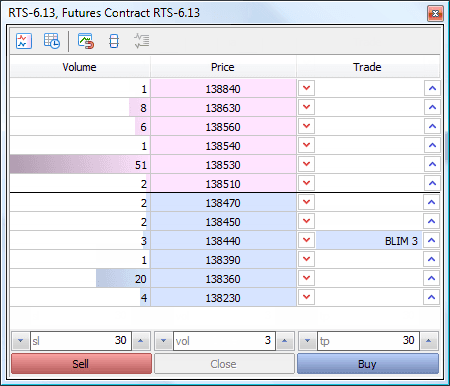
This is why market depth analysis is especially important for large participants and scalpers.
The basis of any order book is limit orders. After placement, a limit order becomes part of the book and can be executed by an opposite market order.
With stop orders, the situation is different (Buy Stop; Sell Stop; Buy Stop Limit; Sell Stop Limit). Until the specified price is reached, such orders are usually processed inside the trading system and are not displayed in the general book. After activation, they can turn into market or limit orders.
One of the advantages of DOM in MetaTrader 5 is the ability to manage positions interactively. The trader can:
drag limit orders with the mouse to new levels;
change order prices without opening a separate window;
move Stop Loss and Take Profit levels;
delete orders directly from the book.
This approach significantly speeds up intraday work and makes DOM a convenient tool for scalping.
Time & Sales Tape
For exchange-traded instruments, MetaTrader 5 additionally provides the Time & Sales window.
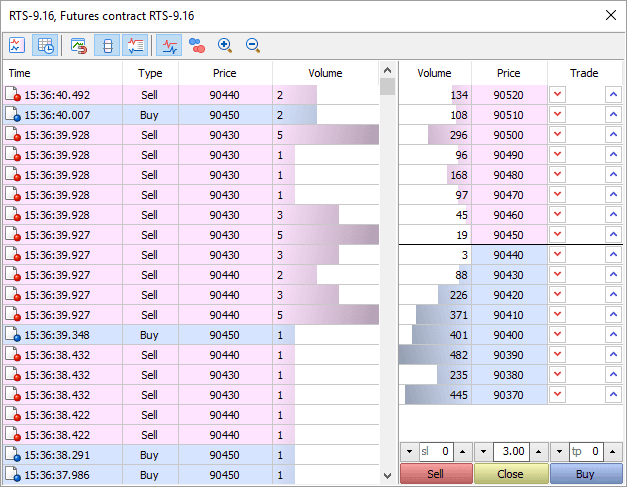
The Time & Sales tape shows:
trade execution time;
price;
volume;
trade direction (buy or sell).
Using this data, the trader can assess participant activity, trading intensity, the presence of large players, and the significance of price levels.
Many professional traders analyze DOM and Time & Sales simultaneously, because this combination allows them to see not only orders in the book, but also the actual execution of trades.
Tick Chart in DOM
In MetaTrader 5, Depth of Market can be supplemented with a tick chart.
It displays all completed trades. The larger the trade, the larger the marker (circles and side clusters) in the tick chart window.
How to Analyze the Order Book: Practical Methods
Competent DOM analysis turns the order book from a colored table into a powerful tool for forecasting short-term price movements. Let us look at the key techniques.
Assessing the imbalance of Bid/Ask volumes.
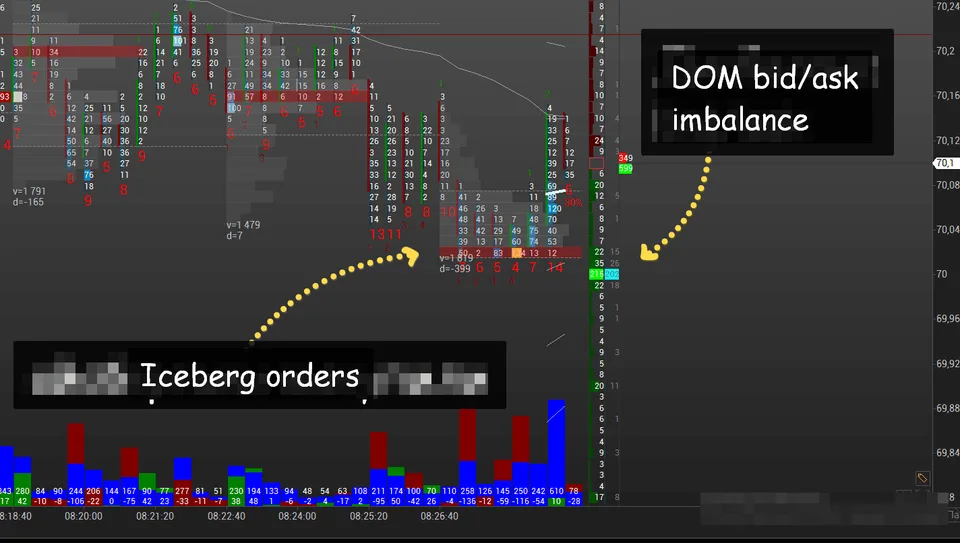
The simplest method is to compare the total volume on the buy and sell sides within the visible levels. If the first ten Bid levels show 450 contracts, while the Ask side shows 180, the current advantage of buyers is obvious. What matters is not only the static value, but also the dynamics: a rapid increase in volume on one side while the opposite side is “melting” at the same time foreshadows momentum.
Identifying walls and absorption levels.
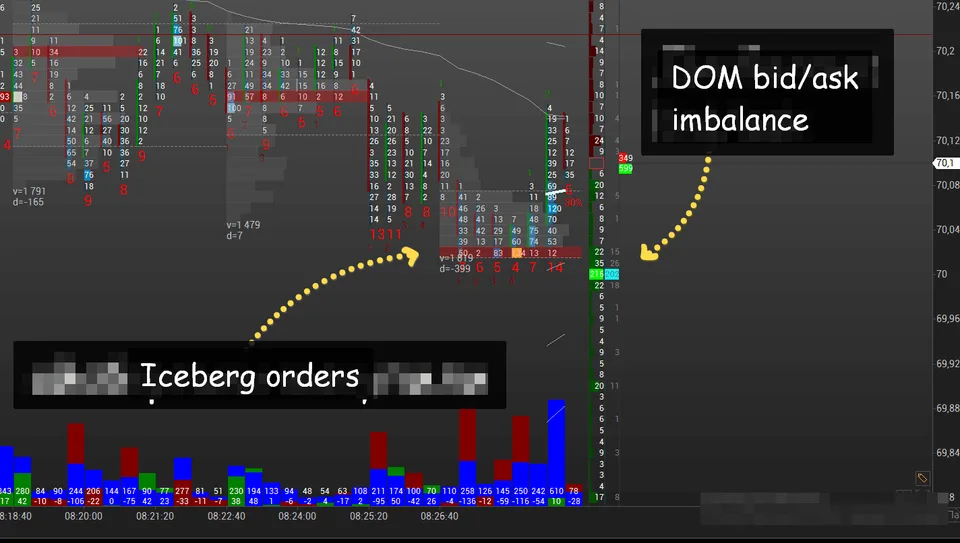
An abnormally large order, many times greater than the average volumes at neighboring prices, is a wall. If a buy wall sits just below the current price, it can act as a magnet: the market often “seeks liquidity” and moves toward this level to fill a hidden order.
A breakout of a wall after its partial or full absorption often creates a sharp impulse in the breakout direction, since the large buyer disappears and support collapses.
Tracking icebergs.
An iceberg order is shown in the order book only as a small visible part, and when it is executed it is automatically replenished.
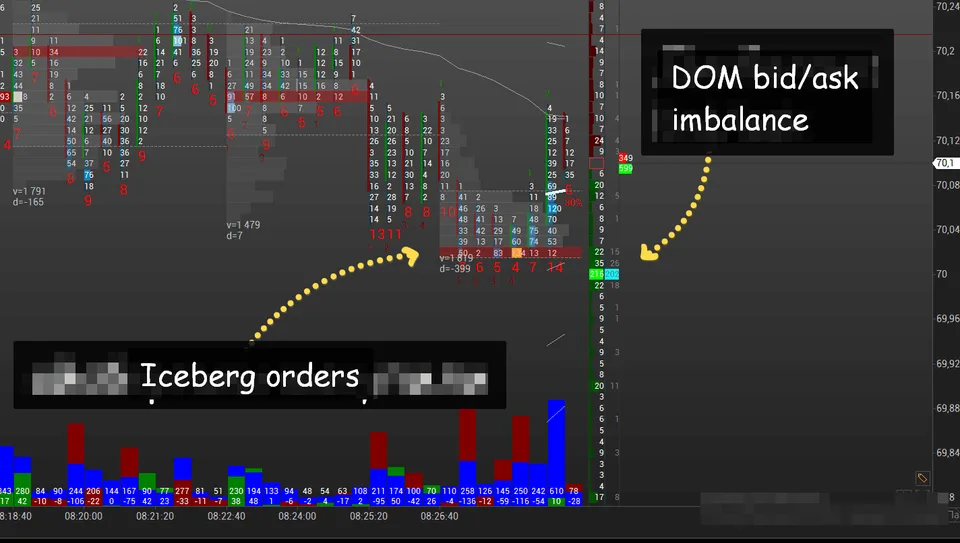
In modern terminals (for example, crypto exchanges or ATAS), an iceberg can be suspected if a fixed volume stays at one price level for a long time without decreasing as market trades are executed. Such hidden large players indicate serious interest in holding the price.
Spoofing and manipulation.
Fake large orders often appear in the order book and are canceled before execution. Spoofers create the illusion of a wall, provoking the crowd to act in the direction they need.
An analyst must watch the lifetime of a large order: if the volume repeatedly appears and disappears at one level, the probability of manipulation is high. On regulated exchanges this is prosecuted, but in the crypto market and in broker-controlled books it occurs often.
Delta and aggressive trades.
A derivative instrument from the order book is delta, the difference between market buys and sells over a certain period.
Here, traders track not limit orders but the fact of market execution: aggressive buyers hit the Ask, aggressive sellers hit the Bid. Comparing cumulative delta with price movement gives divergence signals. For example, the price rises while delta turns negative; this is a bearish divergence that warns of trend weakness.
Cluster analysis and volume profile.
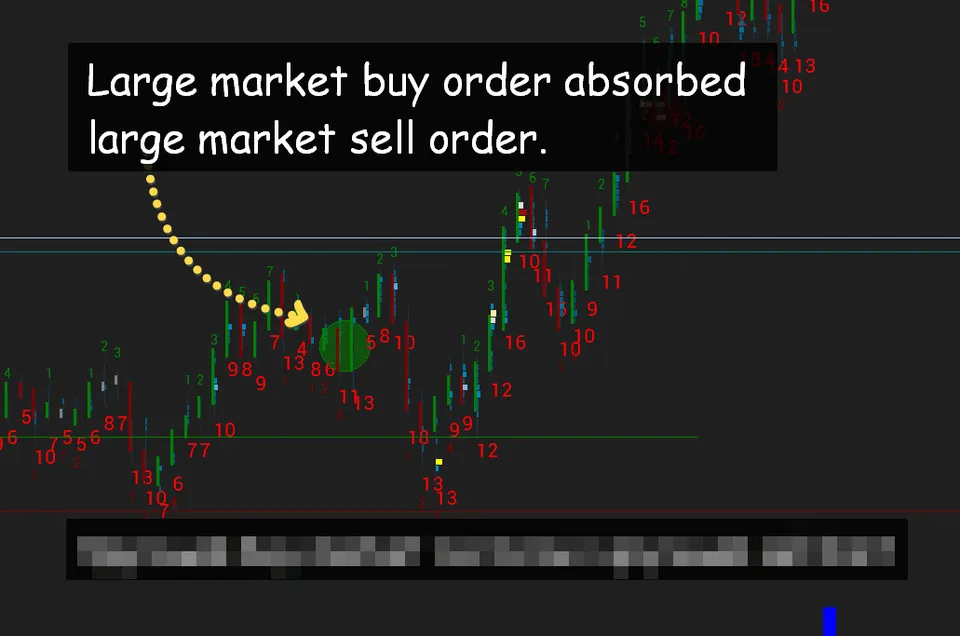
Since the order book stores the history of order placement and cancellation, horizontal volumes and a market profile are built from this data.
A footprint chart shows how many contracts traded at each price inside a candle, split into buys and sells. By analyzing the footprint, a trader sees points of maximum limit activity (large Bid/Ask at individual ticks), which helps find precise entries and reversal zones.
Heat maps (heatmap).
This is a DOM visualization where large clusters of orders are highlighted with a bright color. In real time, zones of liquidity concentration and their flow from level to level are visible.
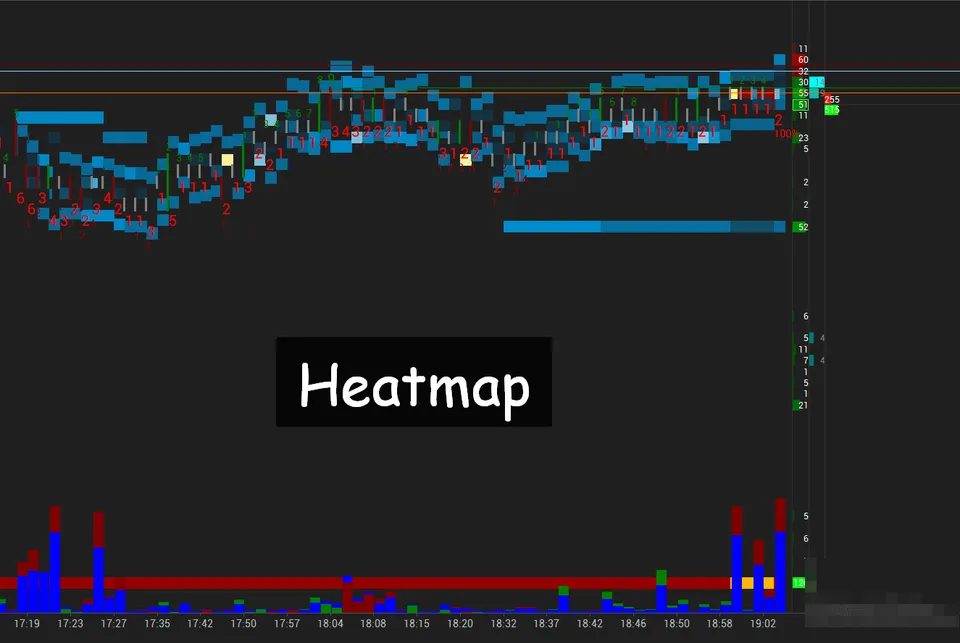
The heat map instantly reveals the disappearance of major protection, which often precedes a breakout. The tool is widely used in crypto trading (Coinalyze, Bookmap platforms) and in futures markets.
Time and speed analysis.
Modern tools make it possible to assess how quickly volume is absorbed at a specific level.
If a Bid wall is being “eaten” by market sells while the price does not fall, it means an even stronger hidden buyer is standing behind the wall, immediately placing new limit orders. This behavior can be read only through continuous monitoring of DOM dynamics.
Trading Strategies Using the Order Book
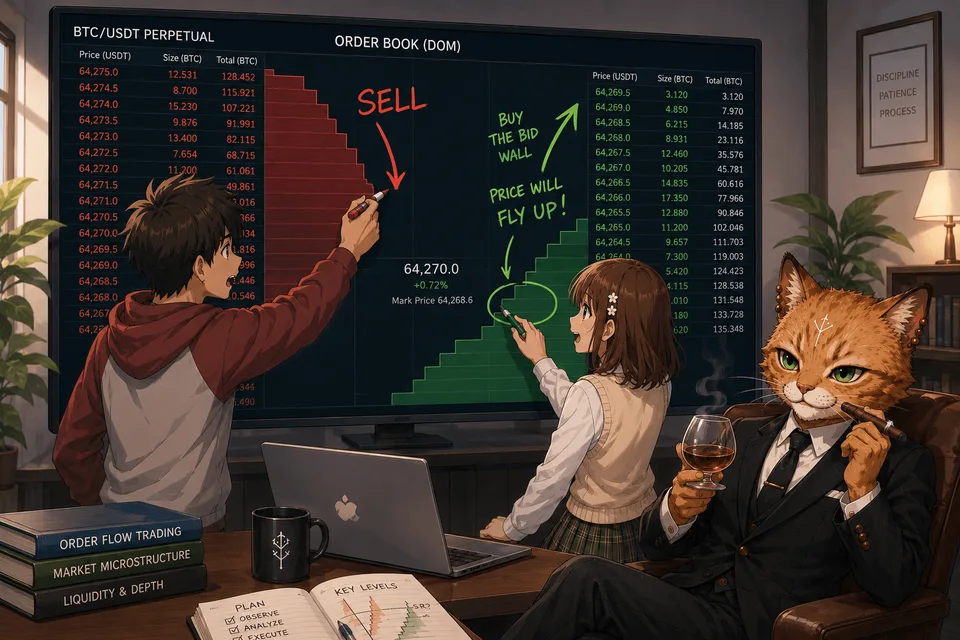
Bounce from Large Limit Clusters (Walls)
Massive limit buy orders (bids) or sell orders (asks) act as temporary barriers from which the price is highly likely to bounce.
If volume many times higher than average values is concentrated at a specific level, this indicates the presence of a large player or market maker limiting the current price range with that order.
As long as such a large order has not been executed or removed, it will hold back the price. The trader enters in front of such a wall, expecting a bounce in the opposite direction.
Application.
Find a level where the volume of limit bids / asks is many times higher than the surroundings. Wait for the price to approach this level, but not touch it, and open a trade under this order.
The stop loss is placed directly behind the wall. If the price “pierces” the protective volume, it means the large buyer has left or has been absorbed, which invalidates the trade idea.
The target is the nearest cluster of asks or a local high.
The strategy implies understanding the market phase (balance or impulse), so it is extremely risky, since volume is often absorbed either for a breakout or for a reversal.
False Breakout (Trap)
The price breaks through a significant level from the order book, provoking the crowd to enter in the direction of the breakout, but quickly returns back. The trader enters against the false impulse.
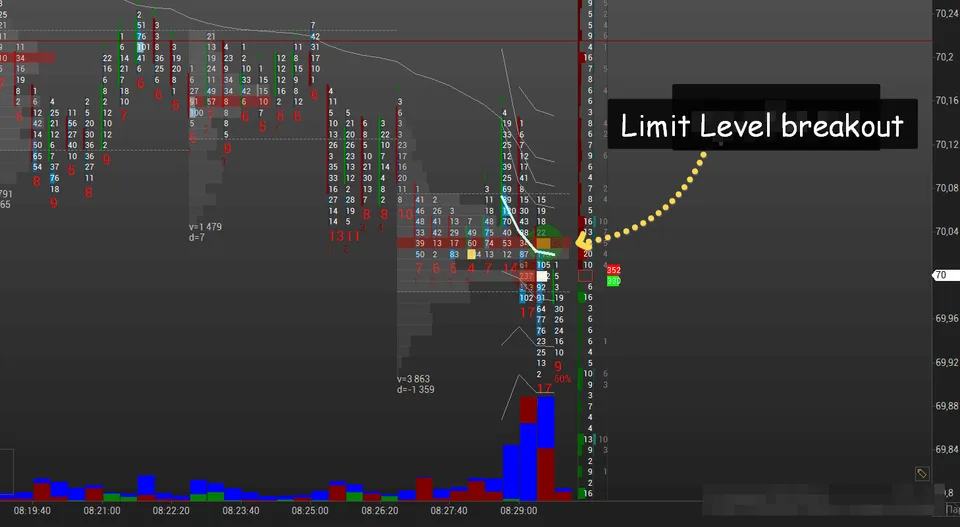
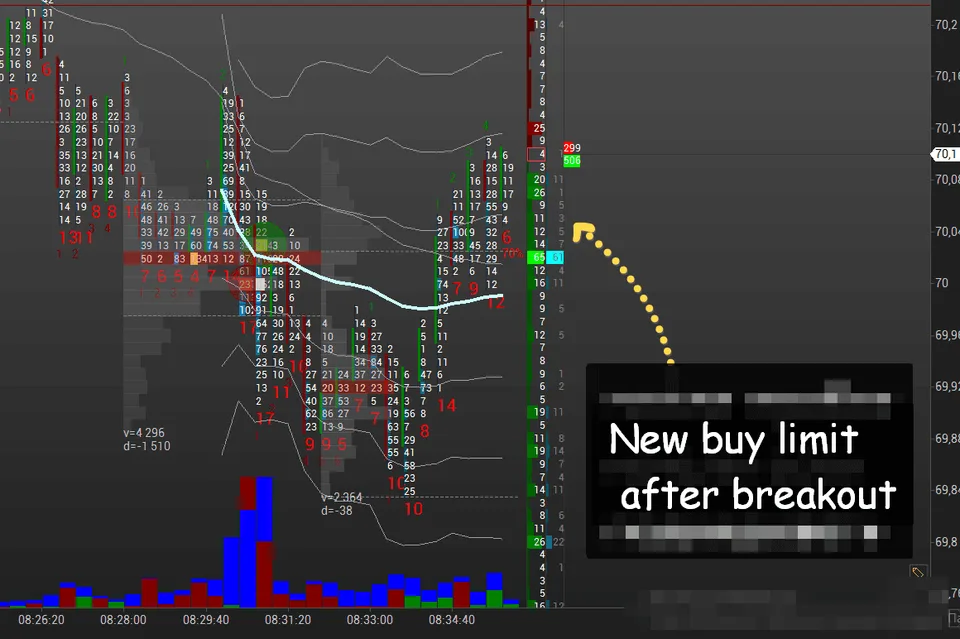
The logic of events is as follows.
In one case, a large player deliberately pushes the price beyond a strong limit boundary in order to trigger stop losses and attract “breakout traders,” after which they reverse the position using the liquidity that has appeared. This is a stop-hunting situation.
In the second case, a strong bounce may be merely a situation of trading through an FVG. In other words, either a temporary transition into balance occurs, or a return to the main balance. If it is the second situation, then such absorption with a return is often the penultimate touch of the boundary before its breakout.
Application.
You mark a clear level with an abnormally large volume of bids (support) or asks (resistance). The price breaks through it, but does not develop the move, and after one or two candles returns beyond the level.
Enter long on a false breakout of support as soon as the price closes above it. Stop below the low of the false sweep.
For sales: a false breakout of resistance means entering short after the price returns below the level, with the stop above the false peak.
Breakout of Absorbed Volume
When a wall that served as support or resistance is completely “eaten” by market orders and the price passes through it, an impulse trade opens in the breakout direction during a tactical test of the limit order.
The disappearance of a significant limit barrier indicates victory for the opposite side. The market is no longer held back, and a cascading move begins, often strengthened by stop-losses triggering beyond the level.
Application.
Watch a dense bid. When market sales begin actively absorbing it and the wall volume shrinks before your eyes, prepare for a short.
Entry is made immediately after the level is broken and the price has settled below the former support.
The stop is short, placed above the broken level (now it often becomes resistance). Account for a possible false breakout of the absorbed order.
An alternative option is to wait for the price to return to the broken level (“retest”) and enter on a bounce from it, now as from new resistance. This requires a certain waiting time.
Especially strong breakouts occur when an FVG imbalance is visible behind the wall in the order book, a price zone with minimal volumes. The absence of limit barriers accelerates the move.
Defense of Absorbed Volume
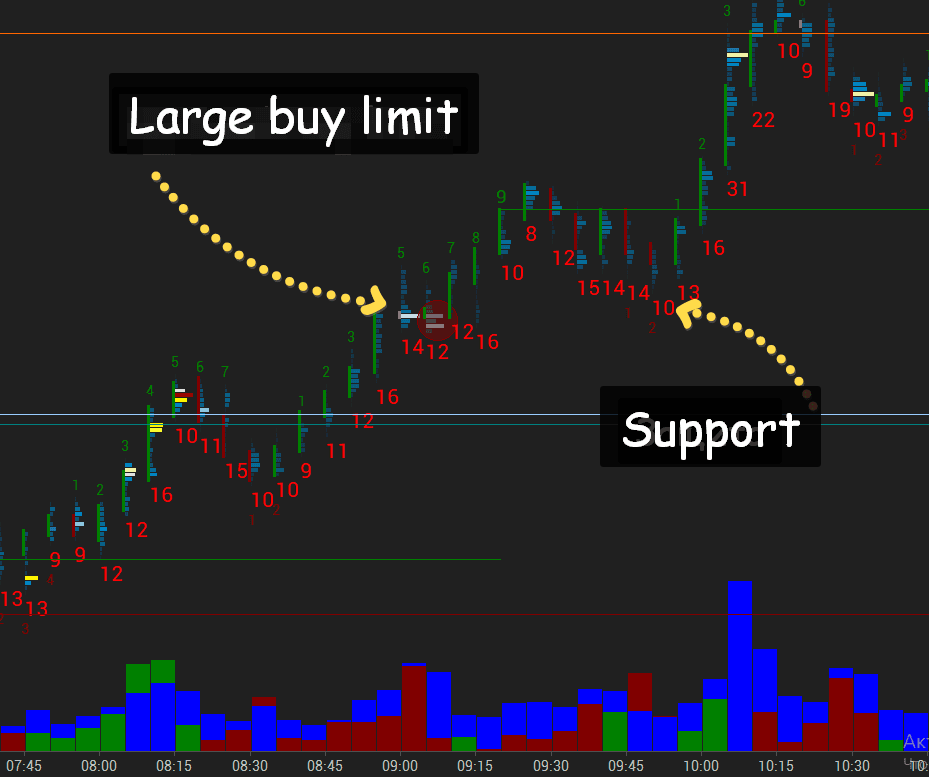
The price approaches the absorbed volume or pierces it non-aggressively and quickly returns back. This is the very situation of a W-shaped reversal or a volume test in a trend. The trader enters against the false impulse.
Application.
You mark a clear level with an abnormally large volume of bids (support) or asks (resistance).
The price approaches, touches, or pierces it, but does not develop the move, and after one or two candles returns beyond the level.
Enter long on a false breakout of support as soon as the price closes above it. Stop below the low of the false sweep.
For sales: a false breakout of resistance means entering short after the price returns below the level, with the stop above the false peak.
Absorption
A large limit order systematically absorbs opposing market orders, preventing the price from moving anywhere, which indicates position accumulation.
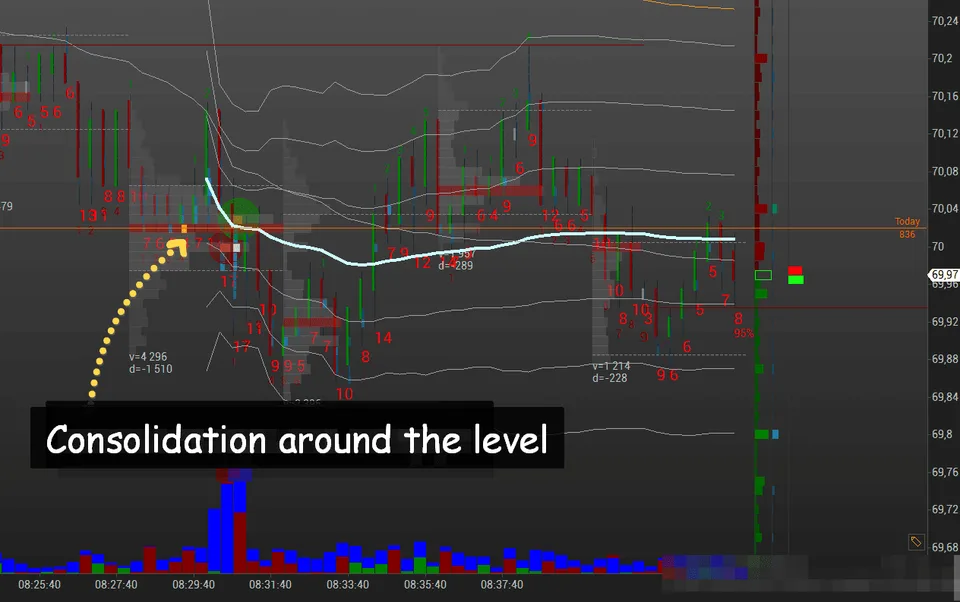
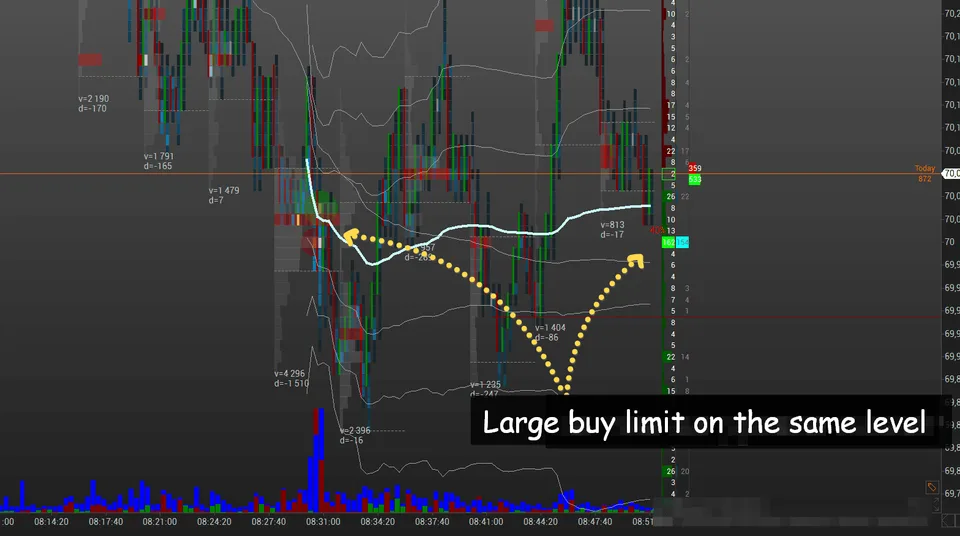
This means that a significant bid is standing at a certain level, often with icebergs nearby. Market sales constantly come into the tape, but the bid volume does not run out; it either remains constant or even increases. This indicates that the buyer is absorbing all sales while accumulating a position. Similarly for shorts.
Application.
You identify a level where the order book shows a large bid, while the tape of trades is full of sells at this same price. At the same time, the price does not decline.
You enter a long from this level, since after the position accumulation is completed, an upward impulse usually follows.
Confirmation will be the moment when market sells dry up and the bid begins to move higher, or a sharp reduction in the volume of asks above it.
Stop: below the absorption level.
Mirror image: absorption on the ask side is preparation for a short.