
How to Use CME Option Levels for Forex Support and Resistance
Hello, fellow forex traders!
Exchange trading is considered easier than trading on the Forex market: technical analysis works better, there is more information online, and many very useful data points can be obtained absolutely free from exchange resources. Today we will talk about the CME exchange, which publishes data on option levels for currencies.
By the way, exchange-traded options are very different in nature from the binary options that everyone keeps talking about these days. Usually, large players use options mainly to hedge their current futures positions, although ordinary speculation is not that rare either. For any currency pair, both futures and options are available for trading. All exchange data, unlike Forex, is completely transparent: at any time you can see the number of option contracts and, by the strike price, determine the main market levels that major players are most likely watching.
In today’s article, we will take a detailed look at option levels and how to apply them in trading.
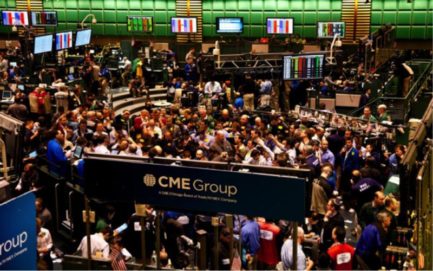

Every day the CME publishes preliminary reports, which are released at 7:45–8:40 Moscow time. The final report comes out within an hour after the start of the American session.
The data from this bulletin will allow us to calculate option levels and take them into account in our trading. An option level shows the quote at which the option seller reaches breakeven.
The full version of these daily reports is available at this and this link. The first link is an FTP archive where you can find the full bulletin as archived PDF files. The second link provides a version broken down by asset as an HTML page. The full version is quite large: it contains more than 500 pages of text and weighs about 14 megabytes, but fortunately we will not need all of that information.
When you follow the second link, you will find the bulletin split into various assets: agriculture, energy, stock indexes, interest rates, metals, real estate, currencies, and even futures and options on weather.
Let’s find the FX section for currencies and choose, for example, Japanese Yen Call Options (PG 33).
Clicking this link will open a rather confusing PDF document.
At the top of the file, the document type is shown in bold: final (FINAL) or preliminary (PRELIMINARY). In principle, either one will do for our purposes, since in practice they differ very little.
Now you need to find the beginning of the table called “JAPANESE YEN CALL Options **SETT. PRICE**”.
In the first column, you need to find the month following the current one. At the moment, that is August. Next, choose a quote either by volume or by open interest. Trading volume is the total number of all contracts, both opened and closed. Open interest is the number of only open contracts at a given quote. Therefore, it is preferable to use open interest. Let’s write down all quotes for August with sufficiently high open interest, for example above 500. I use an Excel spreadsheet for this and enter:
– the quote itself from the first column;
– the first number from the “SETT.PRICE & PT.CHGE.” column.
This is what you should get.
If we want to get a level for GBPUSD or USDCAD CALL options, we need to multiply the premium by a factor of 0.01. For yen CALL options and GBPUSD and USDCAD PUT options, nothing more is required. For yen PUT options, the premium must be multiplied by 0.0001.
Now insert another column after the first one and place there the values from the first column divided by 100,000. For currency pairs with five-digit quotes, divide the value from the first column by 1,000.
Add one more column after the Premium column and call it Level. In each cell of the new column, do the following:
– add the “Quote 2” and “Premium” columns;
– divide one by the resulting value.
For example, for the first row of my table the result will be 1/(0.00875+0.000165). For CALL options, we add the values from the “Quote 2” and “Premium” columns. For PUT options, the formula will look like this:
1/(“Quote 2” - “Premium”).
If the quote is direct (USDJPY or USDCAD), we divide by one. If the quote is inverse (GBPUSD), the formula becomes “Quote 2” - “Premium” or “Quote 2” + “Premium”. In other words, one is no longer needed.
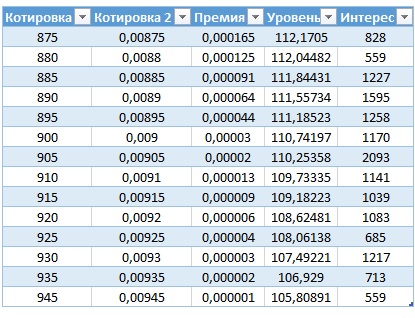
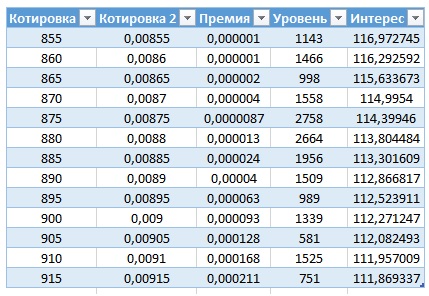
Here is the final table of levels for CALL options. Let’s repeat all the steps for PUT options (Japanese Yen Put Options – PG 34) and get the following table. After that, let’s put the resulting levels on the USDJPY H4 chart.
The greater the open interest, the thicker the level. CALL levels are shown in red, PUT levels in blue. The former show where large players are working for a rise, the latter where they are working for a decline. Let’s zoom in a little and remove the thinnest levels.
As you can see, option levels really do work as support and resistance levels, and they work quite well. Moreover, these levels are based on real options-market volumes and are followed by major players, which makes them even more valuable.
Now let’s do the same for USDCAD to reinforce the calculation method.
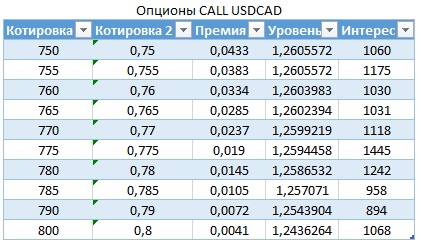
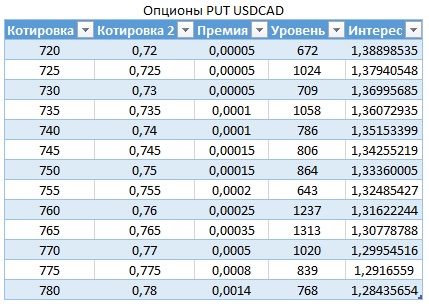
For CALL options, we write down the quotes, divide them by 1000, and write down the premium. Then we divide one by the sum of the premium and the quote. We get a table like this. For PUT options, the picture looks like this. Let’s put it on the chart.
Let’s increase the scale and remove the less significant levels.
Information is also available for the pound and the Swiss franc, the New Zealand dollar, and the Australian dollar. In addition, you can even find bulletin data on the Russian ruble or the Mexican peso, although the volumes are quite small. Data on energy products are also interesting: natural gas, oil grades Brent and WTI, gasoline, and diesel. Data are also available for the main indexes such as S&P 500, Nasdaq, and Nikkei. Metal traders will find option levels here for gold, silver, copper, iron ore, palladium, and platinum.
This level-calculation method does not take into account the so-called forward points, which adjust for interest-rate differences between currencies. As a rule, this correction is around 1-2 old points, and I believe that such an error is not significant.
Option levels can be used very well to identify support and resistance zones, as we have clearly seen. Such levels are based on real exchange data, and they matter to large players. The logic behind these levels is simple: if major traders are buying up CALL options, they are most likely hedging a short futures position in these instruments. As a result, the CALL level is a very real resistance level, while the PUT level is a support level. You always have a choice: draw levels the old-fashioned way, by eye, or “trace” them from the minds of major players. It is worth understanding that where serious money is involved, the players’ preparation is completely different. These are mostly “smart money”, but no matter how smart professional traders are, they make mistakes too.
One more interesting fact that can help in trading: if the daily CME report is not released on time, that day you should expect large volumes and, as a consequence, increased volatility.
Option levels are undoubtedly a very useful tool for any trader. In combination with fundamental and technical analysis, as well as Price Action, they can become a very powerful tool. And instead of plotting levels by eye and relying on guesswork, it is much more effective to use real market data.
Good luck and see you soon!
Best regards, Dmitry aka Silentspec
TradeLikeaPro.ru
Esli kotirovka u nas pryamaya (USDJPY ili USDCAD), to my delim na edinitsu. Esli kotirovka obratnaya (GBPUSD), formula primet vid: «Kotirovka 2» - «Premiya» ili «Kotirovka 2» + «Premiya». To est, edinitsa uzhe ne nuzhna.
Vot itogovaya tablitsa urovney po CALL optsionam:
 Povtorim vse deystviya dlya PUT optsionov (Japanese Yen Put Options - PG 34) i poluchim sleduyushchuyu tablitsu:
 Teper davayte poluchivshiesya urovni nanesem na grafik USDJPY perioda H4:
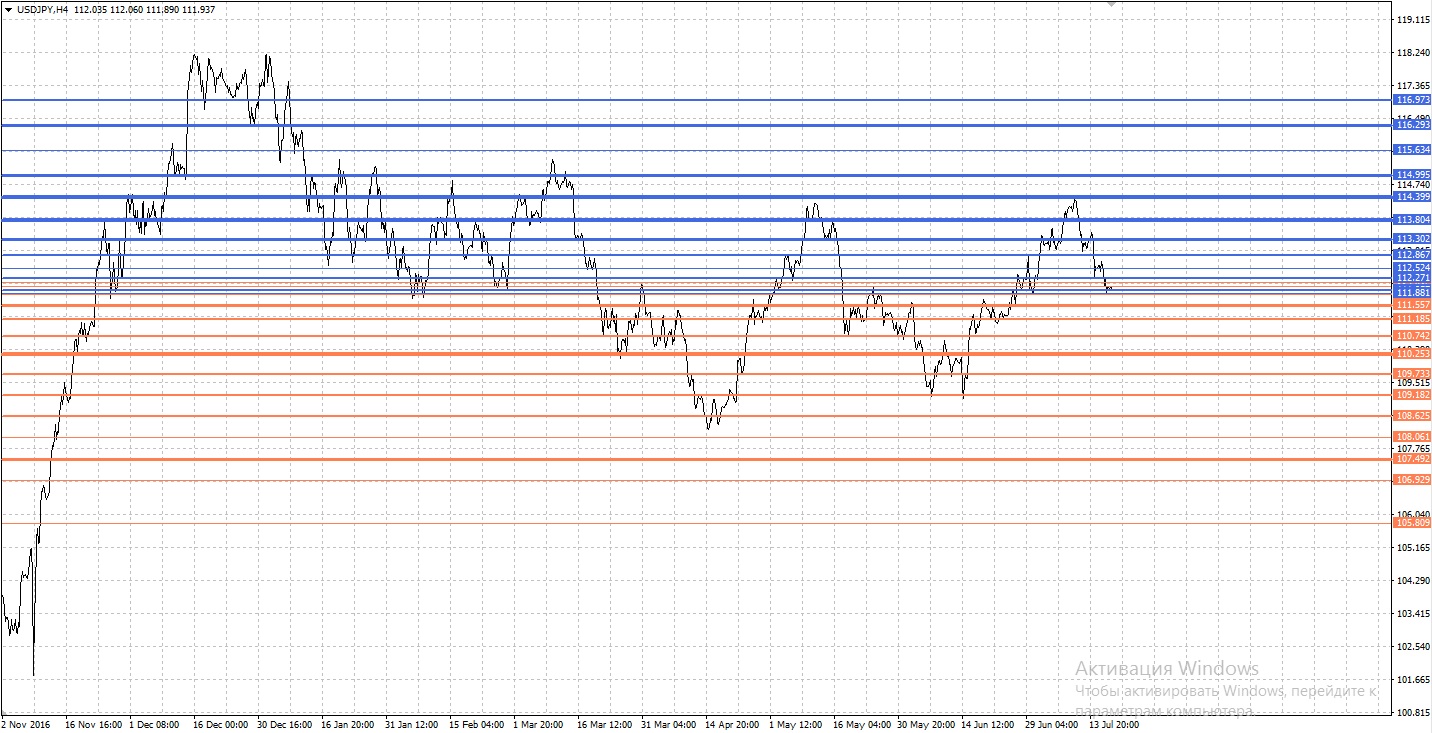 Chem bolshiy otkrytyy interes, tem uroven tolshche. Krasnym izobrazheny urovni CALL, sinim urovni PUT. Po pervym krupnye igroki rabotayut na povyshenie, po vtorym – na ponizhenie. Davayte nemnogo priblizim kartinku i udalim samye tonkie urovni:
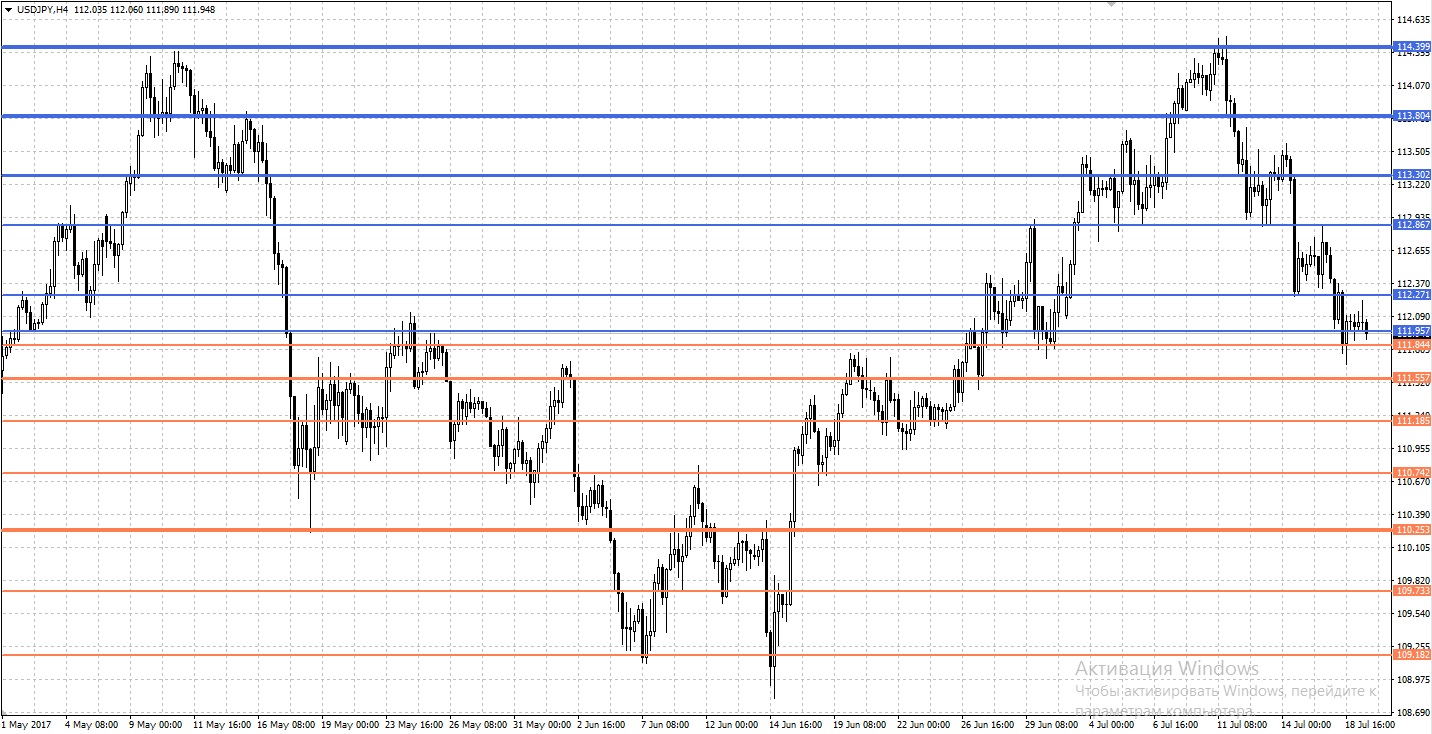 Kak vidno, optsionnye urovni – deystvitelno deystvuyut, kak urovni podderzhki i soprotivleniya, prichem rabotayut oni ochen neplokho. Bolee togo, eti urovni osnovany na realnykh obemakh rynka optsionov i za nimi sleduyut krupnye igroki, chto delaet ikh eshche tsennee.
Teper davayte sdelaem to zhe samoe dlya valyuty USDCAD, chtoby zakrepit metodiku rascheta.
Dlya CALL optsionov vypisyvaem kotirovki, delim ikh na 1000, vypisyvaem premiyu. Zatem edinitsu delim na summu premii i kotirovki. Poluchaem takuyu tablitsu:
 Po optsionam PUT kartina takaya:
 Nanesem na grafik:
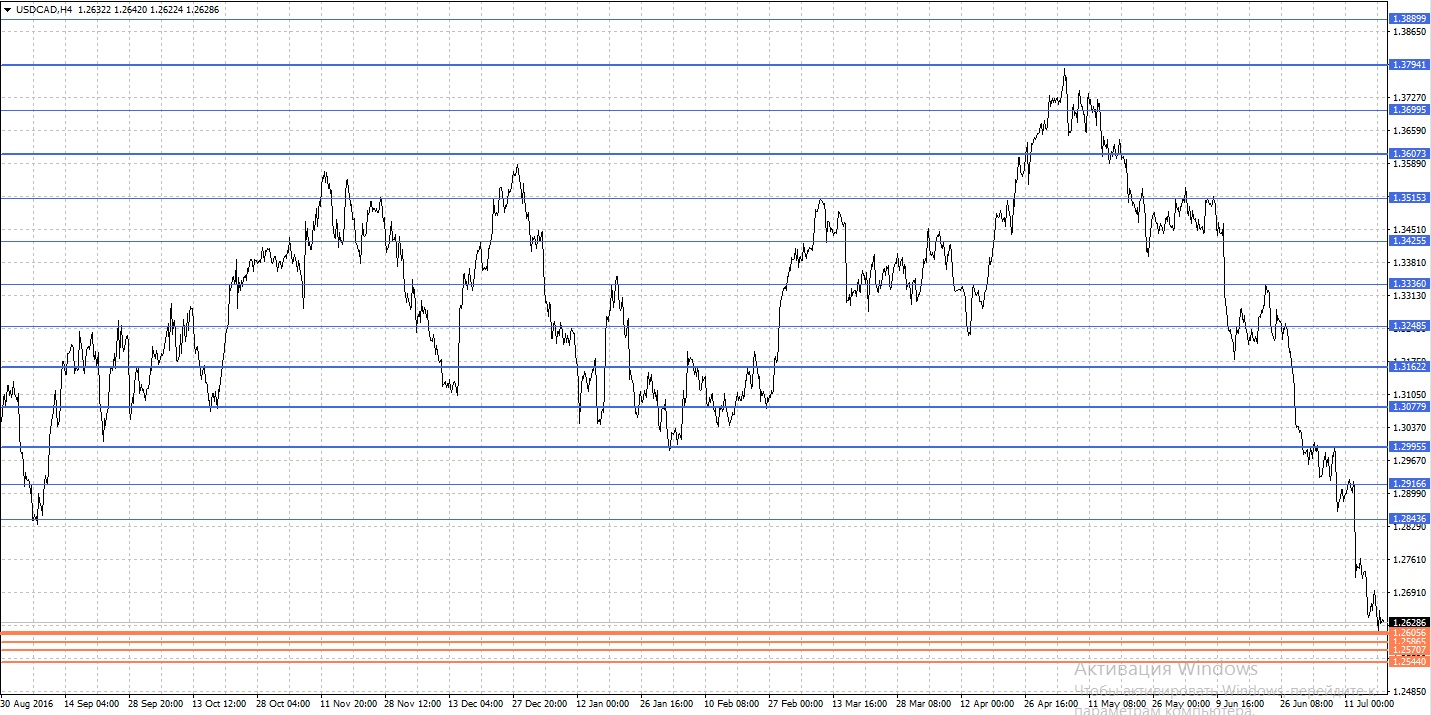 Sdelaem krupnee masshtab i uberem nesushchestvennye urovni:
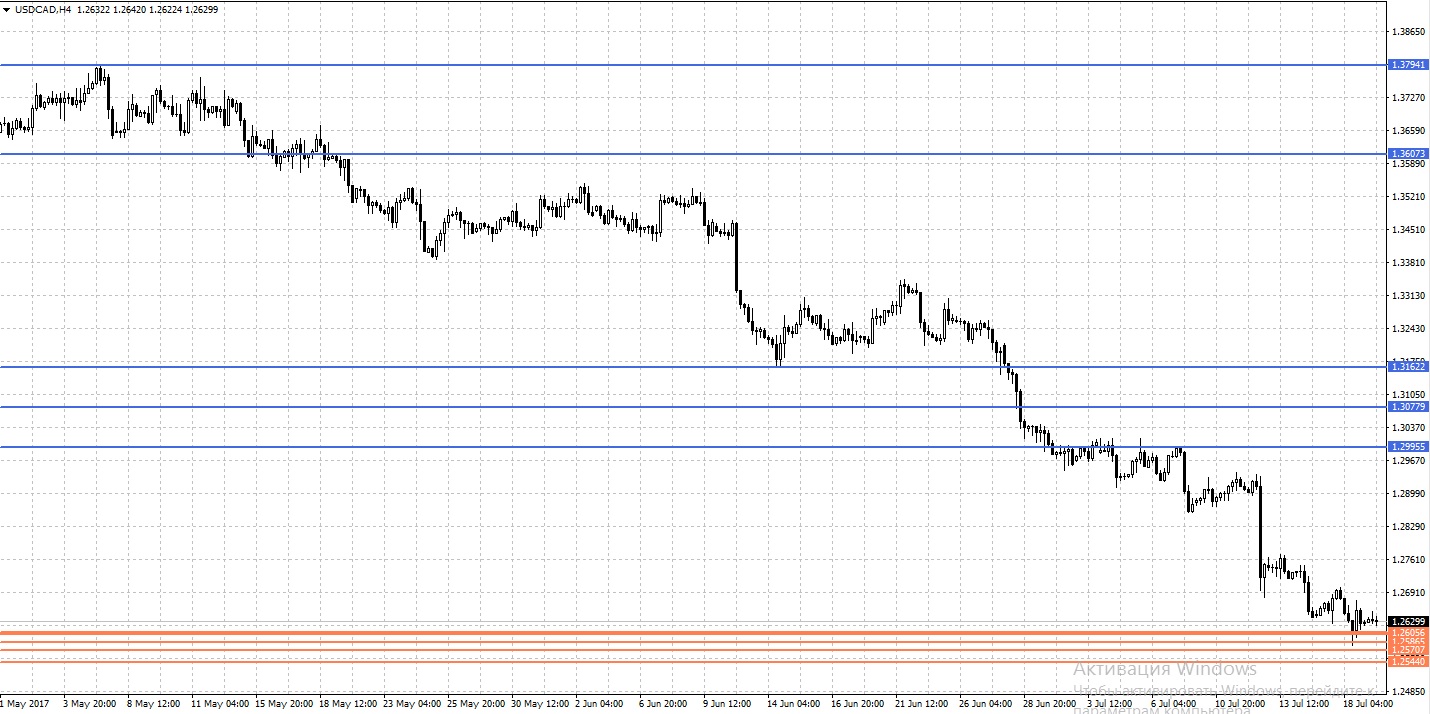 Dostupny takzhe svedeniya po funtu i shveytsarskomu franku, novozelandskomu i avstraliyskomu dollaru. Krome togo, vy dazhe mozhete nayti v byulleteni i dannye po rossiyskomu rublyu ili meksikanskomu peso, no obemy dostatochno maly. Takzhe interesny i dannye po energonositelyam, takim kak prirodnyy gaz, neft marok brent i WTI, benzin i dizel. Dostupny takzhe dannye po osnovnym indeksam, takim kak S&P 500, Nasdaq, Nikkei. Lyubiteli torgovli metallami naydut tut optsionnye urovni na zoloto, serebro, med, zheleznuyu rudu, palladiy i platinu.
Dannaya metodika rascheta urovney ne uchityvaet tak nazyvaemye forvardnye punkty, kotorye delayut popravku na raznitsu po protsentnym stavkam dlya razlichnykh valyut. Kak pravilo, eta popravka vykhodit v rayone 1-2 starykh punktov i ya schitayu, chto podobnaya pogreshnost ne yavlyaetsya sushchestvennoy.
Chem polezny optsionnye urovni

Optsionnye urovni prekrasno mozhno primenyat dlya opredeleniya zon podderzhki i soprotivleniya, v chem my prekrasno ubedilis. Takie urovni budut osnovany na realnykh birzhevykh dannykh, i oni interesny krupnym igrokam. Logika raboty etikh urovney prosta: esli krupnye torgovtsy razbirayut CALL optsiony, to, skoree vsego, takim obrazom khedzhiruetsya korotkaya pozitsiya na fyuchersakh po etim instrumentam. V rezultate uroven CALL – eto vpolne realnyy uroven soprotivleniya, togda kak uroven PUT yavlyaetsya urovnem podderzhki. U vas vsegda est vybor – risovat urovni po starinke, na glaz, libo zhe «srisovat» ikh iz golovy krupnykh igrokov. Stoit ponimat, chto tam, gde krutyatsya sereznye dengi, i podgotovka igrokov sovershenno drugaya. Eto po bolshey chasti «umnye dengi», no naskolko umnymi by ni byli professionalnye torgovtsy, inogda oshibayutsya i oni.
Eshche odin interesnyy fakt, kotoryy mozhet pomoch v torgovle: esli ezhednevnyy otchet CME ne vykhodit v srok, v etot den stoit ozhidat bolshie obemy, i, kak sledstvie, povyshennuyu volatilnost.
Zaklyuchenie

Optsionnye urovni, nesomnenno, ochen poleznyy instrument dlya lyubogo treydera. V sochetanii s fundamentalnym i tekhnicheskim analizom, a takzhe Price Action, on mozhet prevratitsya v ochen moshchnyy instrument. I vmesto togo, chtoby nanosit urovni na glaz, rukovodstvuyas dogadkami, gorazdo effektivney ispolzovat realnye rynochnye dannye.
Uspekhov i do novykh vstrech!
S uvazheniem, Dmitriy aka Silentspec TradeLikeaPro.ru
