
Optimizing Expert Advisors in MetaTrader 5

The MetaTrader 5 trading platform until recently was not at all popular among forex traders. And all because it was originally tailored for exchange trading with netting position accounting, that is, for one financial instrument it was possible to have only one position, and all further operations on it led to a change in the volume of the open position, the closing or reversal of the existing position. Consequently, the trader had no opportunity to trade grids, add to positions, use locks, and apply other similar position management methods.
But in March of this year the situation changed radically: a second accounting system was finally added to the platform, hedging. The very same system used in the fourth version of the terminal. Now it is possible to have many positions on one instrument, including positions in opposite directions. So, all the shortcomings that previously repelled forex traders from the MetaTrader 5 platform have been removed, and the time has come to take a closer look at it. Does using the fifth platform provide any advantages when optimizing trading expert advisors? Should fans of automated trading switch to the new platform, or is it better to stay with the good old MT4? Today we will learn how to optimize expert advisors on the MetaTrader 5 platform and look at the main advantages and disadvantages of optimizing advisors with it.
Optimizing Expert Advisors

We already covered how to test expert advisors and what testing modes exist in MT5 in the previous article. You also already know how to install expert advisors in the terminal. Therefore, let us move directly to the main topic of this article, the optimization of trading experts in the MT5 platform.
The essence of optimization comes down to selecting the optimal parameters for the operation of an expert advisor on a certain segment of historical data. At the same time, after optimization is completed, the strategy tester produces a large list of various successful options, from which the trader chooses the best one.
The strategy tester in MT5 is multithreaded and makes it possible to use all available computer resources. Testing and optimization are carried out using special computing agents that work independently and allow parallel calculations of optimization passes. An unlimited number of remotely operating agents can be connected to the strategy tester. In addition, the tester provides access to the enormous MQL5 Cloud Network of cloud computing. It unites thousands of agents around the world, and this computing power is available to any user of the trading platform.
Preparing for Optimization

The tester makes it possible to check on history strategies that trade several instruments. Such experts are conventionally called multicurrency. The history for the instruments used is downloaded by the tester from the trading platform, not from the trading server, automatically on the first access to a given instrument. Only the missing history is additionally downloaded from the trading server. Thus, testing and optimization of expert advisors mainly use history specially prepared by MetaQuotes, and not the real quote history of a specific broker.
Before starting optimization of a multicurrency expert, enable the instruments required for testing in the "Market Watch." In the context menu, run the " Symbols" command and enable the display of the required instruments.
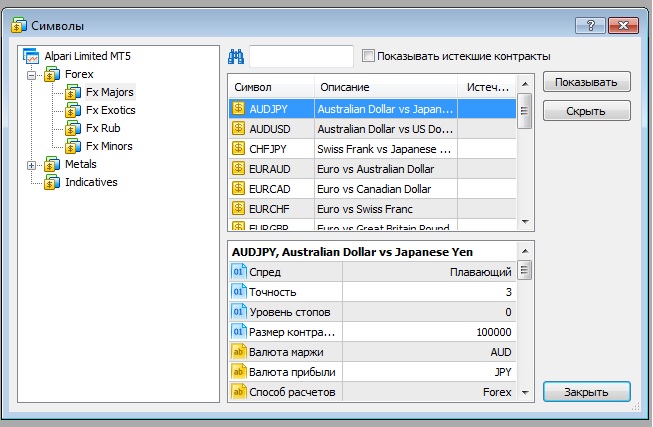
Choosing optimization settings
Before starting optimization, choose on which financial instrument the study of the expert advisor's operation will be carried out, for what period, and in which mode.
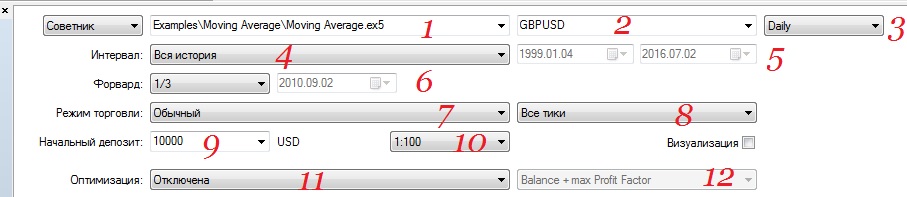
- Choose the expert advisor that needs to be optimized.
- Choose the currency pair on which the optimization will be carried out. For multicurrency expert advisors, this is the pair on whose chart the advisor will be attached.
- The timeframe for the advisor to operate on. As you already know, many additional periods have appeared in MT5, and on each of them you can test and optimize an expert advisor. And although the usefulness of the appearance of such periods as M3, M12, or H2 is rather doubtful, it is pleasing that now you can test long-term expert advisors on the W1 or MN periods.
- Choosing the interval for optimization:
When choosing "entire history," optimization will run on the entire available quote history. The next two intervals, of course, are completely useless.
- You can also set explicit start and end dates for the optimization period ("period selection").
A special feature of the tester is that it loads some additional data before the specified period, to form at least 100 bars. For example, when testing on the weekly timeframe, two additional years are loaded. This is necessary for more accurate testing and optimization, because the indicators used by the expert advisor are built on this history, for example. If at the same time there is not enough historical data to form the additional 100 bars, for weekly and monthly periods for example, the test start date will be shifted automatically, and a corresponding entry will appear in the strategy tester log.
- Forward.
We all know how sad it was to filter runs in the fourth terminal, manually running forward tests hundreds and thousands of times for each optimization. The gods took pity on us, and MetaQuotes descended to the needs of ordinary traders. Now runs during optimization are filtered out automatically if they do not pass forward tests. We have a choice: to use half of the allocated history, a third, or a quarter for the forward test. There is also an option to specify a particular start date for the forward test period yourself. The results of the best runs during optimization on both periods can then be compared on the "Optimization Results" and "Forward Testing Results" tabs. Backward testing, unfortunately, still has to be run manually. And nevertheless, this is a big step forward.
- Trading mode
At the moment, two trading modes are provided: "Normal" and "Random Delay". In normal mode, all orders are executed at the requested prices, there are no requotes, etc. That is, the same as in the fourth terminal (ideal execution).
The random delay mode is intended for testing expert advisors in conditions close to real ones. From the moment the order is sent until it is executed, the price may change. Depending on the deviation (Slippage) set in the order, it may be executed at the current price (if it is within the deviation) or requoted. Testing in this mode allows the developer to correctly program the handling of such situations and also brings advisor tests closer to real conditions. Delay simulation is applied to all trade requests sent from the terminal (placing orders, changing stop levels, etc.). The execution delay works according to the following principle: a number from 0 to 9 is selected at random, and the execution is delayed by that many seconds; if the selected number is 9, then another number from the same range is selected at random and added to the first. Thus, the probability of an execution delay of 0-8 seconds is 90%, and the probability of a delay of 9-18 seconds is 10%.
- Tick generation mode
You can choose one of the tick generation modes:
- Every tick is the most accurate, but also the slowest modeling mode. In it, all ticks are modeled.
- Every tick based on real ticks is the mode closest to real conditions. It uses real ticks accumulated by the broker for financial instruments. No modeling is performed. Tick data is large in size, and when testing is run for the first time, downloading it from the broker's server may take a long time.
- OHLC on M1 means that in this mode only 4 prices of each minute bar are modeled: Open, High, Low, and Close prices.
- Open prices only means that OHLC prices are also modeled in this mode, but only the opening price is used for testing/optimization.
- Mathematical calculations means that in this mode the tester will not download historical data, information about symbols, and will not generate ticks. Only the OnInit(), OnTester(), and OnDeinit() functions will be called. Thus, the tester can be used for various mathematical calculations where parameter selection is required.
- Initial deposit
Specify the size of the initial deposit for testing and optimization of the expert advisor. The currency depends on the deposit currency of the account that is currently connected.
- Leverage.
Select the leverage for testing and optimization. This is especially relevant for grid traders and martingale systems.
- Optimization
In the "Settings" tab of the Strategy Tester, we are interested only in the Optimization line (you are already familiar with all the other functions). The Strategy Tester provides two optimization modes.
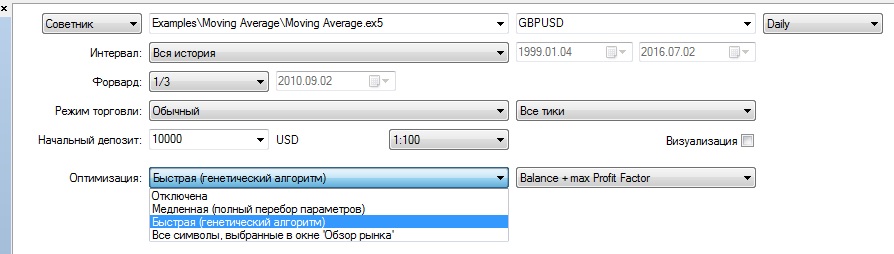
Disabled means parameter optimization is turned off, and work proceeds in Strategy Tester mode.
Slow (full parameter search). In this mode, the tester goes through all possible combinations of the expert advisor parameters selected for optimization on the corresponding tab:

This method is the most accurate, but running the advisor with all parameter combinations can take too much time.
Fast (genetic algorithm). This type of optimization uses a genetic algorithm to select the best parameter values. It is much faster than a full parameter search and is not much inferior to it in quality. Optimization by full search, which would take several years, is completed in a few hours when using a genetic algorithm. Despite the fact that this function is also present in MT4, I will still say a few words about how the genetic algorithm works.
Each individual has a certain set of genes that corresponds to the set of its parameters. Genetic optimization is based on the constant selection of the fittest parameters, that is, the values that give the best final result.
In general form, the algorithm can be represented as follows:
- Out of the total number of possible parameter combinations, two populations (sets) are selected at random.
- Both sets are tested, and only one set is retained, the one that has the best results according to the optimization criterion.
- The members of this set are randomly crossed with each other, undergoing random mutations and parameter inversions.
- The offspring are sorted by the best results and the crossing is repeated.
- Sorting and crossing operations continue as long as there is an improvement in the results, that is, when the best result among the offspring exceeds the best result among the parents. To stop optimization, there must be no improvement in the optimization criterion over several crossings, that is, generations.
After genetic optimization is started, the "Settings" tab shows the estimated number of upcoming testing passes. If the total number of optimization steps exceeds 1 000 000 on a 32-bit system or 100 000 000 on a 64-bit system, fast optimization mode is enabled automatically.
Intermediate results are saved in the cache after each generation is calculated (file platform_data_folder/tester/cache/*.gen). Thus, the genetic optimization process can be interrupted at any time. Even if the genetic optimization process is interrupted for external reasons, for example a power outage, optimization will automatically continue from the last calculated generation the next time it is launched. The genetic optimization cache is stored until the optimization settings are changed or until the optimization process is fully completed. When optimization is stopped normally, with the "Stop" button, all previously calculated passes are saved. When optimization is resumed, the process will continue from where it stopped.
All symbols selected in the "Market Watch" window. Unlike the previous two, this optimization mode makes it possible to test the expert advisor with the same input parameters but on different symbols. At each optimization pass, only the main symbol used for testing the advisor changes. Optimization is performed only on the symbols that are currently selected in the "Market Watch" window. Thus, by adjusting the set of selected symbols, you can control optimization. Downloading the required price data from the server may take a long time, but this happens only the first time it is launched on a symbol; afterward, only the missing data is downloaded. When optimizing by symbols, the current values of the input parameters specified in the "Value" column are used.
- Optimization criterion
This indicator is selected in the "Settings" tab to the right of the "Optimization" field. The optimization criterion is needed only for the genetic algorithm. The following optimization criteria are available:
Maximum balance: the optimization criterion is the maximum balance value.
Balance + maximum profitability: the criterion is the maximum value of the product of balance and profitability.
Balance + maximum expected payoff: the criterion is the product of balance and expected payoff.
Balance + minimum drawdown: in this case, in addition to the balance value, the drawdown level is taken into account: Balance/Equity Drawdown.
Balance + maximum recovery factor: the criterion is the product of balance and the recovery factor.
Balance + maximum Sharpe ratio: the criterion is the product of balance and the Sharpe ratio.
Custom optimization criterion: when this parameter is selected, the value of the OnTester() function in the expert advisor will be used as the optimization criterion. This parameter allows the user to use any custom metric for optimization.
Selecting input parameters for optimization

Input parameters make it possible to control the behavior of the expert advisor, adapting it to different market conditions, including a specific financial instrument. For example, you can study how the expert advisor performs with different stop-loss and take-profit order distances, with different periods of the moving average used for market analysis and decision-making, etc.
Optimization consists of trying different values and combinations of input parameters to obtain the best result.
To enable optimization for a parameter, check its box. Then specify the start and end of the value range, as well as the increment. You can select one or several parameters. The total number of possible combinations will be shown below the parameter list.
Starting optimization

To start optimization, click "Start" on the "Settings" tab. Its progress will be shown to the left.
Detailed results for each pass are displayed on the "Optimization" tab. It presents general testing results, such as profit and the number of trading operations, as well as many statistical indicators that will help evaluate the quality of the robot's work.
Detailed information about the indicators is provided in the "Testing Report" section. The optimization report can be sorted by any parameter by clicking the column header. This way, you can find the most profitable parameter combination and immediately run a single test for it to get a more detailed report.
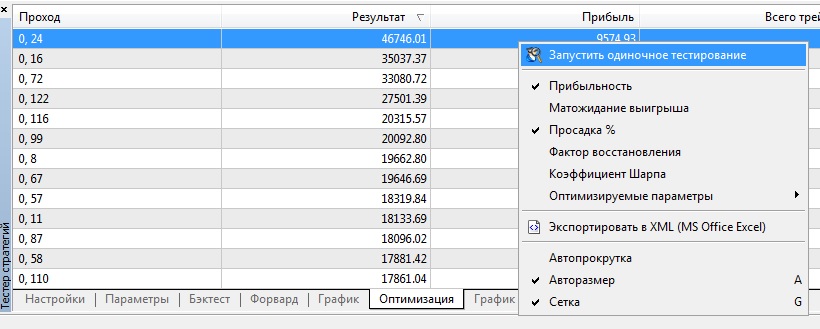
The following indicators are displayed for each optimization pass:
Pass: the pass number.
Result: the final value of the parameter that serves as the optimization criterion by which the best passes are selected.
Profit: the profit/loss obtained as a result of the pass.
Total trades: the total number of trades (transactions that resulted in a profit or loss being fixed) executed during this pass.
Profitability: the ratio of total profit to total loss as a percentage. A value of one means that the sum of profits equals the sum of losses.
Expected payoff is this statistically calculated indicator reflects the average profitability/loss of a single trade.
Drawdown is the relative drawdown of funds, the greatest loss in percent from the maximum value of funds. Withdrawal of funds by the advisor during optimization is taken into account when calculating the drawdown.
Recovery factor is this indicator displays the riskiness of the strategy
Sharpe ratio is this indicator characterizes the efficiency and stability of the strategy. It displays the ratio of the arithmetic mean profit during the position holding time to its standard deviation. In addition, the value of the risk-free rate is taken into account here, which is the profit from depositing the corresponding amount in a bank deposit.
Optimized parameter(s) is in addition to the general statistical indicators, the values of the input variables set for this pass are displayed here.
Using the context menu commands, you can hide/show some of the above-mentioned columns.
If the optimization was carried out with forward testing, then this tab displays the corresponding values of the optimization parameter (optimization criterion) for the backtest and the forward test. Switching between the result viewing modes for testing and forward testing is performed using the context menu. Double-clicking the left mouse button on one of the optimization results starts testing the advisor with the parameters of this run (provided that the optimization is finished).
During genetic optimization, a situation is possible where the next pass (population member) has absolutely identical input parameters (genes) to a previously tested pass. In this case, this pass is not displayed on the results tab, since it has an identical testing result.
For analysis in third-party programs, for example, in Excel, the optimization report can be saved as a file with the command "Export to XML" in the context menu. Also, the numerical values of all parameters and characteristics obtained as a result of optimization, upon its completion, are saved to an XML file located in the folder platform_data_folder/tester/cache/. The file is assigned a name according to the following rule: ExpertName.Symbol.Period.GenerationMode.xml. Here:
ExpertName is the name of the expert being optimized.
Symbol is the symbol.
Period is the timeframe (M1,H1,...).
GenerationMode is the tick generation mode (0 is "Every tick", 1 is "OHLC on M1", 2 is "Open prices only").
During genetic optimization, intermediate results are saved in the cache after the calculation of each generation (file platform_data_folder/tester/cache/*.gen). Thus, the genetic optimization process can be interrupted at any moment. Even if the genetic optimization process is interrupted due to external reasons (for example, a power outage), the optimization will be automatically continued from the last calculated generation at the next launch. The genetic optimization cache is stored until the optimization settings are changed or until the optimization process is completed. When optimization is stopped normally (with the "Stop" button), all previously calculated passes are saved. When optimization is resumed, the process will continue from the stopping point.
Visual presentation of optimization results

The strategy tester in the trading platform has a powerful visualization system for optimization results. On the "Optimization Graph" tab, several types of graphs are available, and you can switch between them through the context menu.
Zero line (plane)
On all types of graphs, except the flat one, a zero line is displayed (or a plane, in the case of a three-dimensional graph). If the balance value is used as the optimization criterion, this line denotes the amount of the initial deposit, thus allowing loss-making passes to be visually separated from profitable ones. In all other cases, this line is drawn at the zero value of the optimization criterion.
Graph with results and Linear Graph (1D)
The graph with optimization results opens by default. Each expert pass with certain input parameters is displayed on the graph as a point. The pass number is plotted on the horizontal axis of the graph, and the values of the parameter that is the optimization criterion are plotted on the vertical axis.
The linear graph (1D) shows the change in the parameter that is the optimization criterion (vertical axis) depending on one of the optimized parameters selected for display on the horizontal axis. To select a parameter for display on the horizontal axis, use the "X Axis" command in the context menu.
Flat Graph (2D) and Volumetric Graph (3D)

In the two-dimensional display mode, changes in the selected parameters by which the optimization was carried out are plotted on both axes. The change in the optimization criterion is displayed using a color gradient. The more saturated the color, the higher the value of the optimization criterion.

In the three-dimensional viewing mode, changes in the selected parameters that were used during optimization are plotted along the X and Y axes. Changes in the optimization criterion are displayed on the vertical Z axis, as well as by means of a color gradient.
To select the parameters to display on the horizontal and vertical axes, use the "X Axis" and "Y Axis" commands in the context menu.
Controls for the 3D graph:
G - turn the coordinate grid on/off
Space - switch between solid fill and line fill
Up/down/left/right arrows - move the graph
Plus/minus - zoom in/out of the graph
Home, Page Up, Page Dn, End - rotate the graph
Conclusion

The tools available to users of the MT5 terminal have indeed become more convenient and better thought out compared with the previous version of the terminal. Optimizing expert advisors has become a simpler and at the same time more precise task. Personally, I was greatly inspired by two innovations: the ability during optimization to automatically discard runs that did not pass forward tests, and the presence of a 3D optimization graph, by which it is not difficult at all to find the most stable and profitable sets by the peak points of the 3D plane.
Sincerely, Dmitry aka Silentspec TradeLikeaPro.ru
