
On Balance Volume Indicator

The On Balance Volume (OBV) indicator is one of the earliest tools of VSA (Volume Spread Analysis), the analysis of price movement together with trading volumes. It was created in 1963 by the popular analyst of that time, Joe Granville.
The creator of OBV gained recognition in the stock market thanks to accurate forecasts published in his own newsletter and books on technical analysis, one of which described the indicator formula. Today we will get to know this indicator in more detail.
Indicator Characteristics
Platform: Metatrader and terminals containing the indicator
Currency pairs: any instruments, preferably major pairs and cross rates
Timeframe: any, preferably D1
Trading time: around the clock
Recommended brokers: Alpari, Forex4You, TickMill

Joseph Granville proposed taking volume on the available trading history into account, thus creating a complete picture of the market. The role of price in the OBV formula was reduced to determining the sign before the trading turnover figure. A negative daily close defined trading volume as a negative number, while a rising daily candle retained its positive value.
The indicator was widely used in the stock market and was passed down "by inheritance" to Forex, partly thanks to Jack Schwager, who mentioned Joe Granville in the "Market Wizards" book series. This gave OBV a "second wind" in the 90s, and the indicator entered the package of standard technical analysis tools of the Metatrader 4 platform.
The popularity of the platform spread On Balance Volume to the trading terminals created after it. The indicator is currently used to predict reversals in advance or confirm trends.
Description of How the Indicator Works

Joseph Granville wrote down the results of daily trading as an endless numerical series of positive numbers for a candle that closed above the open, and negative numbers if by the end of the day the price was below the opening level of the session. Then the author continuously summed the results obtained:
OBV= ∑ k*Volume,
where the coefficient k determined the +/- sign by the position of the candle's closing price.
As can be seen from the formula, the indicator curve can take positive and negative values during prolonged trends, indicating the global market tendency at the current moment. OBV has no period, applying "through" summation that shows the cumulative volume value.
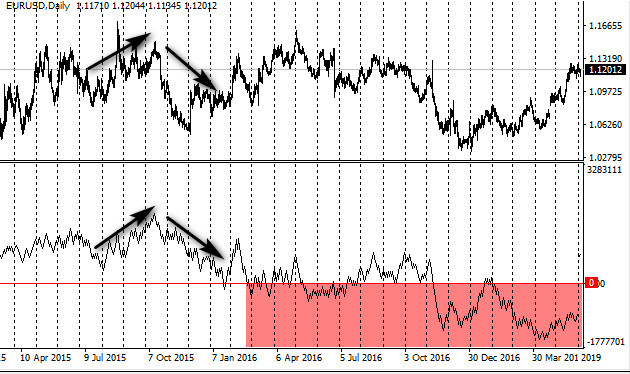
The figure above demonstrates a high level of correlation between the trends of the indicator and the asset quotes; this is another useful factor that simplifies technical analysis.
A regular volume histogram can grow when the rate falls or rises, making it harder to search for divergence signals when the trend is not confirmed by the activity of market participants. The correlation of OBV with the chart instantly displays the market picture, visually confirming or disproving both types of price trend.
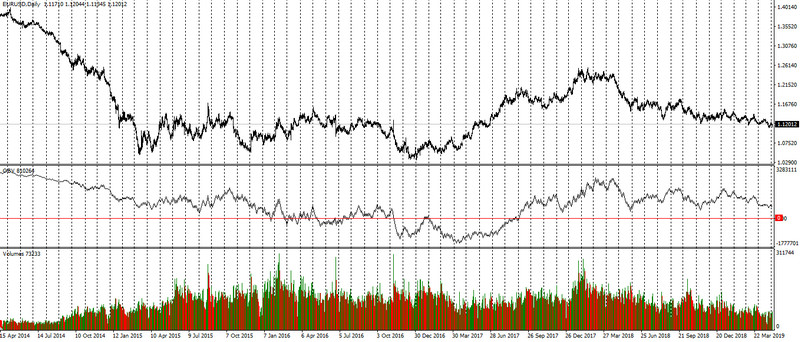
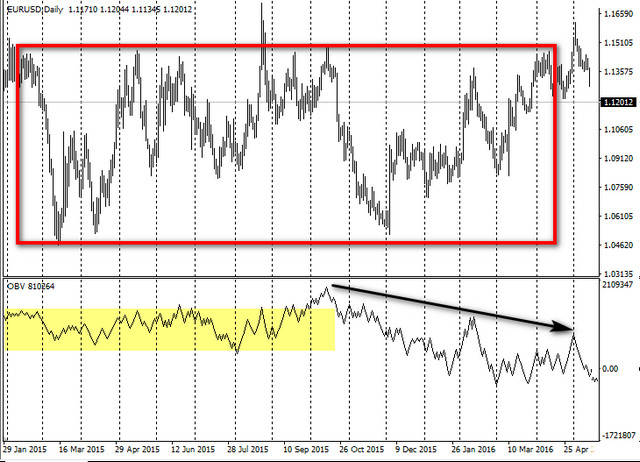
This quality becomes especially important in the most difficult parts of trading, namely the flat, where uncertainty brings the trader the greatest number of losses. Volume analysis allows hidden movement to be identified and the trend to be forecast correctly.
The OBV formula does not take into account the daily trading volume on cross candles whose price closes at the opening level of the session.
Using the Indicator in Trading

Divergences of OBV are one of the signals most widely noted by analysts. The classic version of using divergences between price trends and the indicator is described on thematic resources and in encyclopedias. It means that a rising or falling trend in quotes, not confirmed by the highs or lows of On Balance Volume, is interpreted as an upcoming price correction.
In the Forex market, this strategy works the other way around. OBV divergences confirmed by the first extremes of the discrepancy confirm the current trend. The picture shows how the market decline occurs while strong OBV demand remains. High volumes should show that market participants are ready to continue buying, but soon the downward trend ends with a major drop.
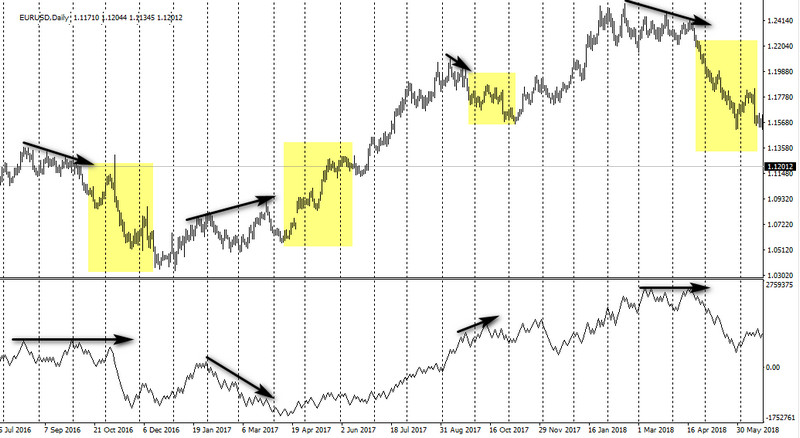
Next it can be seen how volumes continue to fall, but the currency pair has reversed and continues to set new highs. Despite the "absence" of buyers according to OBV, EURUSD quotes show a strong impulse.
The story repeats itself at a new market peak: high On Balance Volume readings on a falling trend lead to a sharp collapse in the rate. This proves that all OBV divergences confirm a high probability of the established price trend.
On Balance Volume clearly shows the classic "crowd mistake." If the majority of traders play the role of bulls, then large players are ready to crash the market in order to profit from stop losses.
The classic strategy for using the indicator consists of trading on trend confirmation. As already noted above, the OBV formula "ties" the curve to the exchange rate of the currency pair. Traders make trades:
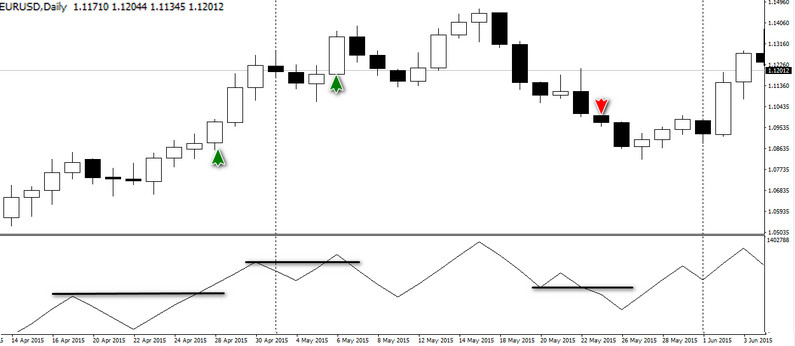
Countertrend signals on the trading indicator are given by support and resistance lines, determined by principles similar to the graphical analysis of price:
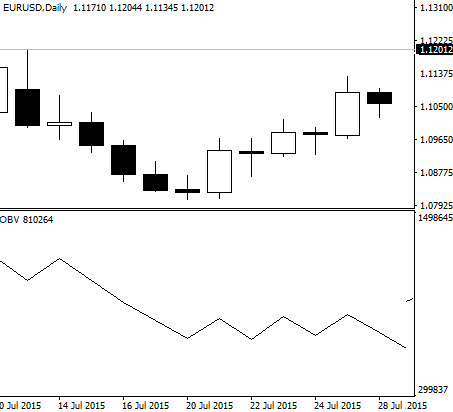
The strategy's money management is based on stop-losses placed beyond the daily candle's low or high, not exceeding 100 points, but no less than 50 points for the major currency pairs. Profit is taken:
Description of the Settings

The On Balance Volume indicator is located in the "Volumes" section, the "Indicators" option, of the "Insert" menu in the Metatrader 4 and 5 trading platform.
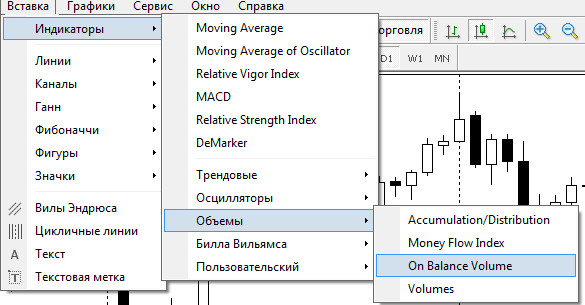
The indicator settings window contains virtually no parameters capable of affecting the calculations, apart from changing the reference points by selecting prices: close, open, high, or low. In the classic version, Joe Granville recalculated the indicator at each daily candle close.
The "Levels" tab plays a technical role; the trader can mark historical highs and lows of On Balance Volume readings to take them into account when the level is broken or the trend corrects.
Conclusion

The cumulative OBV volume system, with multiplication by positive and negative coefficients, significantly "simplifies" quote fluctuations while preserving the trend direction that matches the market. The indicator is recommended for beginners who are starting to work with VSA theory or have difficulty determining the direction of the asset's current movement.
Another advantage of OBV for beginner traders is that the indicator has practically no settings, so it does not require searching for and selecting parameters. When applying the curve in technical analysis, it should be kept in mind that the market is difficult to assess with a single tool. A currency speculator should use On Balance Volume in trading systems together with chart patterns or other indicators.
Sincerely, Alexey Vergunov
Tlap.io
