
NVT Indicator - Identifying Bitcoin Bubbles

Hello, trader friends!
Every day all you hear about are new highs in the price of Bitcoin and that all of this is a bubble and it will soon burst. Grandmothers on benches listen to plump deputies on TV, while we will try to approach the issue from a practical point of view, because after all, we are traders.
Using the special NVT indicator, which evaluates the current price, market capitalization, and transaction volume in the blockchain, we will be able to identify moments of inadequate Bitcoin value and profit from it.
Following the exponentially growing hype, the market often misses the moment of a fair price, when it should stop growing and take a breather. It turns out that growing demand generates even greater demand, and the bubble inflates. Sooner or later, the moment of the “bubble collapse” arrives, when investors realize the mistake and begin to actively get rid of the asset, after which sharp growth is replaced by an even sharper fall.
For a trader, a market bubble is an opportunity to make good money. The main thing is to determine the beginning and the end of the bubble in order to enter the market or manage to bet on a decline. For the cryptocurrency market, and Bitcoin in particular, this is currently most relevant, since it is very difficult to determine the real value of a new payment system, as evidenced by the volatility that is quite atypical for traditional currencies.
The NVT indicator is intended to solve this problem by helping assess the stages of overbought/oversold conditions and thereby predict the collapse of the next Bitcoin bubble. Today it is in our review.
Indicator Characteristics
Platform: web
Currency pairs: BTCUSD
Timeframe: any
Trading time: any
Indicator type: overbought/oversold gauge
Recommended brokers: Amarkets, RoboForex
What PE Is in Stocks
 In the stock market, the price-to-earnings ratio is used, which is calculated as the market value of a company's shares divided by the earnings per share (P / E). This parameter makes it possible to determine the fair value of shares, that is, how greatly the shares are overvalued or, conversely, undervalued relative to the main financial indicator, earnings.
As a rule, investing in assets with a low PE ratio is a good investment, since this most often indicates high growth potential. For example, let us try to use PE to calculate the fair price of the shares of three companies united by one industry: A, B, and C.
| Company | Share price | Earnings per share | PE |
| A | 100$ | 2$ | 50 |
| B | 50$ | 2$ | 25 |
| C | 200$ | 10$ | 20 |
To calculate the fair value of company A, first we need to determine the average PE across the entire industry and then obtain the share price value from the P / E formula. So, the average PE is approximately 32$. Now multiply the resulting PE by the earnings per share: 32 * 2 = 64$, and this is the fair value of company A's shares, which is much lower than the current market price. On the contrary, company C is heavily undervalued, having a fair share value equal to 320$ (32 * 10).
How the Indicator Works

You can find the NVT indicator at -> http://charts.woobull.com/bitcoin-nvt-ratio/
The author of the NVT indicator, under the pseudonym Willy Woo, is an engineer by education and in recent years has been researching cryptocurrency markets. He also took part in the development of the Exodus Wallet multi-currency crypto wallet project. In addition to NVT, the author's site contains several more indicators of his own design.
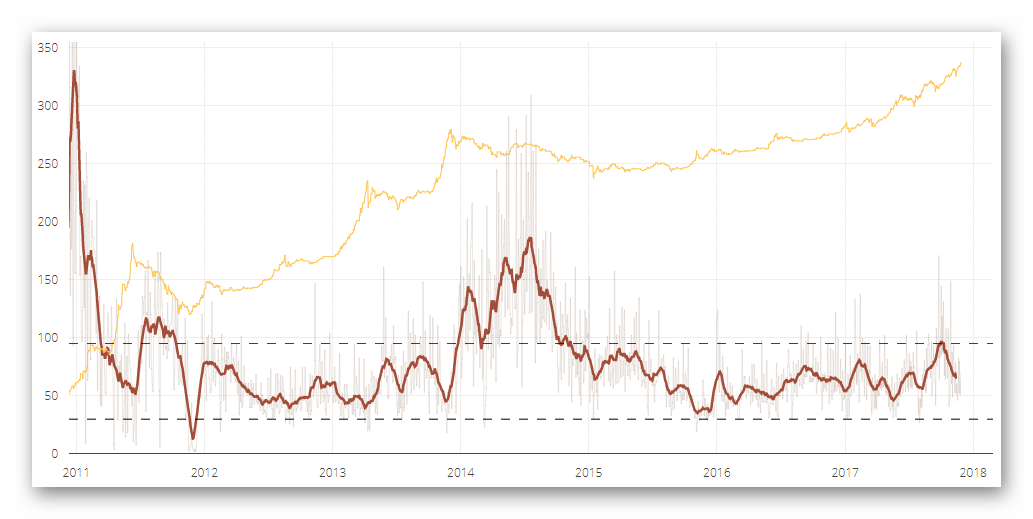 Network capitalization is the yellow line, the NVT ratio is the gray line, and smoothed NVT is the red line.
The idea of NVT is an analogue of the PE indicator for the cryptocurrency market, previously known to us from the stock markets. Such an indicator, in theory, should solve one important problem of the crypto market: the problem of assessing the true value of virtual currency. However, the original formula uses earnings per share, so we cannot transfer it literally, because Bitcoin has no concept of earnings as such. Since we cannot transfer it, we need to replace it. We cannot calculate earnings, but we can calculate the amount of money flowing through the Bitcoin network. The final formula looks like this:
Bitcoin market capitalization / Transaction volume passing through the blockchain (in USD)
Bitcoin market capitalization is calculated as the total number of tokens in circulation multiplied by the volume-weighted average price. Data on dollar turnover is taken from Blockchain.info and is estimative in nature.
How to Work with the Indicator
 Considering that NVT is a kind of analogue of the PE ratio, it can be interpreted in a similar way. First, if the gray line (the unsmoothed ratio) is near the lower line of the channel, we can say that the current price of Bitcoin is undervalued and there is potential for further growth. On the contrary, if the gray line goes beyond the upper boundary, it is worth temporarily refraining from purchases and staying alert.
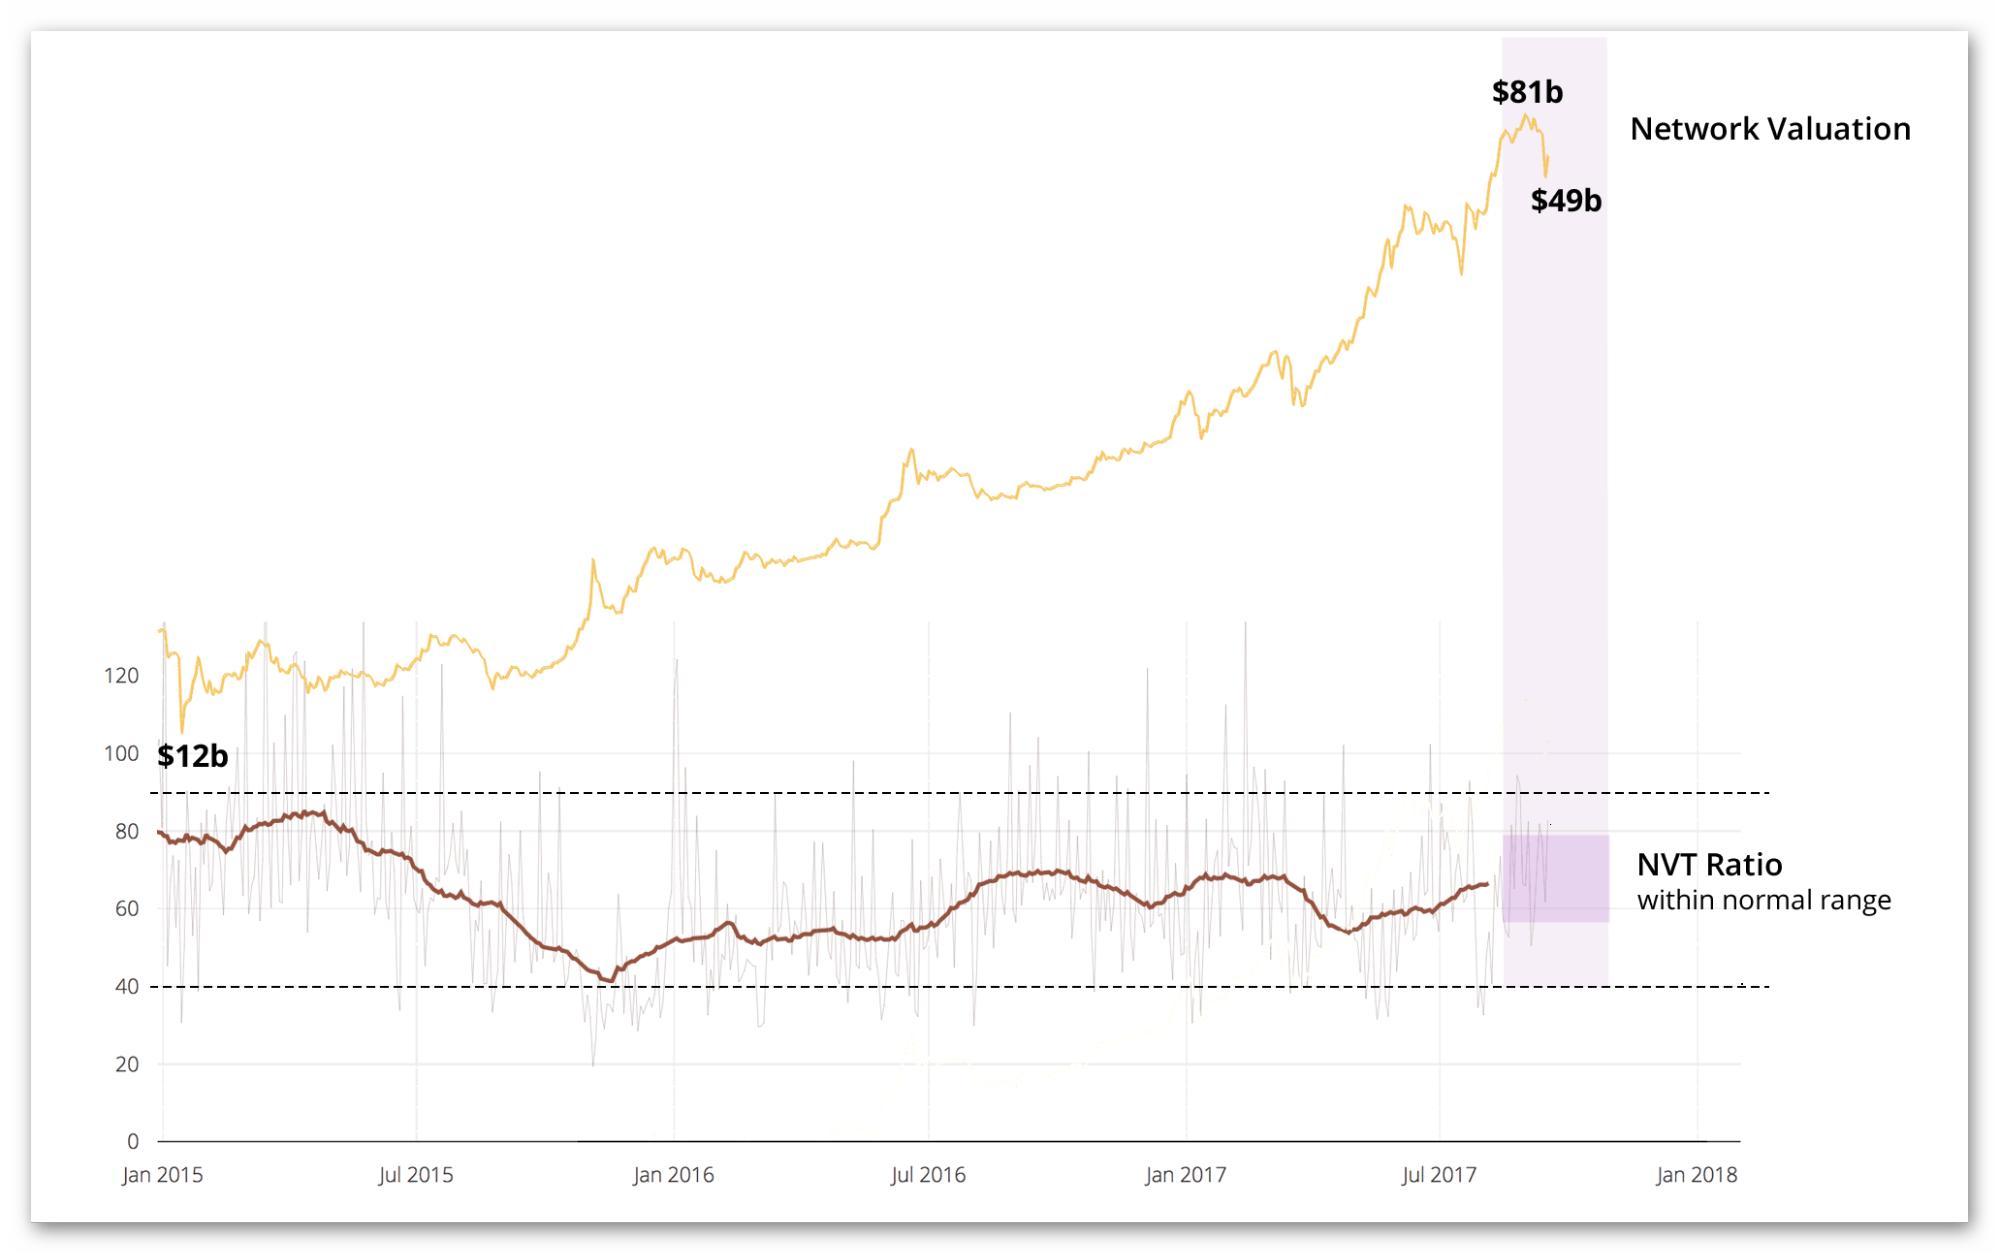 The absolute values of the indicator are not of much importance; we only look at the position of the NVT ratio relative to the channel lines. That is, it is a kind of overbought/oversold oscillator:
- Do not enter buys if NVT goes beyond the upper boundary;
- Do not enter sells if NVT goes beyond the lower boundary.
Applying the Indicator
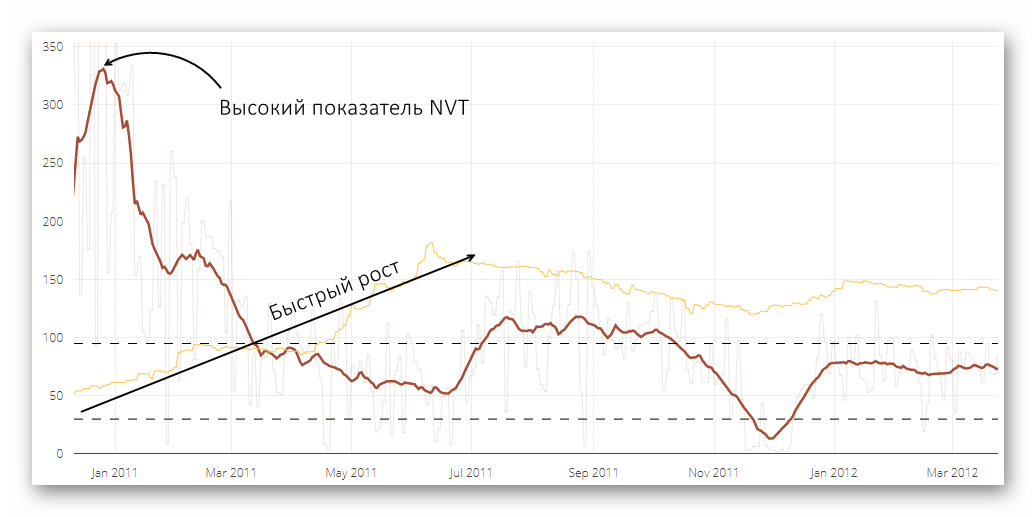
 In the early years, Bitcoin grew very actively, and the network capitalization rose rapidly. At the same time, turnover was not so large, so it is not surprising that NVT shows a very high reading precisely at the dawn of the cryptocurrency market's formation. A similar picture is often observed when calculating PE for fast-growing young companies, when the potential for future growth is priced into the asset in advance.
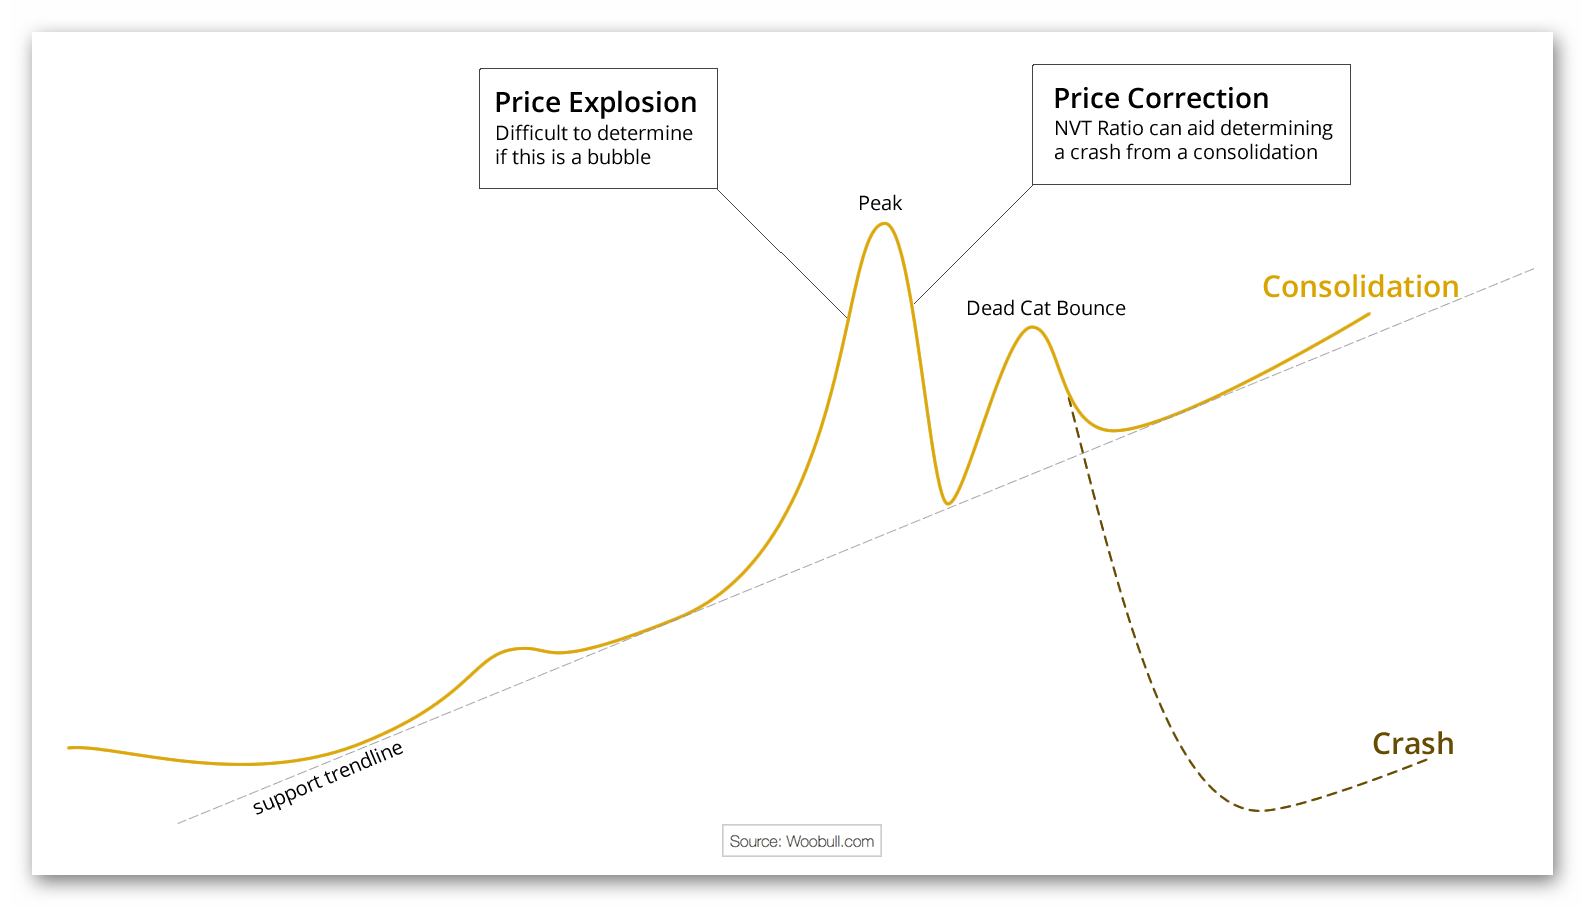
 Unfortunately, it is almost impossible to accurately predict the collapse of a bubble simply from active price growth. First, you need to wait for the formation of a price peak and the subsequent correction. At this stage, the NVT indicator will help determine whether the price will hold or whether a sharp fall awaits us.
 For example, the explosive growth of Ethereum in mid-2017 could well have ended in the collapse of a bubble. However, this did not happen, and the price consolidated, thereby refuting fears about a bubble.
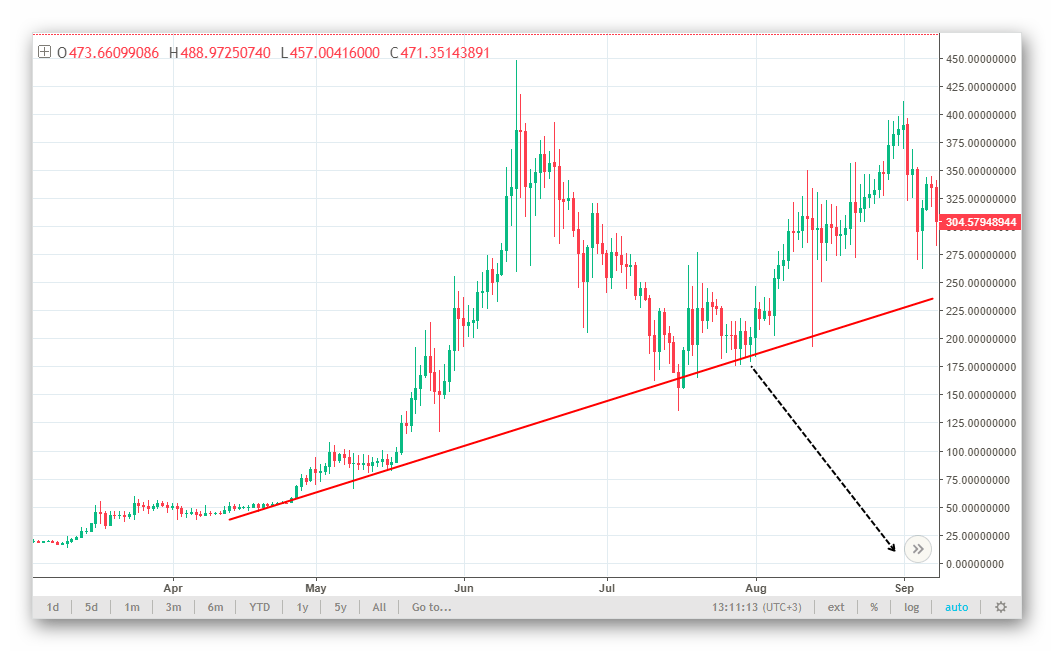 The easiest way to determine the presence of a bubble is by abnormal NVT values. If, after the formation of a price peak, the NVT remains within the horizontal lines, most likely consolidation will follow further, and the new price will become established in the market. If the NVT goes beyond normal values, one should prepare for a sharp crash and a significant price correction.
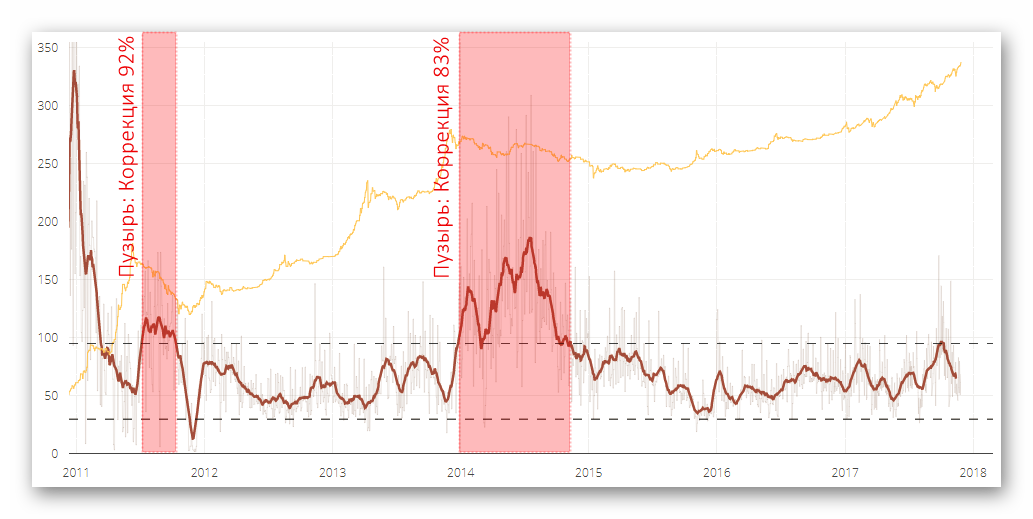 In 2013, Bitcoin experienced a significant price surge - the correction at the maximum point amounted to 83%. At the same time, the NVT indicator was within the normal range. Having the indicator at that time, one could say that the market valued Bitcoin below its fair value, succumbing to the general hype. As a result, the price quickly returned to its previous values, forming consolidation.
Conclusion
 The NVT indicator helps determine whether Bitcoin is in a bubble phase or not, that is, when to expect a collapse and prepare for selling. In essence, this is an indicator of fair price, showing how much the asset is overvalued or, conversely, undervalued by the market. Trading Bitcoin is not a simple thing. As is known, on a wave of hype the market can behave inadequately, but sooner or later, the fair price prevails.
Respectfully, Alexey Vergunov TradeLikeaPro.ru
