
New facets of technical analysis: volume placement in channels

Technical analysis patterns are the alpha and omega of trading. A young and inexperienced trader starts learning with the basics: channels, triangles, head-and-shoulders. When the first money has been lost on patterns, it is time to move on to indicators.
Sooner or later, most of those who remain in the market, having gained experience, return to the very beginning: to patterns. With experience, a trader develops an understanding of how patterns are formed on different instruments, how to determine the time of entry or exit from a pattern, and so on.
Behind technical analysis patterns stand player volumes. Even without understanding the models of volume accumulation and distribution, you can and should look at the volume quote to get confirmation or cancellation of an entry or exit signal within the framework of classical technical analysis.
The foundation of technical analysis is all kinds of channels. Any technical analysis pattern can be broken down into channels. Any market phase can be described through the prism of channels.
Below is information on how to determine the placement of trading volumes in channels.
What is a channel in technical analysis
A channel in technical analysis is a tool that visually confines price movement between two parallel lines. These lines represent support areas (the lower line) and resistance (the upper line). In other words, a channel is a corridor within which the price of an asset (stock, currency, index, etc.) moves.
The support line (Support) shows the level where buyers usually enter the market, preventing the price from falling lower. The resistance line (Resistance) shows the level where sellers begin to dominate, preventing the price from rising higher.
If we consider channels from the perspective of an auction, then support is the place where sellers run out, and resistance is the place where buyers run out.
Let me remind you of the basics: the market is a double auction where price moves from the most expensive market buy to the cheapest market sell.
Types of channels
Two main types of channels can be distinguished depending on the trend direction: directional and horizontal.
A horizontal channel is also known as a sideways market, range, or balance. It forms when supply and demand are balanced in the market. The boundaries of the corridor (Trading Range) can be wider or narrower. If the corridor is wide enough, then within such a channel it is possible to trade in the opposite direction from the extreme.
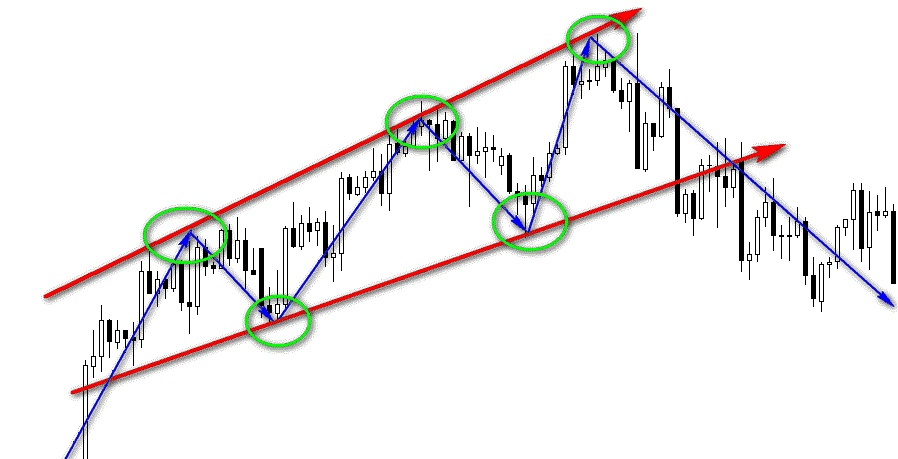
Directional channels are, in essence, a trend movement up or down. In an ascending channel (Ascending Channel), both the upper and lower lines are directed upward; in a descending channel (Descending Channel), the opposite is true. Such channels appear within very wide balances or after an initial explosive impulse as a pattern.
Basics of trading in channels
Traders use channels for:
- Determining the trend.
- Finding trade entry points: buying at the lower boundary of the channel (the support line) in anticipation of a price rebound upward, and selling at the upper boundary of the channel (the resistance line) in anticipation of a price rebound downward.
- Determining profit targets (Take Profit): when buying at support, the opposite boundary of the channel will be a logical target for taking profit.
- Determining exit points (Stop Loss): when buying at the lower line, the stop loss is placed slightly below this line. A break of support downward (or resistance upward) often means a trend change or an acceleration of the move.
- Determining volatility: the width of the channel indicates market volatility. A wide channel = high volatility, a narrow channel = low.
The most important thing in channel trading is not the movement inside it, but the moment of its breakout (Breakout):
- A breakout of resistance in an ascending channel (the price confidently closes above the upper line) often signals a strengthening of the uptrend.
- A breakout of support in a descending channel (the price confidently closes below the lower line) often signals a strengthening of the downtrend.
A breakout, especially with large trading volume, is a strong signal that many traders use to enter a trade in the direction of the breakout. At the same time, you need to watch that there is no return to the old channel, otherwise such a breakout may be the culmination of the move and a signal that the current trend is stopping.
In turn, a sharp breakout of the channel in the opposite direction is often a reversal signal, that is, a break of the previous dynamics, especially within trading very wide ranges on higher timeframes.
If after leaving a directional channel the price moves horizontally, this is a reliable signal of a transition into a consolidation phase (balance), which may drag on for a long time.
Directional channels and the placement of volumes within them
To determine a directional channel, it is necessary to have at least two upper and two lower extremes. Without two such points, it is difficult to say that we are in a directional channel. This is a disadvantage of channel trading. But it is also its advantage, since it provides a sufficiently reliable entry with a relatively short stop when a potential third point appears.
It is important to remember that we build an ascending channel from two supports, and a descending channel from two resistances.
How to Properly Build Support and Resistance in Channels
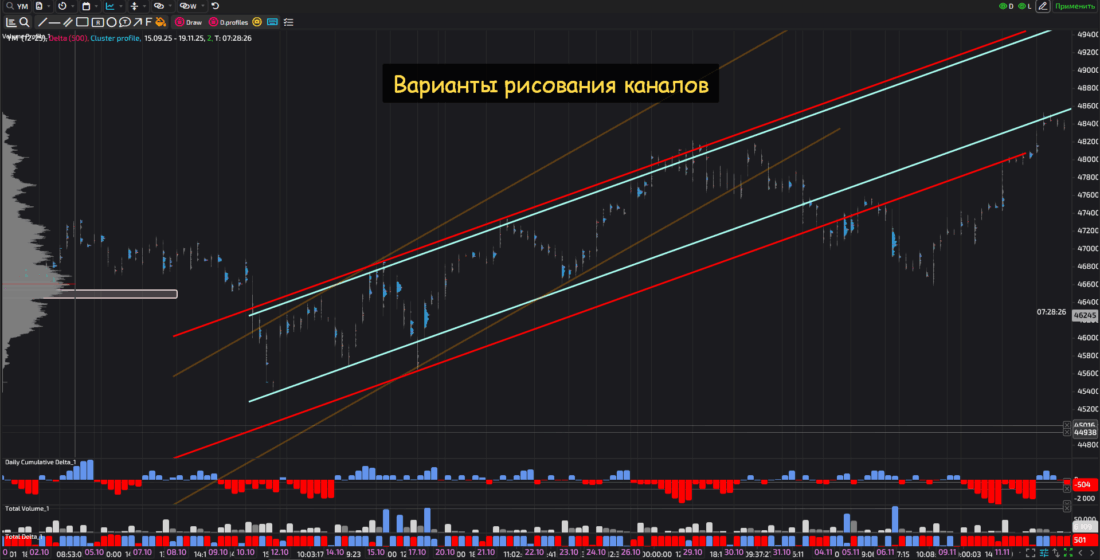
The correct construction of a channel boundary is far from a trivial matter.
I hold the view that lines should be drawn along price extremes. This is especially relevant at the initial stage of channel formation. This idea is classical. Some traders and analysts draw lines along opening prices (candle bodies), but this method carries the risk of introducing additional errors when building a channel.
I tried drawing channels by the volume bottom of accumulations, and this method proved reliable. Be that as it may, we always see the channel, regardless of the method used to build it. But we do not always see the completion.
Volumes in Channels
Let me remind you of the basics. Volumes are vertical and horizontal. Vertical volumes are the total amount of volume that passed during a time period, while horizontal volumes are the amount of volume at price traded during a timeframe. For example, in one hour, a total of 8410 contracts were traded on the 6E futures (euro), and at the price of 1.15885 during that same hour, 1242 contracts were traded.
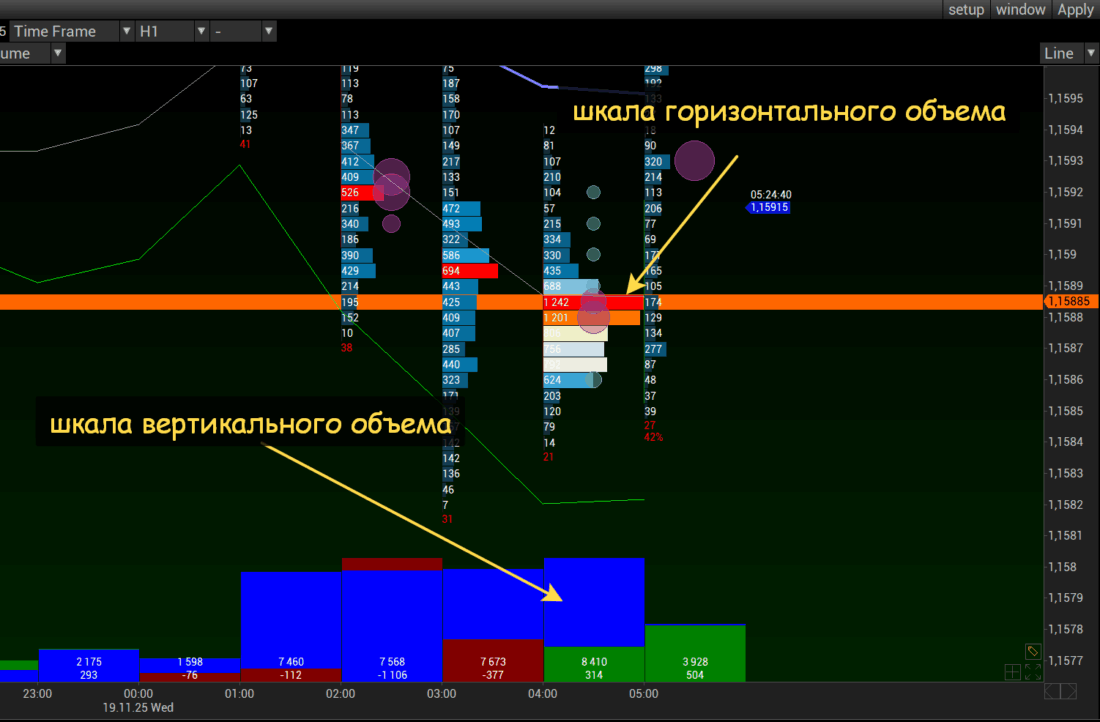
You need to understand what little and much mean in horizontal and vertical volumes. You should also understand what volume positioning is. This will allow you to see the beginning or the end of a move.
If you look at channels on higher timeframes, then volumes show the formation of supports and resistances well. Dense horizontal accumulations form at the support line of an ascending channel, and at the resistance line of a descending one. By the way, in a descending channel, the price can often touch the upper boundary without serious accumulation: buyers give up faster in a falling market.
In turn, on lower timeframes (intraday), it is not always possible to find a "beautiful" channel with several touches of the defensive boundary (support in an ascending and resistance in a descending channel). At the same time, the volume accumulation model makes it possible to assume in advance that an ascending channel is being formed (more precisely, ascending dynamics that will later be called a channel).
Trading in a Directional Channel
Finding an Entry Point Before the Channel Is Fully Formed
This is the most difficult moment when looking for an entry within a channel: it does not exist yet, but we are already beginning to see it. It is easy to make a mistake here, especially intraday.
Below I will show how to find an entry point in the place that will later become the second bottom in an ascending channel. We will be talking about trading after liquidity is placed in the initial balance.
Initial balance is the time when a large player takes a position at the opening of the trading day. In a normal situation, this is the first half hour or hour after the start of RTH trading (8:30 CT). This is usually when the highest intraday volatility is observed and the largest volumes pass through. This is the time when you can quickly catch a large move or quickly lose everything. This is the time when stops are larger and there is less time to correct a mistake. In general, it is the best time for the game, but the most dangerous time for work.
If you do not understand these basics, then you should not look for an entry point immediately after the initial balance. This also includes looking for an entry point in a forming channel. If you are confident in yourself and your abilities, then below is shown one of the common ways to trade the American session.
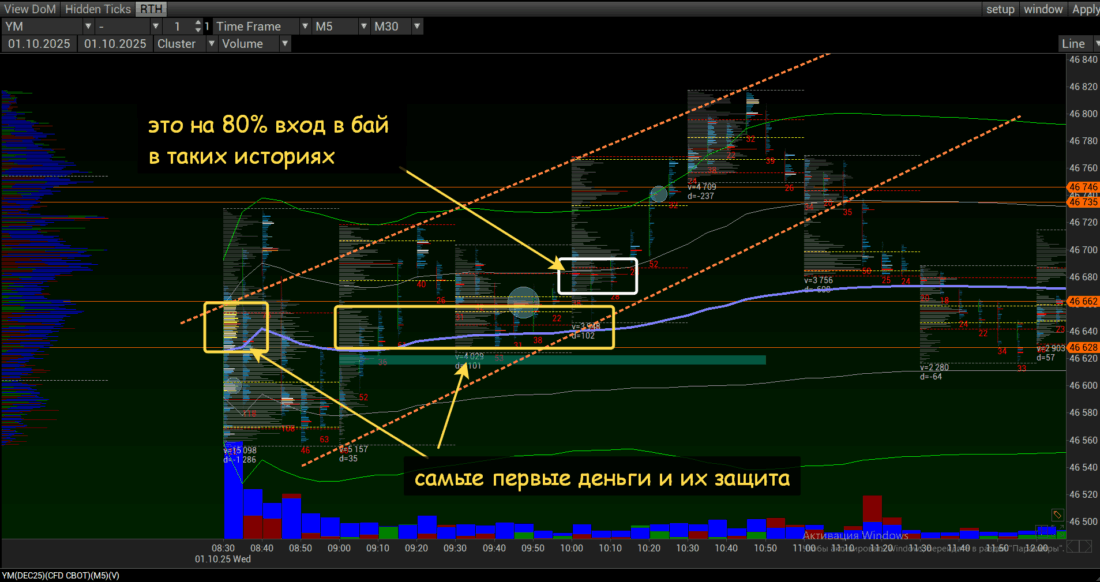
After the initial balance breakout on October 1, 2025, we see that the price, in essence, did not shift, which means the movement potential is limited. Why are we looking for buys in the place where the second bottom in an ascending channel will later form?
- After the initial volumes are placed in the first 30 minutes (from 8:30 CT to 9:00 CT), we see a sharp return to local highs from local lows. This takes about 20 minutes.
- For another 40 minutes, liquidity is accumulated according to a buying model. By 10 a.m. CT, an entry point with a short stop has already appeared.
- We see the holding of the 46628-46622 range, where a great deal of money was accumulated at the very beginning and which was initially traded out in both directions before becoming support.
- We see the formation of local lows even without taking out stops, while retaining all the volumes that can be positioned into buys.
If buying in the 46628-46622 range feels scary, then after 10 a.m. there were another 20 minutes to buy in the 46670-46690 area with a stop under the bottom formed at the opening of the hour, or under the previous bottom on M30.
How do we look for a target? We measure the first expansion to the side (in our case it was just under 170 pips) and choose a target at about 2/3 of the move length to be safe. And at the same time, do not forget to calculate how many points the price has already traveled from the bottom to our entry point. By the way, the second move in this case amounted to about 190 ticks, that is, a confident 100-150 points in half an hour was quite achievable.
The story shown above is not exactly about trading in a channel. It is a story about how to look for an entry where support may form, including as part of the formation of the second support in a future channel.
Finding an Entry Point When Approaching the Channel Boundary
This is a classic option that works well in an intraday impulse (not to be confused with directional movement, where channels can be extremely short, as shown above) and on a higher timeframe.
Here is a volume quote of the YM futures. The quote is not the simplest: it is a volume range bar formed by accumulated delta (500 contracts to buy or sell). In essence, this is a chart cleared of time and unnecessary volatility.
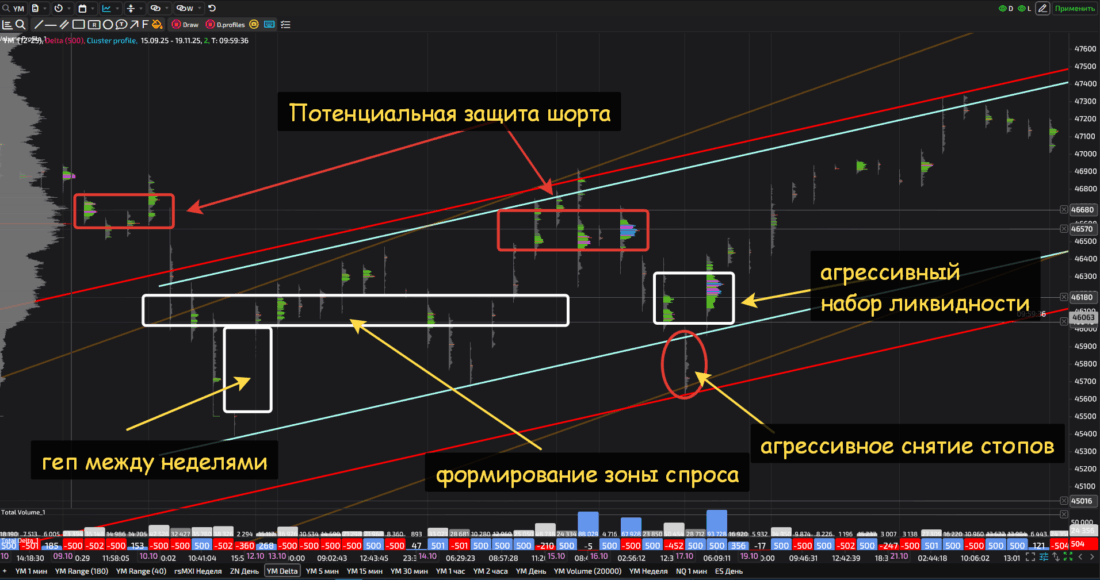
So, we see some kind of bottom, an actual gap on Monday, the trading of the gap, and a sharp strike upward with liquidity accumulation in the zone of a potential short.
The support line has already been built on two lows, and it was broken downward with a sharp return to the old channel. This is a difficult situation in the moment, but in any case, we see a collection of volumes in the 46040-46180 range, where liquidity had previously passed through, which before that had been positioned in both directions.
In addition, we see significant volume spikes both in the zone of potential resistance and in the zone of potential support. This is visible in both the vertical and horizontal volumes (colored filters). Overall, we record a rotation of volumes that should produce a good move, since there are all the signs of money being accumulated for a move: high volatility and aggressive volume accumulation.
No matter how we draw the channel, a return to the original channel is clearly visible, with serious volumes accumulating as the quote rises. This is an entry signal, but we ignore it: after all, there was a serious puncture of the support line, even if it was followed by a sharp return. Therefore, we pass.
An attentive reader will say that there is a lot in common here with the previous example. Yes, that is true. But the previous example was intraday, and there the stops were short. Here the example covers 2 weeks, and the stops are much larger if you do not drill down into the quote. Besides, the goal here is to show a reliable entry, not a complex one where stops were taken out and there was still no complete clarity about where the large players were opening positions.
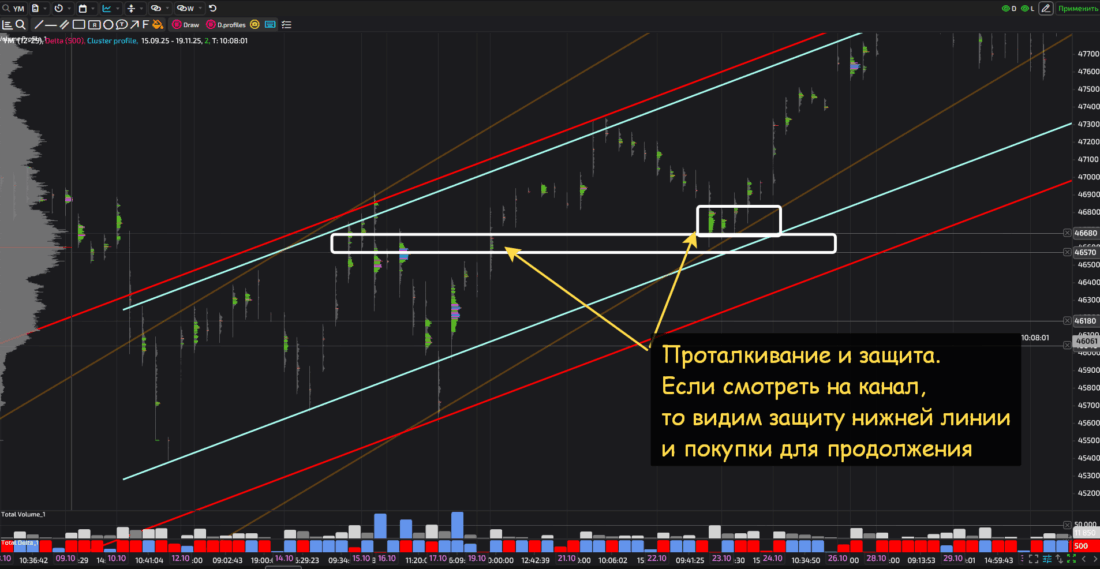
Liquidity for pushing into buy is located in the 46570-46680 range. This is above all the large placements over the previous days. It passed on October 20, 2025. Three days later, on October 23, the quote returned to this pushing liquidity. After that we see growth in vertical volumes, although not critical. We also see confident accumulation of liquidity above the potential volume support and above the line of the original ascending channel.
Within the framework of trading in a channel, this is the ideal place to buy, is it not? Thanks to the volumes, the players' defense of the ascending channel is visible; without technical analysis, we are talking about defending the buy-push range.
If we buy together with the market where it is least dangerous from the standpoint of both volume analysis and classical technical analysis, then we get the opportunity to buy the very bottom within the ascending channel. As in the previous example, we calculate the travel range from the previous move. The first strike is 1700 ticks, the second is slightly less than 1600. I think the trading idea here is completely clear.
Searching for a Countertrend on a Channel Breakout in the Opposite Direction
Searching for a countertrend on a channel breakout in the opposite direction is often an extremely thankless task. Most often, you can get stuck in a prolonged consolidation, and that is not at all what makes opening a position worthwhile. Especially on higher timeframes. But it is not uncommon to catch a very attractive countertrend. That is what we will discuss.
Break of a Weak Channel
Let us return to the first example, the Dow futures from October 1, 2025.
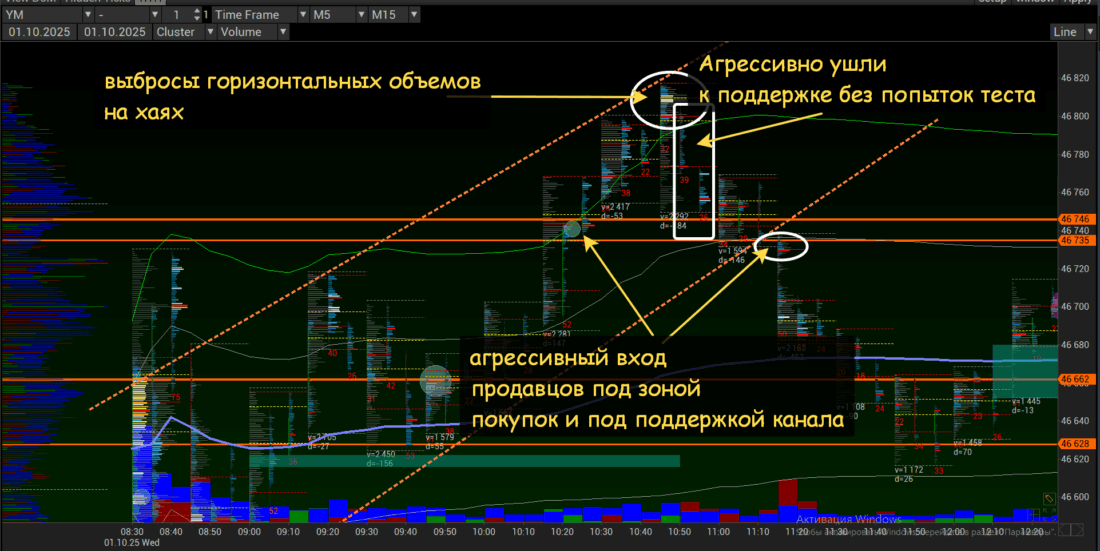
Liquidity in the 46735-46746 range could be marked as pushing liquidity that, within impulsive dynamics, should act as support. By that time, the support line of the ascending channel had also moved up to this area. For 20 minutes, the players tried to accumulate liquidity slightly above the breakout range (46735-46746), exactly as they should within the formation of another bottom in ascending dynamics.
What should have made us cautious and warned us that buying could be dangerous?
- Large horizontal volumes at the absolute highs: there were no such filters at the lows.
- An aggressive, almost cascading retreat from the highs to the zone of potential support and uncertain behavior there: volumes are not growing, there are no attempts to form a second top, and so on.
- A sharp strike below support and slightly below the channel support line, with rapid accumulation of horizontal volumes BELOW the levels and lines.
Above I listed markers that could either have saved us from an entry or even made it possible to enter a speculative short around 46730 with a stop of 25-35 points. That is a very good stop for this instrument.
At the same time, an hour later there was a return, and the quote swung around all day in a wide range. The pattern is not very strong, but an experienced trader can trade it.
Reliable Break of the Channel
Here is an example of a break of an ascending channel within a two-week move. No matter how we draw the channels, we see break markers everywhere.
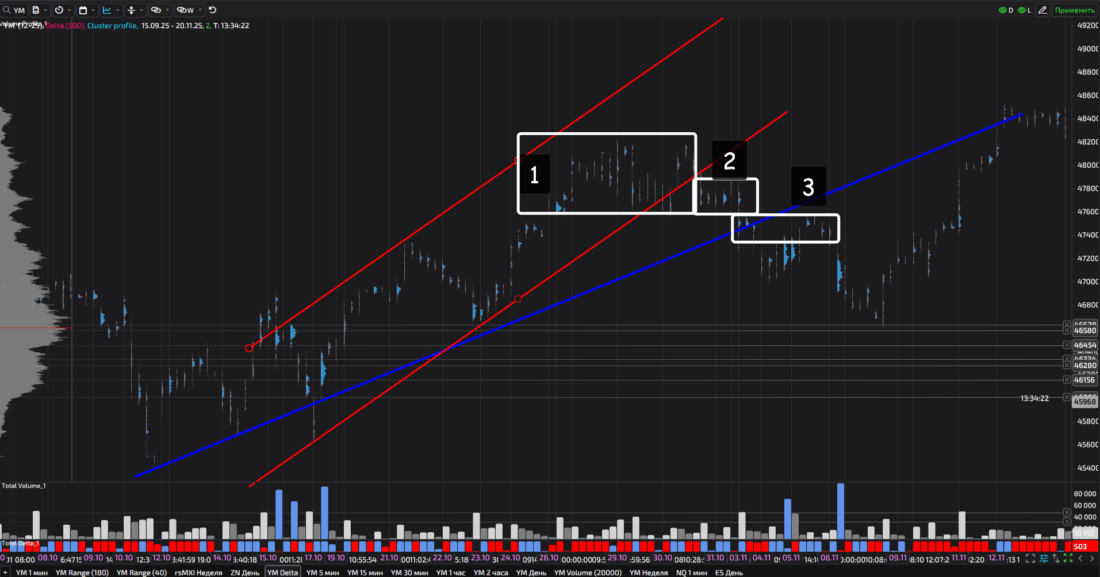
The first break marker is a clear transition into consolidation (1).
Look at the red ascending channel: it is the most aggressive. It was broken fairly quickly, and they began accumulating liquidity in the flat area (2). Moreover, this happened after an attempted bounce from the support line that ended in a breakout.
The original ascending channel is blue. By the time of the break, it had moved up to the zone of potential support in the 47480-47740 range. Support was pierced, the quote was returned to support, and then it fell again (3). Could one look for a short there? Yes, quite reasonably.
By the way, an attentive reader will see here that volumes against the ascending channel always go below the previous ones and below the support line. This is precisely that repositioning of volume, when support becomes resistance.
So, a channel break is an exit from it with volume accumulation below support in the case of an ascending channel and above resistance in the case of a descending one. Then the channel line is tested from the opposite side, followed by a sharp reversal strike. The setup is quite clear.
Conclusion
A channel is a powerful and visual tool of technical analysis.
Analyzing volume placement in a channel helps to identify support or resistance and make a decision about entering the market.
Main rules:
- the main buy placements go slightly above the lower boundary of the channel with small pullbacks to it. The same goes for shorts: the main placements go slightly below the resistance line;
- if volumes begin to accumulate in a narrow flat area after a quick strike slightly below support in an ascending channel and slightly above resistance in a descending channel, then this is a very strong signal of a channel break, and there may be a strike in the opposite direction or a transition into a flat.
Correct construction of support, resistance, and channel lines is an art, not an exact science. Using volume quotations helps to see the beginning of a move and its end more clearly, and therefore find the entry point and the exit point.
Respectfully,
Ivan Rusin