
New Facets of Technical Analysis: How Volumes Are Placed in the Head and Shoulders Pattern

The "Head and Shoulders" pattern is one of traders' most favorite ones. The reason for its popularity lies in the fact that the H&S formation often seems the most understandable for identification on a "clean" chart.
But modern trading still implies a deeper analysis of patterns. The "Head and Shoulders" pattern is no exception here. With every year, the H&S formation becomes visually more and more blurred, and therefore hard to distinguish.
A separate problem is the progressive growth of false patterns. Volume analysis of the quote makes it possible to look behind the picture and see how much players are trading the "head and shoulders," and how much it is a break of the popular pattern for taking money.
Below is a detailed breakdown of how volumes are placed in the "Head and Shoulders" pattern.
What the "Head and Shoulders" formation is in simple words
In technical analysis, the "Head and Shoulders" pattern belongs to reversal formations. The H&S formation signals a possible culmination, that is, the completion of the current wave of growth or decline.
Many authors indicate that the "Head and Shoulders" formation is more characteristic of a rising market. But this information does not entirely correspond to reality. If, for example, in currencies the H&S pattern more often completes an upward movement, then in stock indices lately the "Inverse Head and Shoulders" formation is encountered more often, which signals a reversal of downward dynamics.
Timely recognition of H&S gives a good opportunity to open a position with a fairly short stop: exactly what a trader needs. The only problem is that in modern markets it is not so easy to find a clean pattern.
The anatomy of the formation: what the "Head and Shoulders" pattern consists of
The H&S formation consists of three consecutive peaks: two small "shoulders" on the sides and a higher central peak, the "head" (head). A support line, the "neckline" (neckline), is drawn between the shoulders.
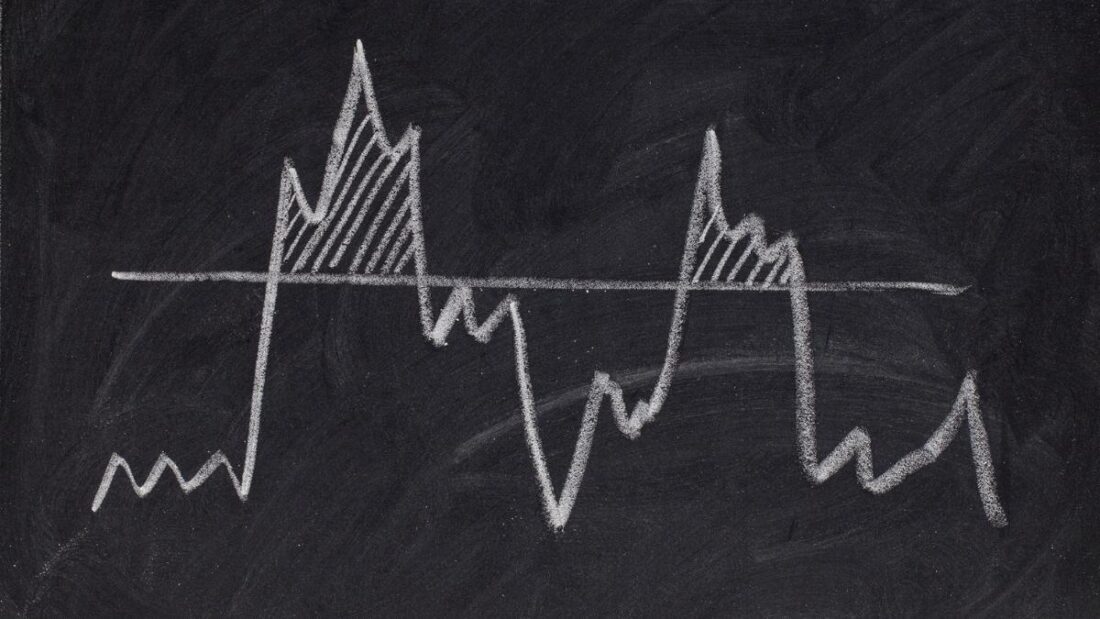
- Left shoulder. The impulse reaches a maximum, after which a pronounced correction follows.
- Head. The price rises above the previous extreme and pulls back again.
- Right shoulder. Another rise that does not reach the level of the head, then another pullback to the neckline.
- Neckline. Connects the lows of the pullbacks between the shoulders and the head; it can be horizontal or sloping.
It is important to pay attention to the rise line of the right shoulder: it should not exceed one half and be less than one third of the entire height of the head. The rule is empirical, it does not always work, but it still needs to be remembered.
It is also worth paying attention to the impulse as a result of which the left shoulder is formed: the stronger it is (the longer it is), the greater the chances of forming H&S. It is also worth watching the neckline: the sharper the angle of this line, the higher the probability of an incorrect interpretation of the formation or of setting potential targets. These two parameters need to be evaluated together.
The standard interpretation is as follows: if the price breaks the neckline downward after the formation of the right shoulder and moves in a plane for some time, this is a signal to sell (or close long positions).
It is believed that the conservative profit point when entering on a neckline break in the H&S pattern lies within a range equal to the height of the head. The expected profit point is located at the base of the right shoulder. Optimists can leave a small part of the position in the market if they are confident in a complete change of dynamics.
Placement of volumes in the H&S formation
Finding an H&S formation that is visually ideal in all respects is not so easy. And most importantly, it becomes more and more difficult every year. But the placed volumes, which are hidden inside the formation, almost always have nearly the same appearance. And it is precisely the volumes that help us understand with the utmost clarity whether we are dealing with H&S or with something else.
The "Head and Shoulders" pattern as a model of volume accumulation and trading through an imbalance zone
On the chart of the 6E (EURUSD) futures, let us examine a trend situation within which the "Head and Shoulders" pattern can be seen. For simplicity, let us first look at a line chart.
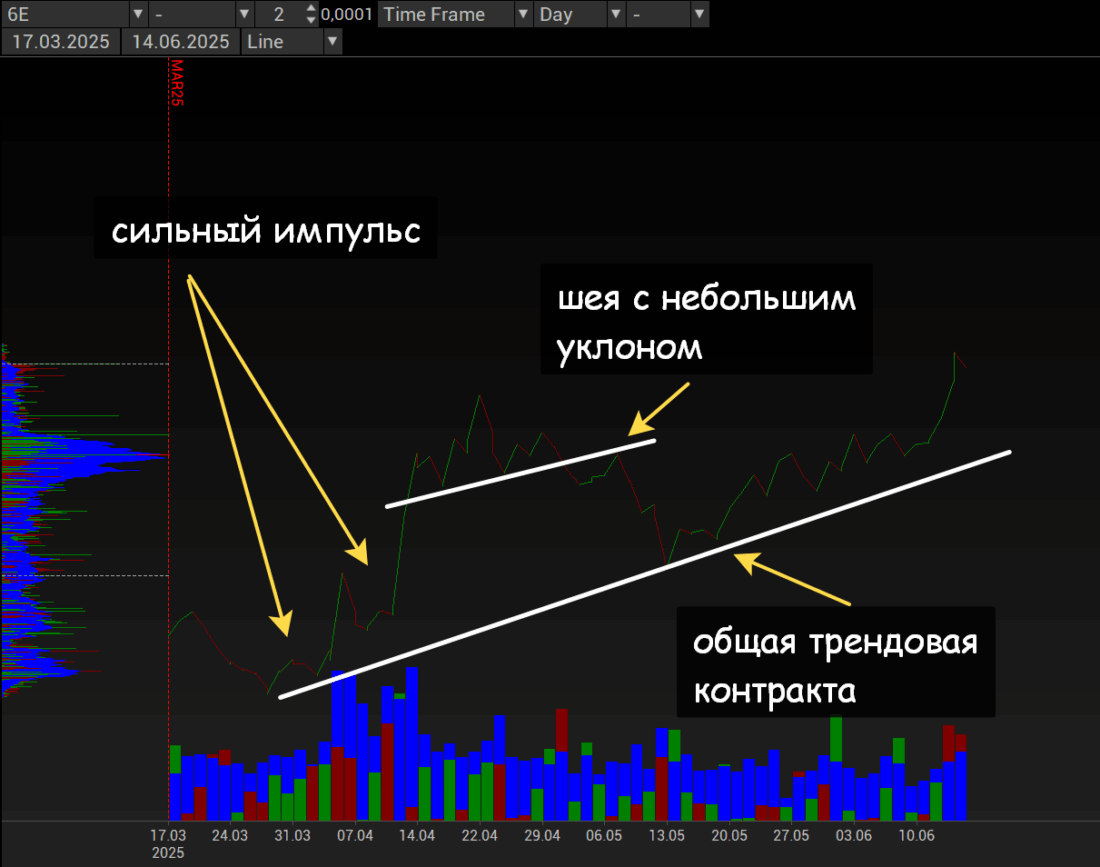
To be precise, this is the June 2025 contract in front of us. If you look at the volume model of the entire contract, it is a typical "normal" trend model: for about a month, liquidity was loaded, after which it was sharply expanded to the north with an impulse. There they stood in a plane for about another month, after which they took out buyers' stops / let sellers exit / traded the imbalance toward the average VWAP and calmly, without excitement, went on to make a new high.
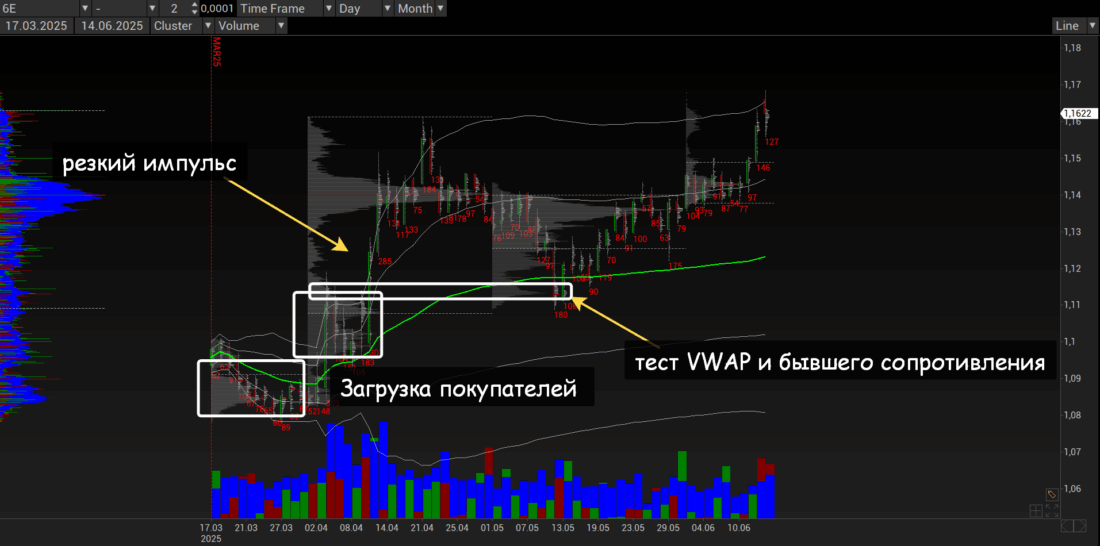
I note: the explosive rise from the average VWAP corresponds to 3 lengths of the range of volume accumulation after the direction was shown.
I will not analyze the situation with searching for buys before they started drawing the H&S. But I will mark the levels so it is clear where to place the take-profit in the H&S.
If we look very roughly, then in the 1080-1140 area there is the upper zone of the volume cluster that was aggressively accumulated into buy. That is, within the balance and the short-term game these were spikes into resistance, while within the medium term buys were loaded here. Therefore, the 1080-1140 range would be the target for a test of the buyers. The most conservative target would be shorts at 1190-1200, that is, at the local highs that appeared before the formation of the left shoulder began.
But let us return to the beginning. The imbalance to the north passed on very high vertical volumes. This is normal in such a situation.
But the fact that the horizontal volumes were loaded in the flat makes interpretation and the search for an entry more difficult. Horizontal flats can often be traded out in the same direction without trading out the imbalance. What should be done? It is necessary to look for clues.
One strong clue that trading out the main movement in the opposite direction is quite likely is the very sharpness of the impulse. In essence, they flew away from VWAP to the +2 deviation and then crawled upward along that deviation for several days.
A good impulse move is a pullback from the +2 to the +1 deviation, volume accumulation there, and further expansion. Here they came to the +1 deviation after the formation of the "head" (in essence, this is the climax of the impulse).
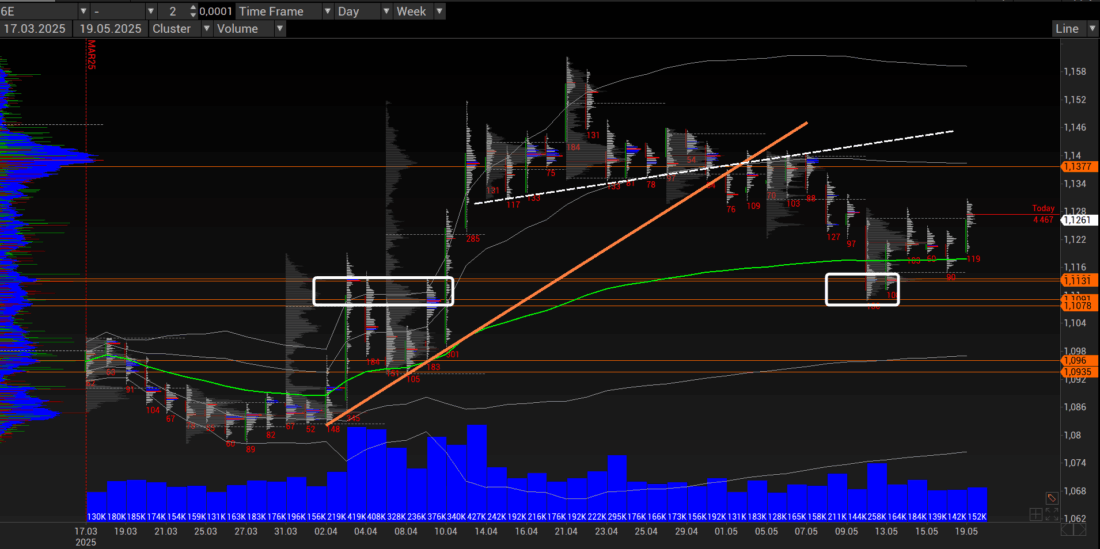
What do we see:
- Long work at +1 VWAP without attempts to go to +2, which indicates a desire to move to the VWAP mean. In fact, this is the formation of the second shoulder in the flat.
- The climax and the reverse have the characteristic appearance of a double imbalance (a strike in both directions without volumes along the movement). This is how the head is usually formed.
- A pierce of both the neckline and the ascending channel line, and the +1 VWAP deviation, with a test of these two drawn lines and one line built from objective data.
- Before the start downward, horizontal volumes passed that can be assessed as preparatory for the strike (blue filter).
In this example, incidentally, the downward move from the neckline is comparable with the range of the head. But the height of the second shoulder barely reached a third of the head's range.
What is missing here for the continuation of the move downward?
The break of the neckline passed on low vertical volumes relative to the initial impulse. In fact, we see a slow slide to the support levels that I wrote about above. On the other hand, there is an increase in vertical volumes on the southern expansion compared with the balance period, and in percentage terms it is quite decent.
I will repeat the main idea once again: on the move away after the break of the neckline, volumes increased by a third or more, but if we compare them with the volumes that passed during the rise (the formation of the body), then they are 2-2.5 times lower.
This is precisely a corrective scenario, because there is no real aggression into short in the medium-term plan.
The Head and Shoulders Pattern as the Completion of the Main Correction Wave Within the Formation of a Support / Resistance Zone
Let us examine the situation in gold, where, incidentally, they really like to draw Head and Shoulders.
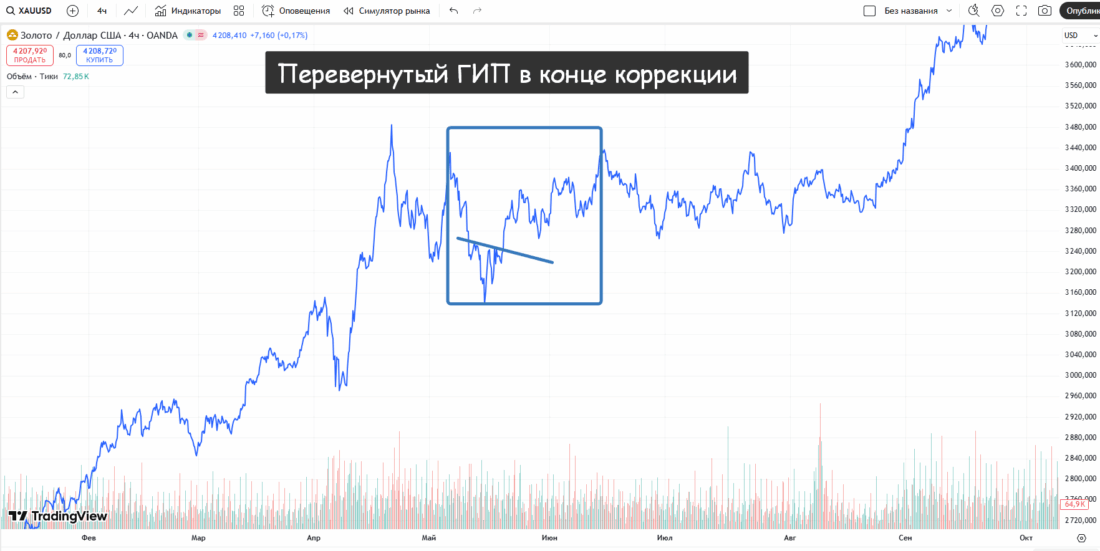
The picture from TradingView below shows the start of the impulse in April 2025. By the middle of May, they had formed the bottom of the balance in the form of the "Head and Shoulders" chart pattern, after which they moved into consolidation.
Overall, all the rules for the formation of the chart pattern were observed.
Now let us discuss volumes on the GC futures.
First, the general picture. In the 3220-3250 range from April 11 to 15, good horizontal accumulations passed, which were aggressively distributed into buy. The aggression is the very range of the move, which is comparable to the range of the first strike.
If you do not see the volume picture, then the whole move from the high to the low is one vertical strike. Volumes showed very dense work by buyers at the highs, who extremely aggressively gathered the sellers, not giving them the slightest chance.
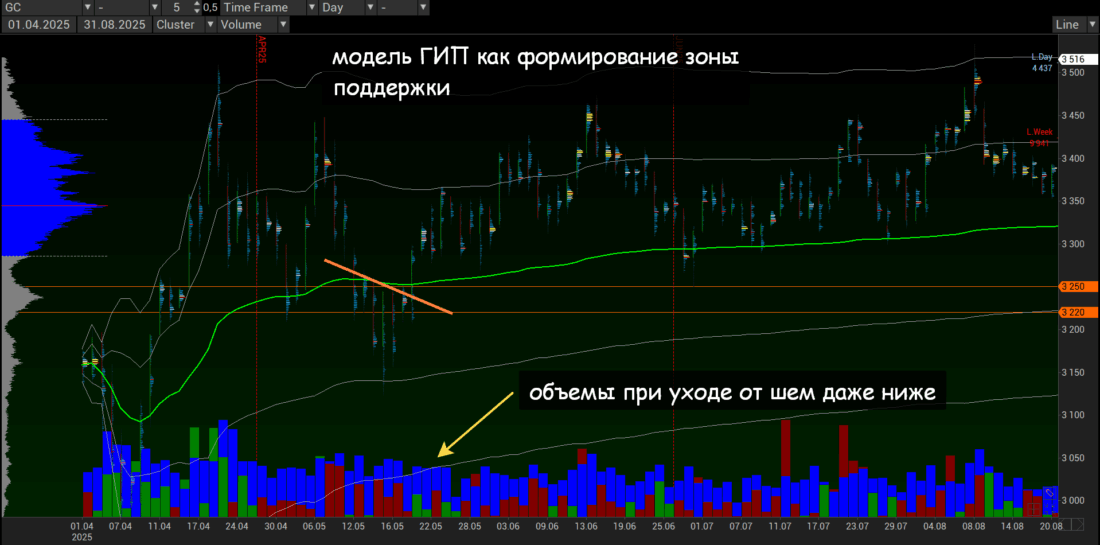
This is a pure impulse: loading in the flat at the extreme. In a pure impulse, such zones become serious support.
It was precisely from support in the 3220-3250 range that they bounced sharply in the first days of May, after which they began to form the second pullback wave, which became the body in the future H&S pattern.
The neck was formed in that very 3220-3250 range. Horizontal volumes in the shoulders also passed in this range.
In fact, we saw a puncture of the support range as part of stop hunting. They did not return to the 3220-3250 support, aside from the manipulative approach in July.
Please note that before the puncture of the neck, large horizontal volumes passed relative to the nearest ones.
In this version of the head and shoulders pattern, we did not see an increase in vertical volumes when moving away from the neck; they are even somewhat lower. This does not fit the general idea of how the body line should develop on the right, but it fully fits the assumption that the quote is moving into balance, where more money within a correction usually enters on the pullback move.
In this example, we see a sharp move away from the support range (the broken neck) toward the highs. This is a clear scenario of transition into an upward balance, which most often will be traded in the same direction as the previous impulse. This is the end of the first wave of correction.
The head and shoulders pattern as the beginning of dynamics within the completion of a volume accumulation model
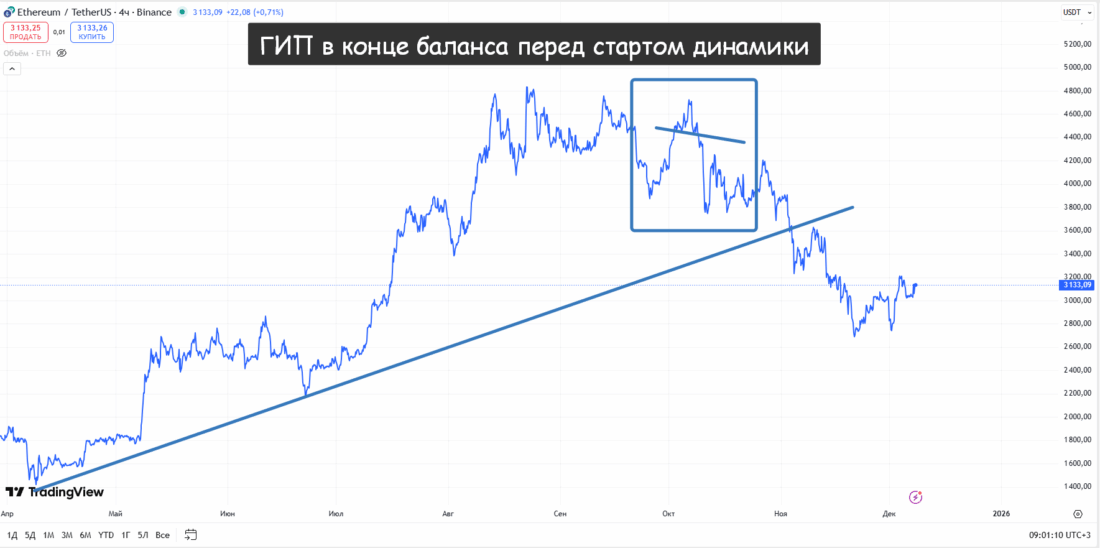
Now let us consider a scenario where the head and shoulders pattern appears at the end of a period of volume accumulation. In the example below (ETH 4H chart, October 2025), the pattern appeared in the flat, but it can also be a false breakout for stop hunting before the main dynamic move.
Let us examine the situation from the point of view of volumes. We will not recall that ETH is in a long-term balance: it moves in a very wide corridor. Let us simply consider the situation.
In July-August 2025, certain volumes were accumulated, where within the rotations local resistance was in the 3760-3895 range. After the balance was positioned to buy, this range became a reasonable support. We saw something similar in the examples above.
In the 4150-4335 range, pushing volumes passed, after which they even went to a new high. It is very similar to the volume picture on gold that we examined earlier.
But gold in August-September flew to the skies, while ETH collapsed into the 3760-3895 range with a sharp return above 4150-5335. This is a clear transition into a more complex balance with the potential for a reversal to the south after the final refusal of buyers to work at current prices.
Let us consider the formation of the head and shoulders pattern at the end of the balance phase on the D1 chart.
The last northward strike, which was the beginning of the formation of the H&S body, ended with the accumulation of reversal volumes in the 4670-4715 range: a double price imbalance passed there, both on the rise and on the decline. In fact, this strike looked like a distribution from the 4470-4550 range.
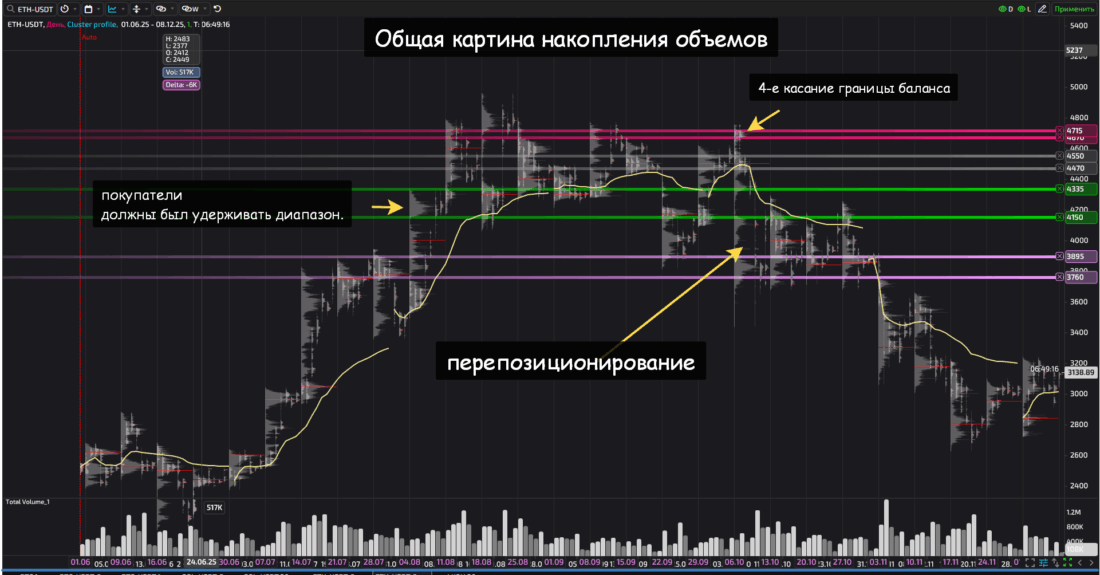
Shorts had passed through this range before, and they could have been accumulated here. The strike into 4670-4715 passed not only on a double imbalance, but also on an increase in vertical volumes during the formation of the right side of the head, which is a strong signal of manipulation and a shakeout from the market in this case of sellers during the rise stage and limit buyers during the decline stage.
The sharp return with a break of the 4470-4550 range became a clear signal for entering short with good potential, taking into account the possible full repositioning of volumes (the low was updated, the high was not updated, a reversal in the microstructure was shown).
And most importantly, we see the 4th touch of the boundary. In balance, this is a completion signal. If there is no breakout, then there is a high probability of a breakout of the opposite side, which is what we saw.
We move on to the H&S pattern itself: the H4 chart, built within the impulse from October 1, the formation of the body of the figure.
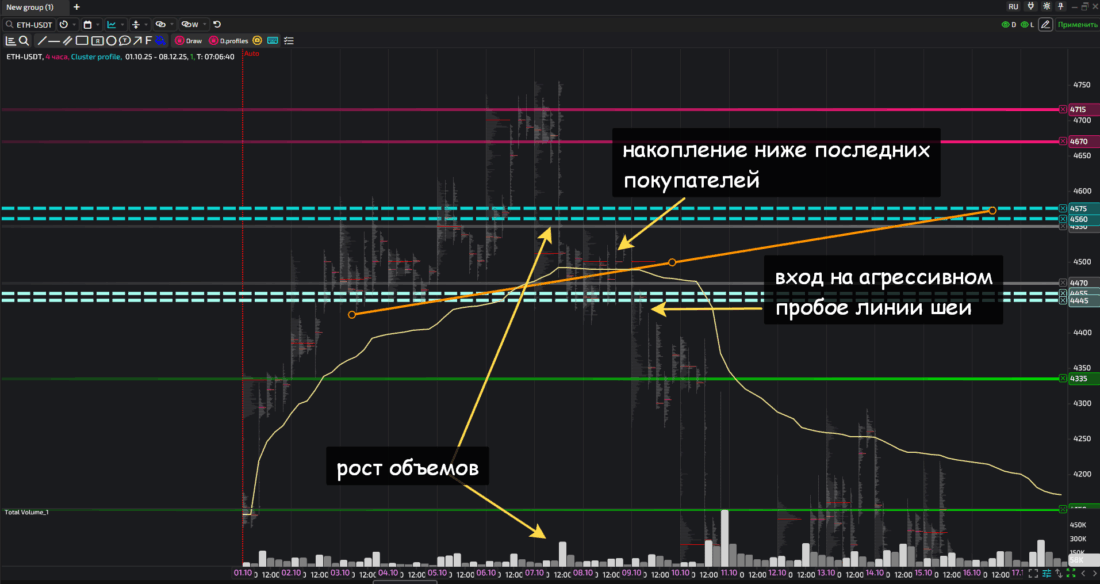
The downward strike during the formation of the right side of the head passed on very strong impact volumes with horizontal accumulation. If this were not the head and shoulders pattern, then buyers would have been obliged to defend the volumes at 4650-4575.
Buyers at the 4650-4575 marks were sharply punished with a further break of all supports and some kind of micro-fix of sales in the 4445-4455 range. The balance near the neckline lasted 2 days. If it is scary to enter from the upper boundary of the accumulation of shorts, then the iron entry is an impulsive breakout of all support volume ranges, the average VWAP of the impulse, and the neckline within the head and shoulders pattern.
What to remember when searching for the H&S pattern
- A clean head and shoulders figure is rather an exception in modern markets. Most often, the pattern will not be very visually clear.
- For searching, it is better to use the classic line chart.
- The quality of the pattern depends on the timeframe: higher means more reliable.
- The neckline and shoulder lines can be either horizontal or slightly sloping. The reliability of the figure may depend on the angle of slope.
The head and shoulders is a climactic or reversal figure that is formed:
- At the end of the balance, i.e. at the beginning of the trend wave. The formation occurs near the boundaries of the range.
- At the end of the trend wave as a signal of its culmination and final transition into balance.
- At the beginning or in the middle of the balance as a support model during a downward correction and resistance during an upward correction.
The formation of reverse dynamics after the neckline breakout can proceed on either elevated or normal volumes. This depends on the market phase and the overall pattern.
How to Set Targets in the Pattern
- If the H&S is formed as a correction of the main move (for example, the market is rising, and the H&S is the beginning of a pullback), then the move will be weak and corrective in nature. The targets are extremely conservative and go no farther than the push-through volumes.
- If the H&S was the completion of a correction (for example, the market is falling, the corrective rise ends with an H&S), you can set targets at the opposite boundary of the range and with an eye toward further range expansion if there are signals of a transition into impulse.
Respectfully,
Ivan Rusin