
New Facets of Technical Analysis: How Volumes Are Placed in Continuation Patterns

Recognizing technical analysis patterns is a special art, accessible far from all traders and analysts.
Quite often, after the completion of the formation of some pattern, one can speak of its ambiguity and argue for a long time about what exactly is drawn on the chart: a rectangle or a triangle, a "head and shoulders" or one of the forms of a V-shaped reversal. Even the shoulders in an H&S can be described as triangles or rectangles.
In this article, we will talk about graphical continuation patterns and the volumes standing behind them.
“Continuation patterns” in an impulse
An impulse is the distribution of volumes and the search for a new value zone. In an impulse, one can usually distinguish from three expansions and from two accumulations (balances) at the extremes (highs in a north move and lows in a south move). These short-term accumulations (balances) are the trend continuation patterns.
Continuation patterns include pennants, flags, triangles, and rectangles. Whatever graphical form continuation patterns may take, volume models clearly show the real mood of the market.
Drawing trend continuation patterns
Patterns can be drawn in different ways, while volume accumulations generally have a similar appearance.
Here is an impulse setup on M15 (GC futures, 9/11/2025). I drew 5 variants of patterns based on Alexander Elder's recommendations from the book "How to Play and Win at the Exchange": pattern lines should be drawn along the bodies of bars / candles (opening or closing prices). However, if you draw the lines by high-low prices in the examples below, nothing much will change.
Each of the marked 5 patterns worked out correctly.
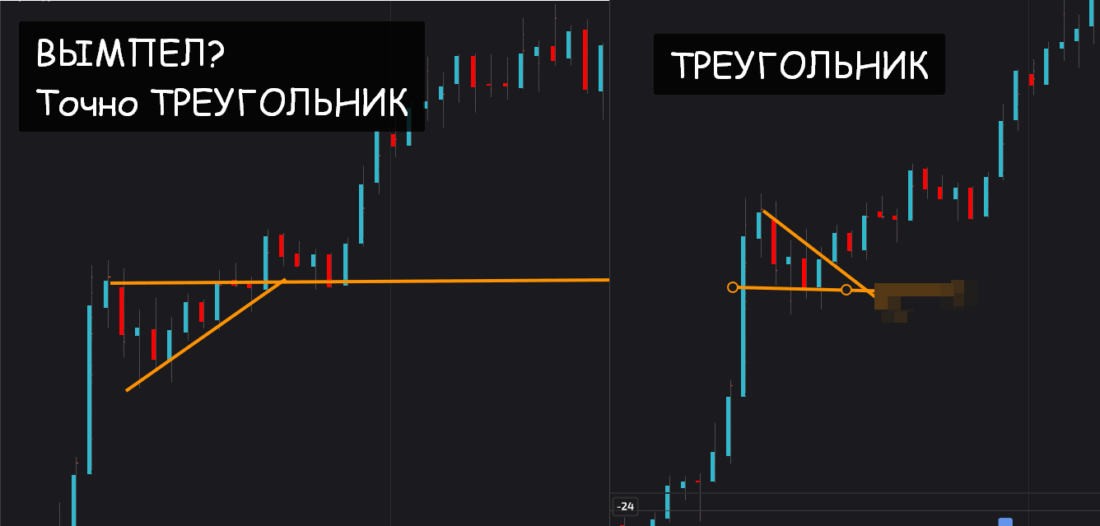
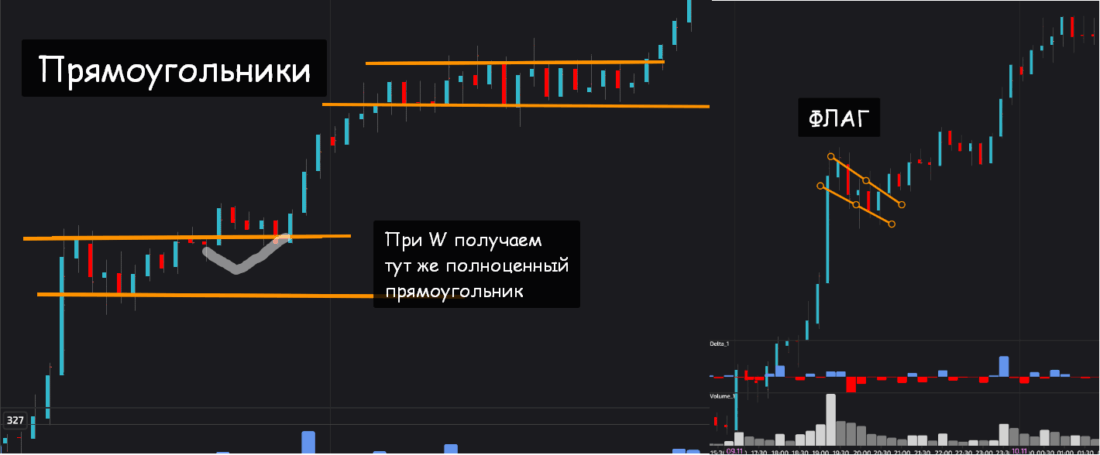
Strictly speaking, the rectangle in this specific setup is ambiguous, but if it had been in the form of a W, it would have been quite fully formed. Yes, then there would have been problems with defining the flag, but one can find such a picture in the market where there will be both a flag, a rectangle, and all the other patterns from the list. But in the setup that started a little higher, the rectangle was perfect.
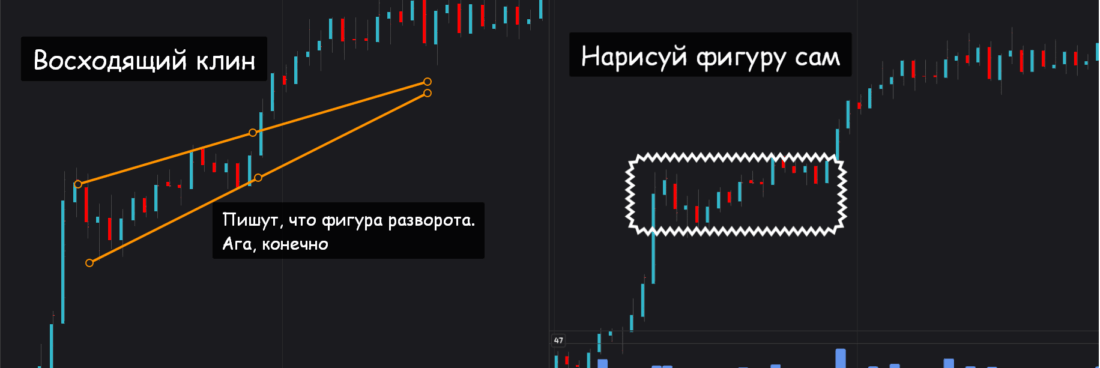
Separately, it is worth noting the "ascending wedge" pattern, which worked out differently from what is written in most manuals for novice traders. They write that it is an almost one-hundred-percent reversal pattern.
At the upper boundary of a balance, a wedge is a reversal pattern, even if this is the beginning of a balance at the end of an impulse (any balance begins when the quote is still expanding the boundaries, but that is another story).
But in the impulse phase, a wedge is always a continuation pattern. And an ascending wedge in the impulse phase speaks of the strength, speed, and potential of the move. We wrote earlier about how to determine the impulse phase. And an ascending wedge as a continuation pattern appears most often at the beginning of an impulse.
Concluding this subsection, I suggest that everyone independently draw a trend continuation pattern in this fragment. Or prove to me that I drew or named everything completely wrong. I am ready to accept any point of view.
What volume model stood behind all the graphical patterns?
After the start of the session and the gathering of the first liquidity, the quote moved into an impulse. How to determine the move into an impulse, see other articles on the site.
Here I will only indicate what impulse markers can be:
- The right time: the session open (Asia, Monday).
- The right volatility: a one-directional fast move with an increased travel range.
- The right place: work above a medium-term balance at the lows.
- High volumes for this time: vertical, cumulative (Weis Wave, which is a lot for this time) or horizontal in push and holding zones.
- In each candle at the beginning or in the middle there is a zone of imbalance (extremely low volume).
- VWAP: balance at the +1 deviation of the current session VWAP.
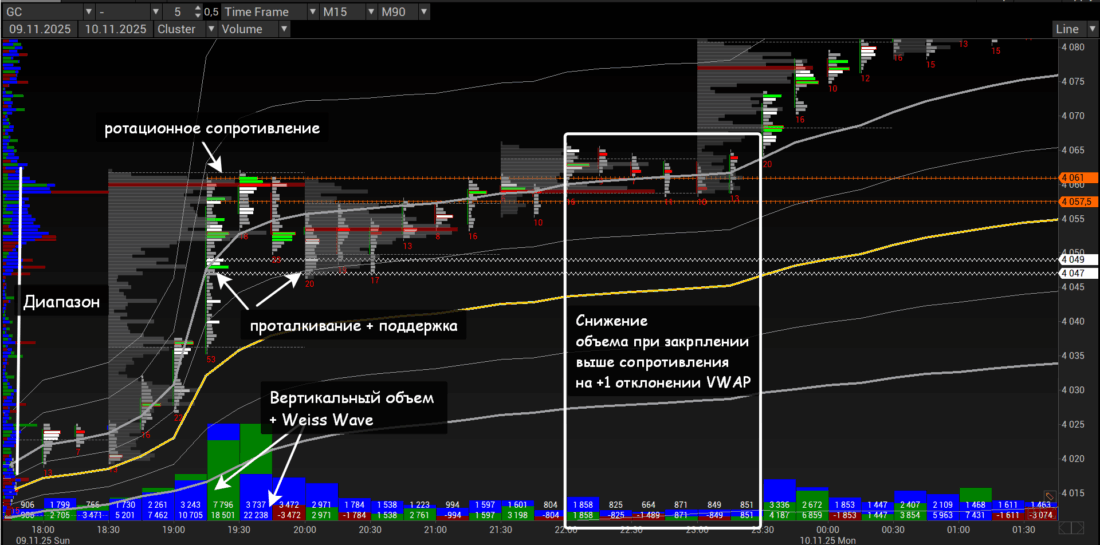
I will say right away that for convenience the Price Tick Size is 5 points, not 1.
In our case, the start of the move right from the weekly open goes on at very high turnover without any real opposing pressure from sellers (there are no market orders, and there are not many limits either).
By the time of our situation, the market had passed 575 points, having fully exited the balance. By the way, inside the balance the move in one direction during this period on gold was about 400 points.
Naturally, VWAP also rose together with the price. At the same time, volumes were initially accumulated (also at elevated turnover for this time, by the way) at VWAP and the +1 deviation with a gradual increase, which is a good signal for further growth.
Vertical volumes on M15 are very high and comparable to the volumes of the American session (the breakout candle is 7.8k, which is extremely much for this time, balance expansion and accumulation candles are from 3k, which is also very much).
The cumulative vertical volume (the Weis Wave indicator) amounted, by the time the extreme in the model we are analyzing was reached, to more than 22k contracts. Even in the American session such Weis Wave values do not occur every day, let alone Asia at the weekly open. Incidentally, on that same day it was precisely the Weis Wave on M15 that was very strong.

The first sellers in the most impulsive M15 appeared only at 4047-4049 (the white range, white and light green filters on the clusters). This place eventually became the middle of the candle, and therefore an expected support within the local auction: in an auction, price moves from the cheapest sale to the most expensive purchase and back again, and this is the cheapest sale, because it was here that the first accumulation of sellers appeared.
Local resistance was formed in the 4057.5-4061 range. The last volumes in the key candle passed here, and at the highs a classic accumulation formed with the largest red filters on M15. After that we see a transition into balance with protection of the potential support at 4047-4049, after which it became real support.
Thus, volume rotations passed on the market between 4047-4049 and 4057.5-4061.
The quote sharply returns to the volume highs, where red filters appear again, after which there is a breakout of the highs with another flat operation and a repositioning of the 4057.5-4061 resistance, which became support.
At the same time, the lowest volumes on M15 pass precisely after the exit with holding above 4057.5-4061. A decline in volumes is a strong signal of the start or continuation of a move within the session.
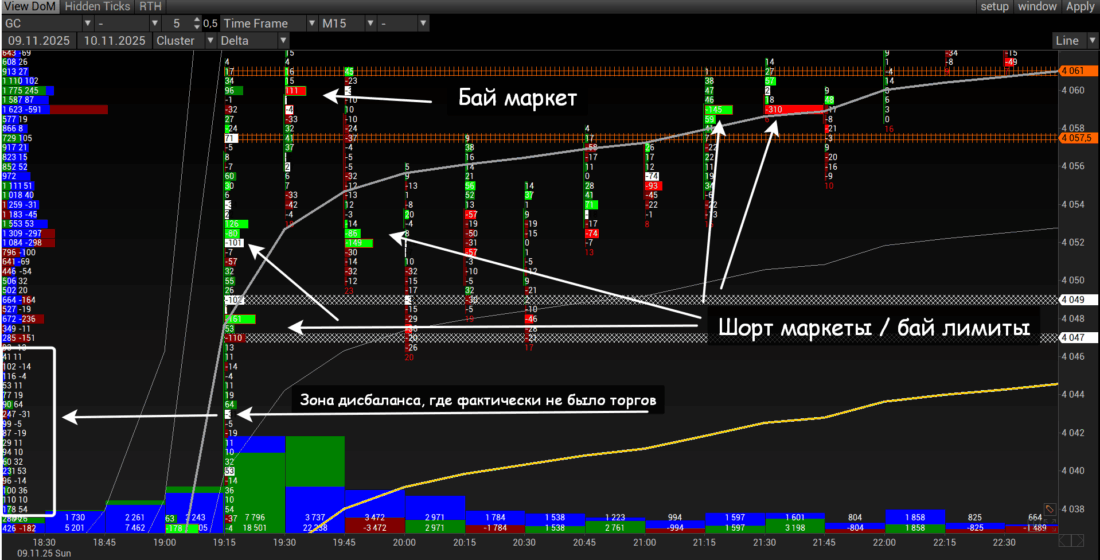
At the beginning or in the middle of each impulse candle there is an imbalance zone where volume is very low, while buyer pressure (buy delta, the predominance of asks over bids) at some prices reaches 100%.
In addition, buyers aggressively buy up short limits at any prices (the more expensive, the more) and slip in large buy limits at the extremes, and the closer to the extreme before the exit, the larger the buy limit.
To summarize
So, we see an extremely aggressive flat loading at the extremes, which is a very strong impulse signal.
Put more simply, on the outer clusters (here M90) there were about 150 minutes of balance formation with an exit above resistance and calm work for another 90 minutes. This is positioning within an impulse.
The aggression manifested itself in the speed of formation, in the absence of a second touch of support, and in the fact that they did not even touch VWAP from above, but only approached it (they touched the +0.5 deviation from the mean), after which they sharply began to grow at the +1 deviation.
The aggression was also noticeable in the large buy limits at the very highs.
The classic scheme of a flat balance for impulse continuation
Most balances in impulses are flat, i.e. liquidity accumulates essentially in one place. Volume rotations are either only on the lower TF or extremely weak on the current TF.
At the same time, the visual direction can be either toward the impulse or against it. What matters here is precisely the slowdown with the accumulation of some horizontal volumes, which in general may be slightly shifted to one side, but it is still an extreme.
The most common flat balances for the continuation of impulse dynamics at the beginning or in the middle of a move are short-term balances with a double or triple bottom.
Any fan of graphical analysis will say that these are classic trend reversal patterns, and in general will be right. It is just that this fan does not take market structure into account.
If the market is in an impulse phase, for example on M15, then a rectangle on M3 will take the form of a classic balance with a double or triple bottom.
What should be remembered if one does not want to understand the schemes, but there is a need to glance at them? Almost everything was said in the previous section and other materials on the site, and I will simply remind you that a good impulse implies no more than a 23.6% Fibonacci correction.
Even in our example, one can see a W-shaped structure, but, as indicated above, it can be found on a lower TF.
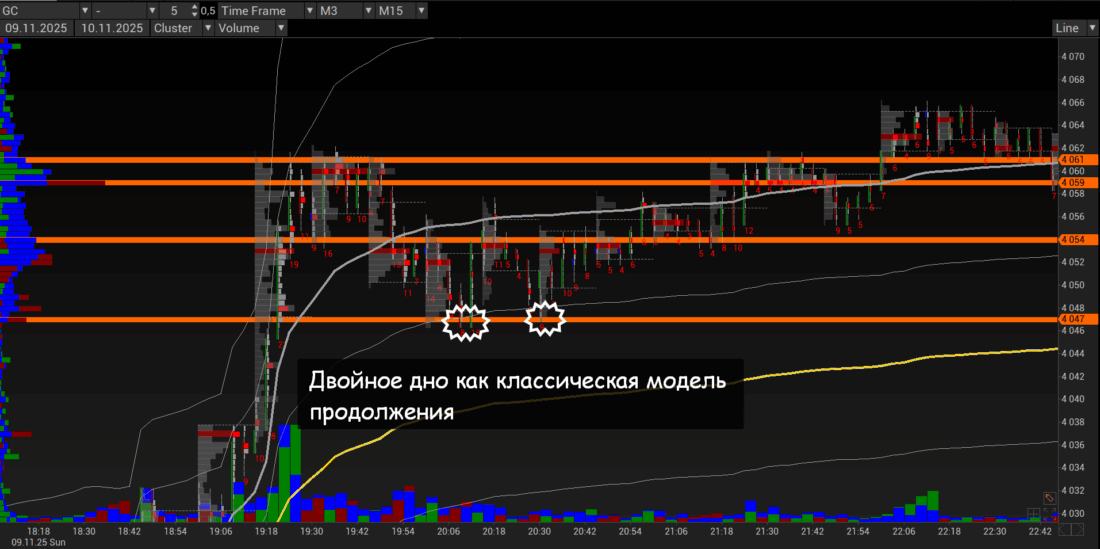
We see two touches of the bottom within the mini-balance on M3 before leaving for the upper boundary of the balance on M15. Of course, one can argue that on this timeframe the double bottom became a reversal pattern after the downward strike.
I will not argue. The small pullback was not a downward strike, but let us assume that it was. And the W-reversal here is precisely a continuation pattern, since on M3 the quote is clearly in the impulse phase.
How to determine the entry moment in a double / triple bottom?
- First, monitor the higher timeframe.
- Second, make sure that the quote does not go below the highest-volume candle: briefly jumping in for stops is possible, but accumulating liquidity in general is not.
- Third, it is important to look at the balance structure itself. This is a very difficult art, since one can get caught in a third bottom and, very rarely, even a fourth.
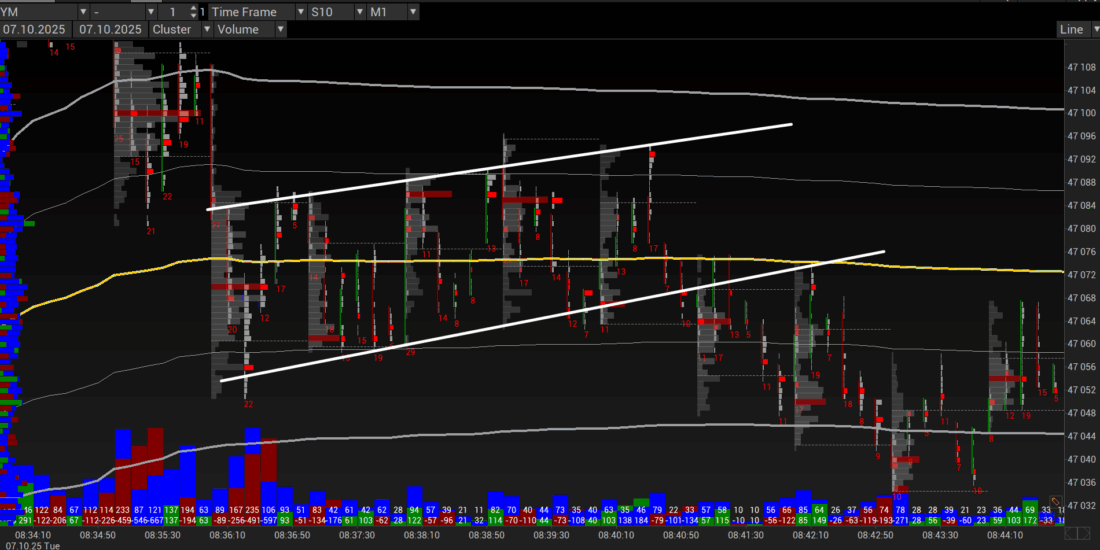
Here is an example of a trend continuation pattern with a triple top. Let everyone decide for themselves what pattern this is. But here I see a flat and an expansion. As usual, there is imbalance, attempts to hold the quote at the lows, and so on.
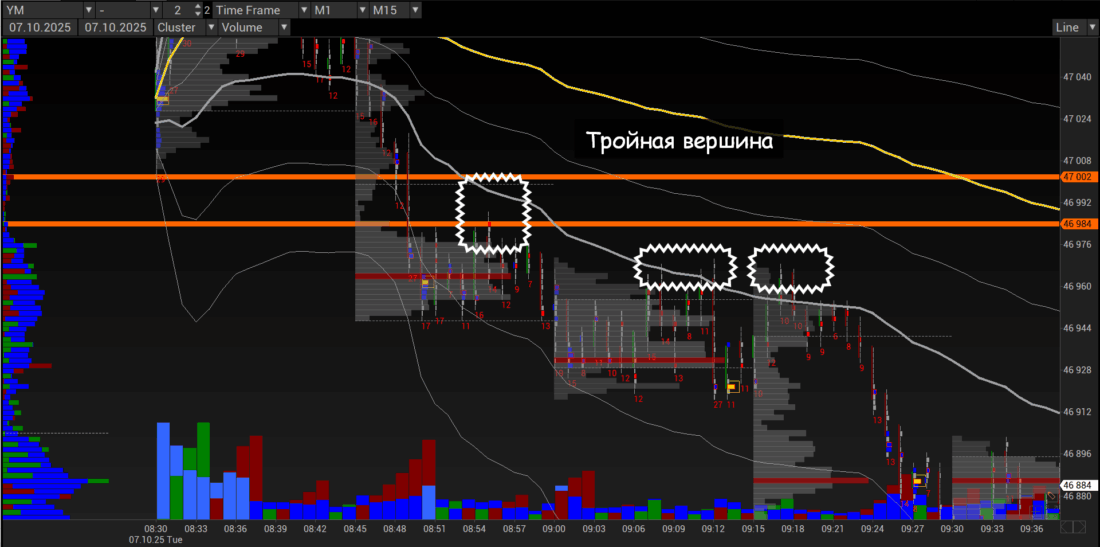
By the way, in this example I personally do not know how to evaluate the second top: as one top or as two. If as two, then there were four tops. In this respect, it was difficult to determine in the moment, but since we already know what liquidity repositioning looks like, there is no point in worrying.
Here is another moment where resistance was tested 4 times in a short market. The main thing here is to remember that if there was no cancellation after the 4th touch, then this is definitely before an exit into continuation. But we also remember the 3rd touch, and the 2nd. It all depends on the strength of the impulse. And everyone evaluates that for themselves on their own instrument.
Long corrective models
Flats with a shift
If we have defined the session as directional, this means that an impulse in such a session can be found only on a lower TF.
In general, the same regularities are there, they are just each weak and blurred. In sessions where volume is being repositioned (in our case from short to buy), after breaking VWAP from below it is worth waiting for a bounce from the +1 deviation. And that will be a continuation pattern. There may be variants in such schemes, but overall it looks exactly like this.
The main thing is that we again see a double bottom within a descending flag (the main chart is M1). And this is the trading of the imbalance zone.
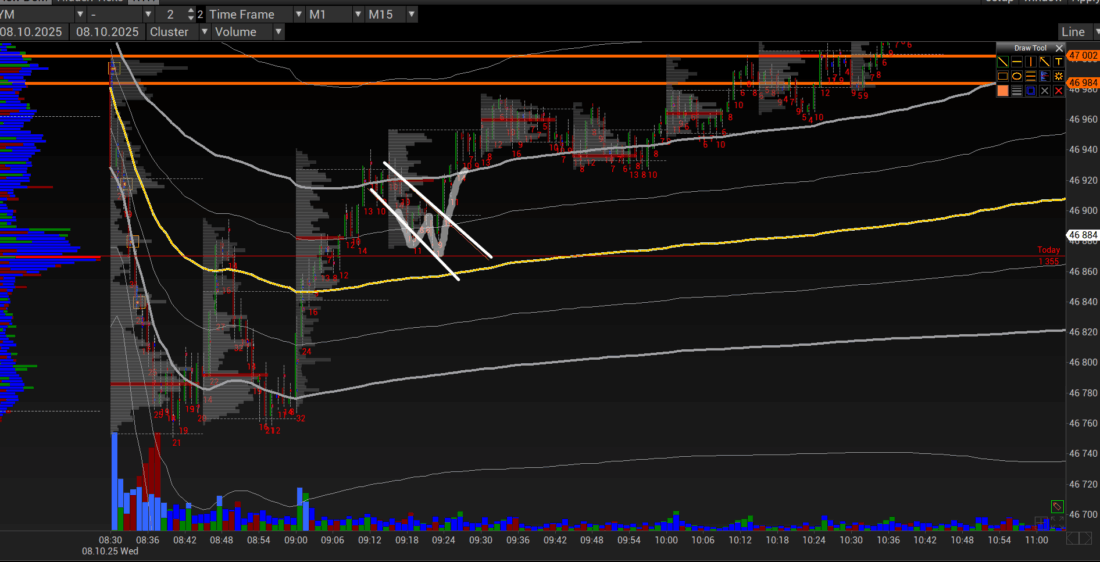
On the outer cluster (M15), we still see a collection of volumes ABOVE the previous accumulation. In short schemes this is a sell signal, but we have volume that was accumulated and confidently (impulsively) distributed in the initial balance, which indicates a high probability of loading precisely purchases, and therefore of the formation of a continuation pattern.
It is worth noting that the highlighted rectangle could have become not a rectangle but a reversal pattern (W). For this, it would have been necessary to go below VWAP and the volumes of the previous M15.
In directional moves that are not impulsive by nature, pullbacks are more often longer and are, in essence, the trading of the imbalance zone. Let us note that the trading of the imbalance also occurs in a normal impulse, but this is more like the third expansion.
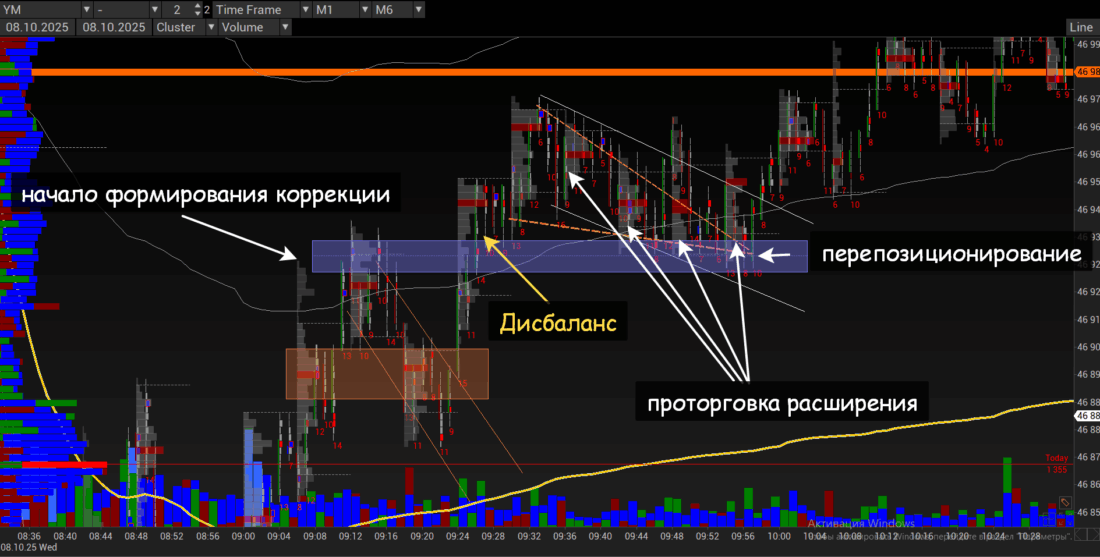
Let us analyze the same chart, but a different segment with a smaller outer cluster (M6).
We see that the descending wedge (one could also draw a simple rectangle, and if one tried, even a triangle, but that would violate many rules) is a smooth descent within which there are no impulsive strikes (in terms of a lower TF), but there is a prolonged loading of volumes relative to the previous expansion.
In other words, a new range is being traded and the previous price highs and, more importantly, volume highs are being tested for strength. After the check, one can safely speak of liquidity repositioning and the completion of the formation of a continuation pattern.
The “Two Steps” model
Let us analyze the previous example with a higher-order cluster in order to see the full picture.
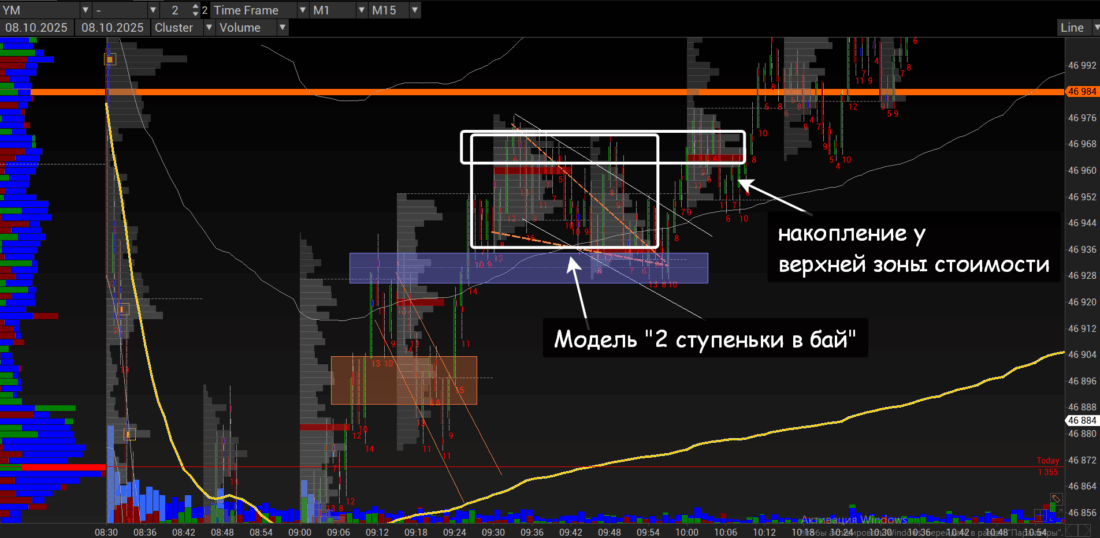
In this case, we see the classic add-on loading model "two steps." This model requires more time to form than a flat, and usually it is slightly deeper.
The model is characterized by a bell-shaped collection of volumes (a normal balance) with a very smooth downward shift in purchases and upward shift in shorts. The exit signal from the model is a move above the first step with the formation of a POC (the most traded price) at the level of or slightly above / much above the POC of the first step and the overall formation of a balance slightly above the first step.
This is in fact a marker of the completion of a corrective continuation pattern, no matter how one draws it.
The continuation model (false reversal) “Crown”
This corrective model, quite popular in a correction prolonged in time, is distinguished by a hint of a possible reversal.
In fact, at the initial stage of development one can see a V-reversal or H&S in the model. The key sign of reversal models is a double imbalance (that is, an imbalance on the upward strike and an imbalance on the downward strike) and the presence of accumulated liquidity.
How can one identify the “Crown” continuation when it seems that there is a reversal here, but there is still no exit upward from the descending channel (which itself is most often the “Rectangle” continuation pattern)?
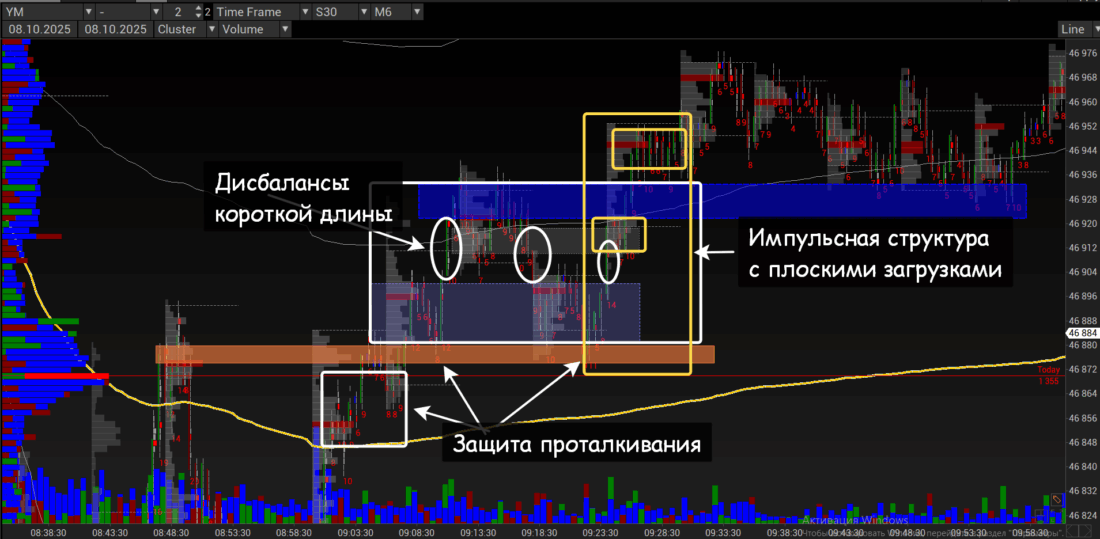
- The imbalance ranges are relatively short and often do not exceed the balance ranges in length.
- The accumulation above has not a flat but a rotational appearance. The lower rotations partly trade the initial imbalance. In a true “Crown,” the imbalance in the opposite direction is much longer.
- Within the impulse, the right part of the “Crown” (the right shoulder when looking for H&S) accumulates in the same place as the left (the left shoulder when looking for H&S).
- There is confident protection of volumes on the slightly lower push.
- A sharp impulse (again the presence of imbalance!) with the accumulation of volumes in a flat under key resistance followed by a sharp breakout with holding. In fact, this is a typical impulse structure, just in this case on a lower TF.
Conclusion
Drawing continuation patterns in technical analysis is a thankless task. The same Alexander Elder recommends combining different patterns on different timeframes, after which one can, with a slightly greater degree of confidence, make sure that what we see is indeed a continuation pattern.
From the point of view of volume analysis, continuation patterns are flat balances at the extremes. Visually, they may have a slightly descending or slightly ascending appearance.
In the volume analysis of any continuation pattern, the following parameters are important: exit from the accumulation of the higher timeframe with holding, that is, the accumulation of liquidity at highs/lows; the presence of imbalance zones in impulse candles with very high volume; the holding of liquidity on the push (it is placed above the imbalance); work on 1/-1 deviations from VWAP; the growth of Weis Wave.
In a prolonged correction at the late stages of impulse formation or in another situation that has a trending look, we monitor especially carefully the protection of volumes on the push and the holding above / below rotational volumes.
I will note separately that deeper pullbacks indicate weakening dynamics and are the beginning of the formation of a certain medium-term balance relative to the trading timeframe.
Respectfully,
Ivan Rusin