
MQL5: Writing an Indicator and Expert Advisor Based on the Correlation Index

When opening a position on forex, we assume that demand for one of the pair's currencies will grow and, as a consequence, the exchange rate change will lead to an increase in floating profit. Roughly speaking, before entering the market we determine which of the currencies is "stronger," and accordingly which factors will move the price first of all. Forex, by its nature, does not provide the necessary tools for such analysis, so traders have invented a mass of ways to justify the very concept of strength on the basis of secondary signs. Some of them even gave rise to a separate doctrine, not far removed from astrological forecasts, mistakenly not called "humanitarian analysis".
Drawing an analogy, if the temperature of the universe on a large scale were absolutely the same, life would not exist. The market also exists due to constant motion: trading opportunities appear only when an imbalance of supply and demand arises. Imagine for a moment that all currencies on forex were equivalent in value, equal, for example, to one: there would be nothing to trade.
This material is aimed at ordinary traders, and believe me, we all are exactly that here, unless you of course do not own your own trading venue, in which case all insider information is open to you. The forex market in this approximation is a black box. Proceeding from this, we will try to identify the strong and weak sides of currencies only on the basis of information from sources available to us, and already on the basis of these assessments make trading decisions. The idea is not new at all, but the approach that will be used in the article is not widely applied. If we could take into account all factors affecting changes in the relative value of currencies, creating a profitable strategy on their basis would be a trivial task, even without possessing a fully closed system.
Today we will try to write our own tool: an Indicator and Expert Advisor based on the Correlation Index of currency pairs. And at the same time we will get some programming practice.
Law of Conservation of Energy

A closed system assumes that money does not go beyond the boundaries of the system. We can imagine a closed system as an isolated bank vault where funds can move from cell to cell, but cannot leave the bounds of the given room. Accordingly, having calculated the disappearance of a certain amount of money, we have an exact idea of the amount of free funds that will later be redistributed among the remaining cells.
If an ideal closed system existed on forex, we would observe a precisely tuned relationship: it left here, it arrived there. This means that the growth of one currency should provoke the fall of another, and so everywhere. Thus, by building a synthetic instrument from the "market basket," we obtain a fail-safe trading system based on the natural flow of money. Unfortunately, the movement of currency pairs does not follow exact laws, and the real market is far from the concept of a closed system.
Sources of Information

For lack of full-fledged insider information, most rely on fundamental factors, saying that if the economy of a certain country suffers, the value of its currency falls. In reality, however, various economic indicators, trading session times, purely artificial manipulation of the economy, political events, and even just rumors from large investors and financial institutions can strongly affect a currency's rate. Cause-and-effect relationships in this case are very easy to find after the fact, but predicting the degree of their influence in advance is extremely difficult. The panic that arises at such moments makes finding patterns even harder, which is exactly why many prefer not to trade the news.
Reading tea leaves has never been so entertaining. For example, some company went bankrupt, and funds flowed like a mountain reservoir through naturally formed channels, spilling through age-old cracks while simultaneously evaporating the remnants into the atmosphere. And our task here is to track these transformations with sufficiently high accuracy, so that both the strength of these factors and their very presence are indisputable proof that they moved our main tool for generating income: the market price.
The market's reaction in many cases is directly opposite to the forecasts that existed, which rather leads to the thought: what exactly are we studying? In this connection, in the order of masons this type of analysis is usually associated not with macroeconomic events, but with determining the main global trends.
Unlike the stock market, on forex everything is somewhat more complicated. Yes, perhaps we can determine some potential of a currency, and if the forecast comes true, an important level will be broken, or a short-term trend will change. Relying on experience and a feel for the market is not worth it here: traders possessing such abilities long ago left the market and teach their experience to less experienced individuals.
Then the question arises: why analyze trends in the economy if the price already speaks for itself? As is known, the most important indicator on forex is price. However, we do not know the exact volumes, nor the number, nor the timing of trading operations carried out. At the same time, we consider price a fair assessment of the current state of affairs, despite its uncertain nature. Such a statement follows from the very definition of a distributed market: there is no single party controlling the value of the traded asset. Therefore, solely for simplification, we will take this statement as truth.
Types of Existing Indices
The fairest estimate of a currency's value is considered to be the calculation of indices based on the balance of payments. However, the question of whether the nominal weight of currencies depends on the trade balance between countries still remains open. It is obvious that this value is not fixed and changes constantly. Therefore, when calculating indices, analysts often arrive at some simplifications, removing unnecessary variables from the equation. In general, there are several generally accepted ways on the currency market to assess potential and determine the trend.
Let us note three such methods:
- A weighted average index corresponding to foreign trade turnover indicators. Everything is simple here: it would seem, we take into account the currencies of all countries conducting the most active trade and calculate the weighted geometric mean of the resulting basket. This method is officially recognized and relies on the real amount of currency in circulation.
- Calculation of the geometric mean of all crosses. Since we are unable to calculate trading volumes on forex, we accept in advance all pairs participating in the calculation as instruments with approximately equal trading volume. Again, we do not take all currencies into account, but only the most popular ones.
- Calculation of a currency index by the growth rate of related currency pairs, using an auxiliary indicator for this. This is the most common way of calculating currency strength on the basis of available prices. For the calculation one can use any accessible technical indicator, as a rule based on a moving average, which we will subsequently use as the starting point of our calculation.
We, however, will use a somewhat different approach: to calculate dependencies between currency pairs, and on this basis build assumptions about the strength of influence of one monetary unit or another. That is, in order to determine the strength of a particular currency, we will determine their cumulative influence. Each pair will have one common currency, from which it follows that the greater the dependency value, the greater the influence exerted by the common currency. To evaluate dependencies, we will calculate correlation. The final coefficient will include the geometric mean of pairwise cross correlations.
Toolkit

Our task is to determine how synchronously the pairs move and, accordingly, what influence the leading currency exerts. We will use correlation as the best-known way of determining dependencies between two time series. In order not to depend on a single calculation method, we will calculate simultaneously by Pearson and by Spearman. By its characteristics, the Pearson CC is not resistant to time-series outliers. In turn, Spearman rank correlation can be applied to almost any series. Therefore, for decision-making we will use both one method and the other.
So, we have a list of the main trading instruments that will take part in the calculations. The number of instruments should not radically affect the result, but only increase its accuracy. That is, when adding or removing currencies, the forecast should remain roughly similar. Of course, the most popular currencies will still strongly affect the result, so some minimum is still worth having.
Writing an Indicator

Proper preparation of the source data is an extremely important process. Any inaccuracy at this stage can radically affect the final result, making it useless. We need to solve two problems: data history availability and time synchronization. We will deal with loading the history a little later, but first, the indicator needs to be initialized, that is, to process the input parameters and mark up the indicator buffers.
int OnInit() { currenciesToSymbols(Currencies); ... }
The first thing we do is initialize the list of symbols. To begin with, we split the string into separate currencies and remove extra spaces. At the next step, we assemble currencies into pairs, after first checking whether the currency pair is present in Market Watch.
void currenciesToSymbols(string currs) { string arr[]; StringSplit(currs,',',arr); int sz=ArraySize(arr); amountCurrs=sz; for(int i=0; i<sz; i++) { // remove spaces StringTrimLeft(arr); StringTrimRight(arr); // convert to uppercase StringToUpper(arr); pairs.currency=arr; } // initialize the counter int amount[]; ArrayResize(amount,sz); ArrayInitialize(amount,0); string s; for(int i=0; i<sz; i++) { for(int j=0; j<sz; j++) { // assemble all possible pairs from different currencies if(i != j) { s=pairs.currency+pairs.currency; // if the symbol is real, remember it if(SymbolSelect(s,true)) { pairs.symbols].name = s; pairs.symbols].name = s; amountReal=++amount; amount++; } } } } }
Next comes the initialization of the indicator buffers.
int OnInit() { ... // one buffer for each currency for(int i=0; i<amountCurrs; i++) { SetIndexBuffer(i,buffer.history); PlotIndexSetInteger(i,PLOT_DRAW_TYPE,DRAW_LINE); PlotIndexSetDouble(i,PLOT_EMPTY_VALUE,0.0); PlotIndexSetString(i,PLOT_LABEL,pairs.currency); // fill the buffer-timeseries with empty values ArrayInitialize(buffer.history,0.0); ArraySetAsSeries(buffer.history,true); } // fix the scale IndicatorSetDouble(INDICATOR_MAXIMUM,1.0); IndicatorSetDouble(INDICATOR_MINIMUM,-1.0); ... }
Considering the complexity of the calculations, on large volumes of data the indicator may freeze for quite a while. To prevent this from happening, we will draw through a timer, outputting the result in parts, starting from the first (last) bar on the chart.
EventSetMillisecondTimer(10);
Because of hardware limitations, the timer cannot run faster than once every few dozen milliseconds. Therefore, we will split the calculations into 50 ms chunks. For synchronization, we use the opening time of the last bar of the timeseries as a reference point and move deeper into history until the time limit is reached. After that, we redraw the chart using ChartRedraw(). Thus, drawing will happen not all at once, but gradually, from right to left, almost instantly opening access to the freshest data.
void OnTimer() { ulong st=GetMicrosecondCount(); // if this is the first launch if(currTime==0) { // get the time of the last bar on the chart currTime= (datetime) SeriesInfoInteger(_Symbol, _Period, SERIES_LASTBAR_DATE); for(int l=0; l<amountCurrs; l++) { ArrayInitialize(buffer.history,0.0); } // find the start date of drawing if(Count>0) { datetime tm[]; CopyTime(_Symbol,_Period,Count-1,1,tm); startTime=tm; } else startTime=StartDate; } // when everything is drawn, keep tracking the current bar if(currTime<startTime) { startTime=(datetime) SeriesInfoInteger(_Symbol,_Period,SERIES_LASTBAR_DATE); currTime = startTime; } // do not spend more than 50 ms at a time while(currTime>=startTime && GetMicrosecondCount()-st<MAX_TIMER) { for(int t=0; t<amountCurrs; t++) { // get the bar by time int ind=getBarIndexByTime(currTime); // main returns the average correlation for the currency on the specified bar buffer.history=main(ind,t); } currTime-=PeriodSeconds(); } // force a redraw ChartRedraw(); // if the 50 ms limit is not exhausted, wait a little longer int diff=(int)(GetMicrosecondCount()-st); if(diff<MAX_TIMER) { Sleep(diff); } }
Unfortunately, the indicator timer does not work in the strategy tester, and on small periods it is excessive altogether. Therefore, for compatibility we will still leave the OnCalculate function, which will be enabled by a special TestMode flag. This flag will be needed to use the indicator in an expert advisor; for real use, it is better to leave it false.
int OnCalculate(const int rates_total, const int prev_calculated, const datetime &time[], const double &open[], const double &high[], const double &low[], const double &close[], const long &tick_volume[], const long &volume[], const int &spread[]) { if(TestMode) { int pos=rates_total-prev_calculated; if(prev_calculated==0) { if(Count>0) { datetime tm[]; CopyTime(_Symbol,_Period,Count-1,1,tm); startTime=tm; pos=Count-1; } else pos=getBarIndexByTime(StartDate); for(int l=0; l<MAX_SYMBOLS; l++) { ArrayInitialize(buffer.history,0.0); } } for(int ind=pos; ind>=0; ind--) { for(int t=0; t<amountCurrs; t++) { buffer.history=main(ind,t); } } } return rates_total; }
So, the main calculation takes place in the main function, which receives the bar index and the currency number. If there is not enough history in the terminal, the indicator will try to load it, after which it will attempt to copy the data. Next, if necessary, we reverse the price data and choose the correlation calculation method. The function returns the geometric mean of all correlations.
double main(int index,int currency) { for(int k=0; k<amountReal; k++) { // trying to load history if(historyLoaded(pairs.symbols.name,_Period,startTime)<0) { Print("Waiting for history to load."); return 0; } // trying to copy history if(CopyClose(pairs.symbols.name,_Period,index,Depth,pairs.symbols.history)<Depth) { Print("Error loading history."); return 0; } } double c=1; int sz=0; for(int j=0; j<amountReal; j++) { for(int k=0; k<amountReal; k++) { if(j!=k) { // invert prices if the base currency does not match the selected one if(StringSubstr(pairs.symbols.name,0,3)!=pairs.currency) { sz=ArraySize(pairs.symbols.history); for(int v=0; v<sz; v++) { pairs.symbols.history=1.0/pairs.symbols.history; } } if(StringSubstr(pairs.symbols.name,0,3)!=pairs.currency) { sz=ArraySize(pairs.symbols.history); for(int v=0; v<sz; v++) { pairs.symbols.history=1.0/pairs.symbols.history; } } // Pearson and Spearman correlation calculation // Spearman if(Type==Spearman) c*=(1+getSpearmanRankCorr(pairs.symbols.history,pairs.symbols.history)); // Pearson else if(Type==Pearson) c*=(1+getPearsonCorr(pairs.symbols.history,pairs.symbols.history)); } } } // return the geometric mean of the coefficients return pow(c, 1.0 / (amountReal * (amountReal - 1))) - 1; }
The number of lines corresponds to the number of currencies specified in the input parameters. You can see the currency name in the tooltip when you hover the mouse cursor over the line.
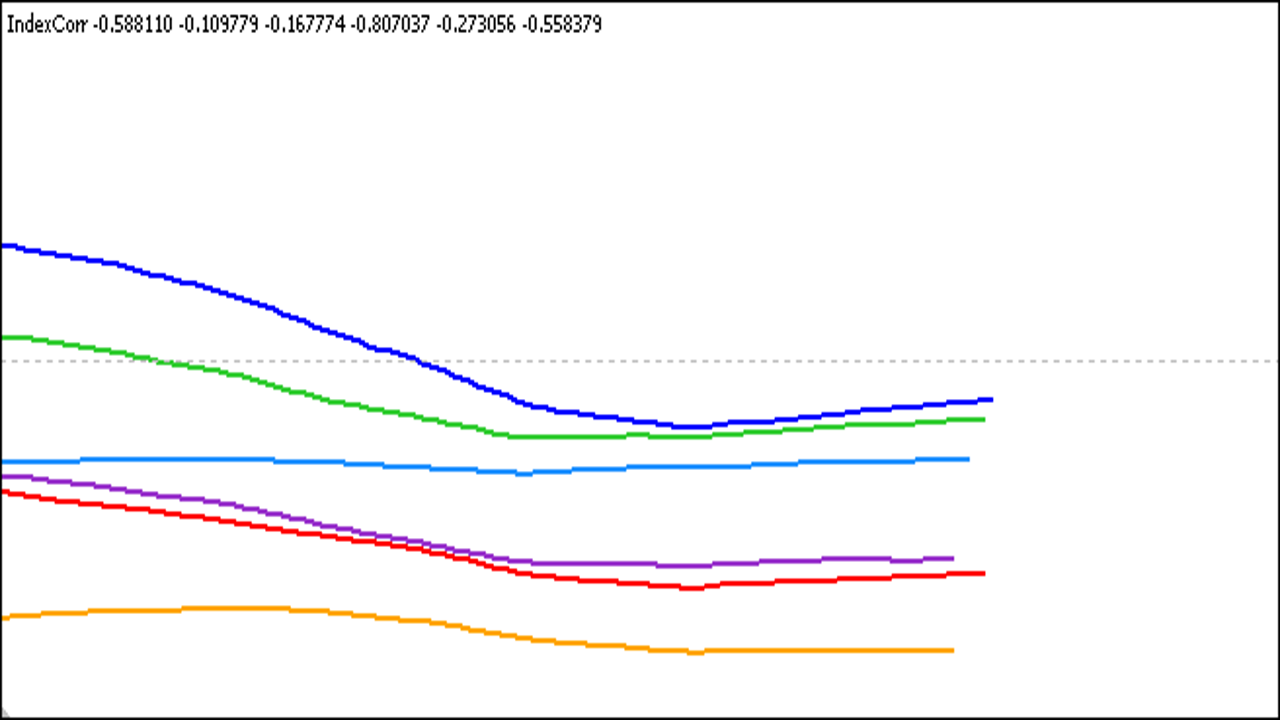
Since the lines move synchronously most of the time, sometimes the indicator signals become difficult to distinguish. Therefore, let us add the OnChartEvent function with handling of the CHARTEVENT_MOUSE_MOVE event to the indicator. This is needed in order to highlight individual lines when you hover the mouse over them.
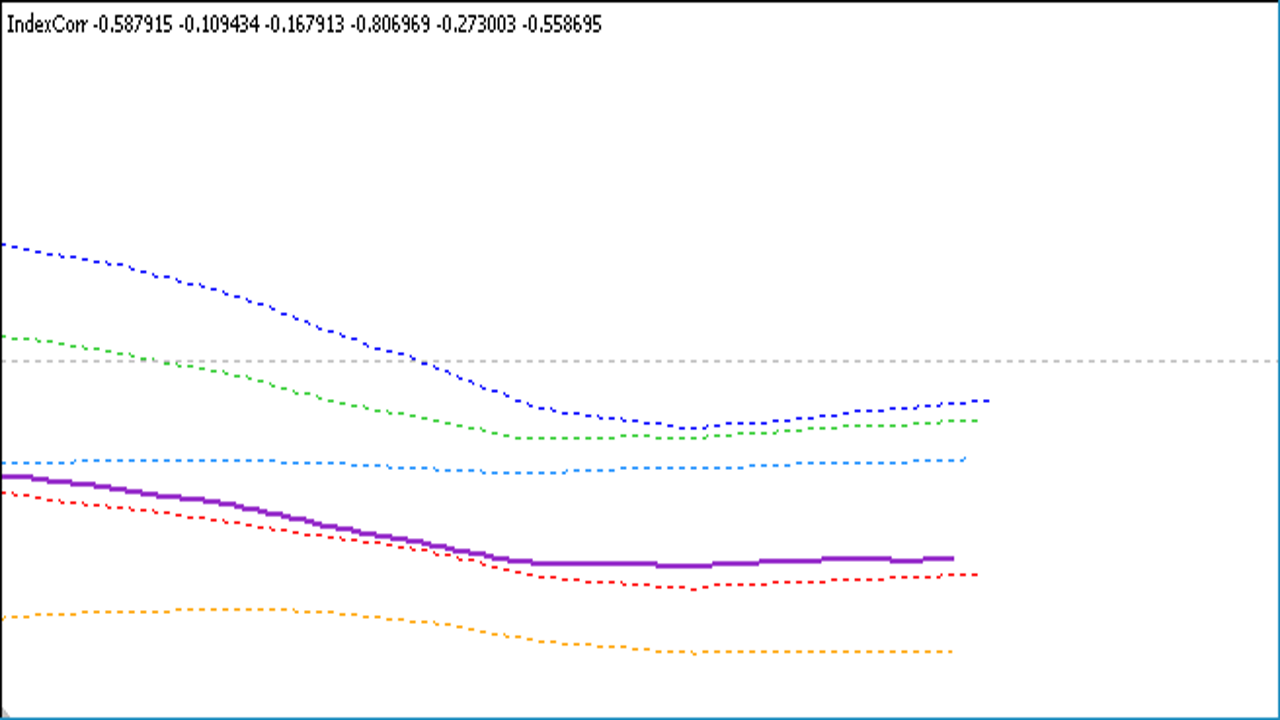
void OnChartEvent(const int id,const long &lparam,const double &dparam,const string &sparam) { if(id==CHARTEVENT_MOUSE_MOVE) { // store the coordinates and convert pixels to time/money int x = (int) lparam; int y = (int) dparam; datetime time; double price; int sub; ChartXYToTimePrice(0,x,y,sub,time,price); int lines=0; int bar=getBarIndexByTime(time); int sz; if(bar>=0) { for(int t=0; t<amountCurrs; t++) { sz=ArraySize(buffer.history); if(bar>=sz) break; // check whether the line is close to the cursor and highlight it if(buffer.history+0.03>price && buffer.history-0.03<price) { PlotIndexSetInteger(t,PLOT_LINE_WIDTH,2); PlotIndexSetInteger(t,PLOT_LINE_STYLE,STYLE_SOLID); lines++; } // dim all the other lines else { PlotIndexSetInteger(t,PLOT_LINE_WIDTH,1); PlotIndexSetInteger(t,PLOT_LINE_STYLE,STYLE_DOT); } } } if(lines==0) { for(int t=0; t<amountCurrs; t++) { PlotIndexSetInteger(t,PLOT_LINE_WIDTH,2); PlotIndexSetInteger(t,PLOT_LINE_STYLE,STYLE_SOLID); } } ChartRedraw(); } }
Now when you move the mouse over the chart, the index line under the cursor will be highlighted against the others, thereby simplifying its analysis.
Writing a robot
Since the indicator does not show the direction of movement, it can only be used as a filter for an existing system. For the test, let us take a simple trading strategy based on RSI. The entry rule is an exit from the overbought/oversold zone. The filter in the form of the correlation indicator will decide whether to enter or not.
First, let us test the expert advisor without any filters. This will give us the necessary benchmark against which the improvement or deterioration in the results of the second test should be noticeable. As we can see, the expert advisor does not know how to make money, and RSI alone is clearly not enough for a stable trading system.
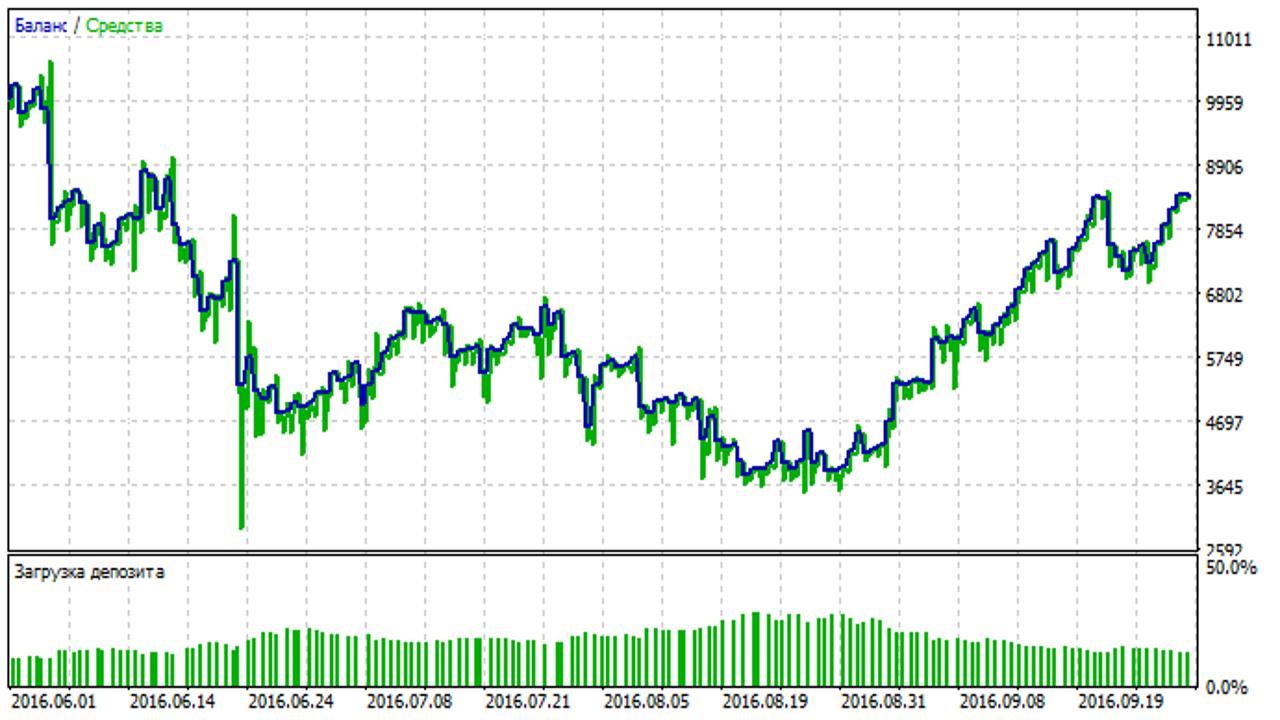
Then, let us try adding a filter. The conditions are also simple: when the correlation coefficient exceeds 0.5, we consider the currency strong enough and give the green light to enter. At the same time, the conditions for entering the market remain the same. As we can see, the number of trades has dropped significantly. But the chart itself looks more stable, and in the end it even shows a profit.
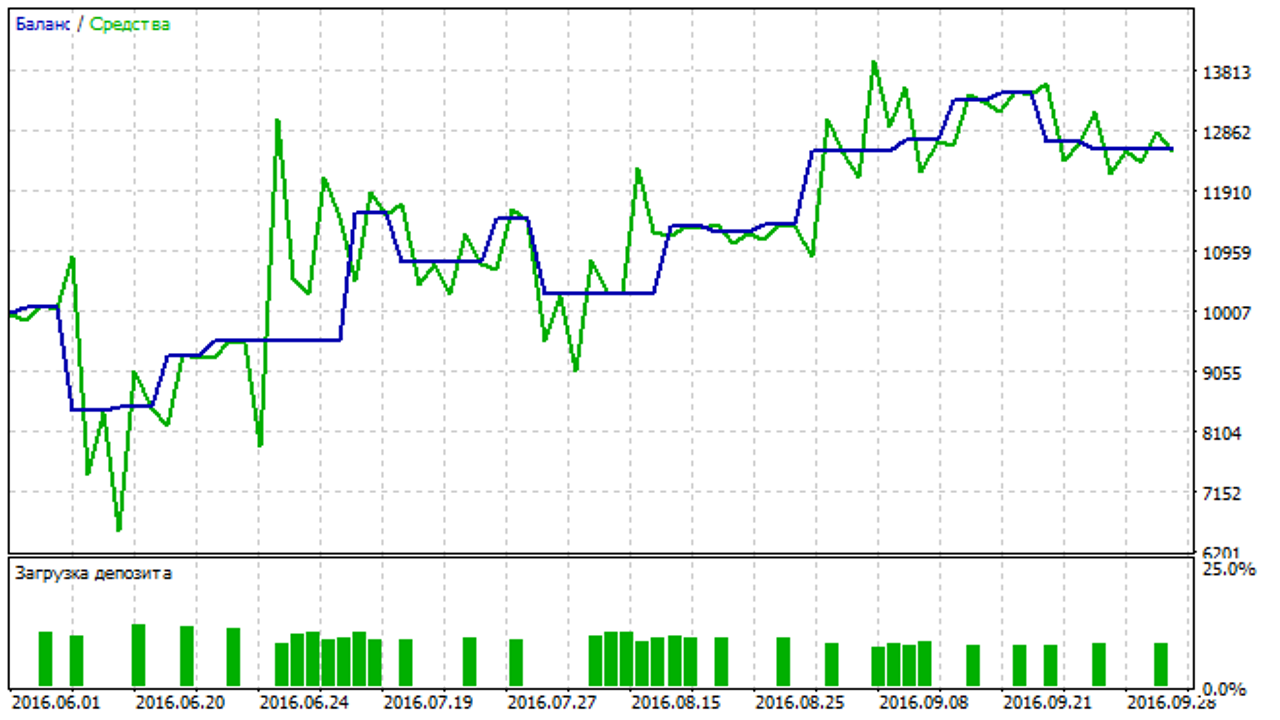
Considering that this is a very superficial test, the results could have been even better. The difference between the two tests is obvious, as accounting for the influence of currency pairs removes short-term trends from trading, so the bets are placed only on strong currencies. Thus, we get rid of knowingly false bets by trading in only one direction.
Conclusion

Calculating linear correlation is not the most reliable way to determine patterns. The fact that pairs with the euro move synchronously for some time does not mean that there is a direct relationship between them, but that is what is assumed. There is a sensible element in the method, this is confirmed by tests, but the method of determining dependencies is not the only correct one. The entire calculation takes place in the main function, and you can change its output by adding your own formula; there is plenty of room for experiments. In this case, the analysis of average correlation helps determine the long-term nature of the trend.
Download the expert advisor and indicator files

Sincerely, Alexey Vergunov TradeLikeaPro.ru