
Moving Averages

Good day. Today's video lesson belongs to the category of "forex for beginners," and hard-core trading pros are unlikely to hear anything new here. In the comments I was asked several times to talk about the seemingly banal Moving Average indicator (moving average). Many beginners do not understand which type of moving averages and with what period to use. In this lesson I tried to explain in the most accessible form the principles of working with moving averages when trading Forex.
Hello. Today we will introduce you to the concept of the moving average. This is one of the oldest technical indicators and, perhaps, the most popular and most frequently used, since a huge number of other indicators are built on its basis.
A moving average is nothing more than the average price of a currency pair, in the case of Forex, over a certain period of time expressed in the number of candles or bars. For example, let us plot in red on the chart a moving average with a period of 8.
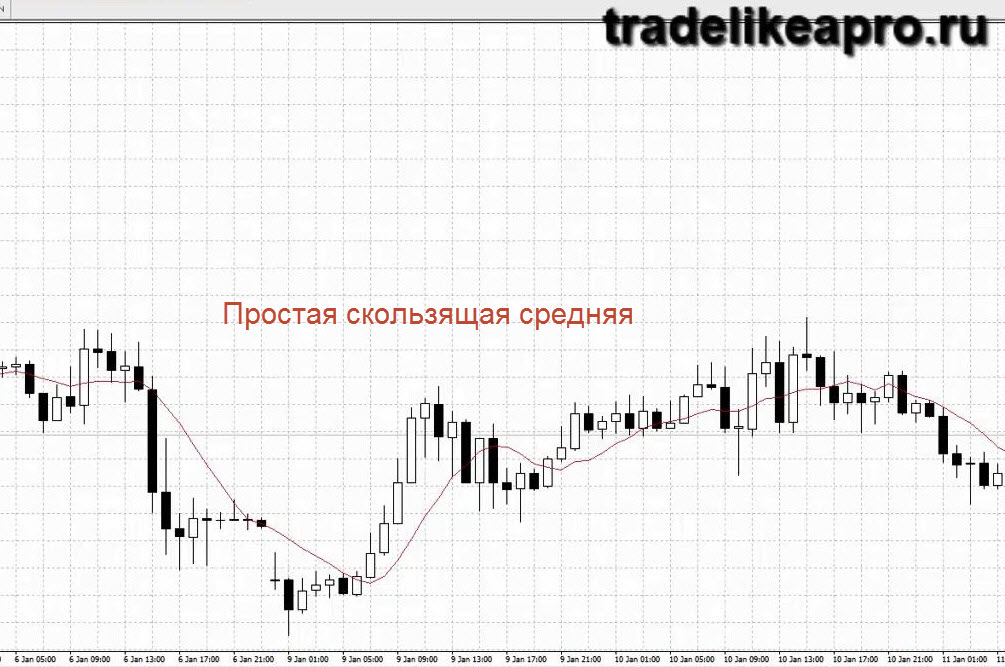
It displays the average price value for the last 8 candles. Naturally, when 8 candles pass, it removes the first candle from its calculations and begins the calculation from the second through the ninth. If we set the period not to 8 but to 21, then the average price of the currency pair for the last 21 candles will be calculated.
Thus, we can see the general direction, which looks somewhat smoother and more obvious than a regular chart. In general, it is customary to believe that if the price is above the moving average, then it is an uptrend; if it is below the moving average, then it is a downtrend. At the same time, the higher the period of the moving average, the more long-term the trend. For example, with a moving average period of 21, we can say that if the price is above it, then this is a rather short-term uptrend.
If the moving average period is much larger, say 200, and the price is above the moving average with a period of 200, then we can say that there is a serious uptrend. If the price is below the moving average with a large period (for example, 200), then we understand that there is a fairly serious downtrend.
In other words, the larger the period of the moving average, the less agile it is, because it has to calculate the average value over the most recent candles (in our case 200). That is a lot. Accordingly, the larger the period of the moving average, the more important it is in the long-term perspective.
There are several types of moving averages. When you apply the indicator to the chart, you are offered to choose the period and the shift. For example, if you need to shift the moving average a little lower or a little higher, make two moving averages and thus build a channel. But usually the shift is used rarely. Next, we can choose to which part of the candle to apply the moving average, that is, the average of what will be calculated. By default, the average of the closing price, Close, is calculated.
You can make it calculate the average opening value, the average point of High, the highest point of the candle, the lowest point, Low, you can calculate the average from the midpoint of the candle, and so on. In addition, we can choose the color, the line thickness, what it will be like: dashed or dash-dot.
There are several types of moving averages. The first is simple, exponential, smoothed, and weighted (linearly weighted, to be precise, but usually they simply say weighted). Our chart shows a simple moving average. Let us plot on the chart an exponential average with a smaller period, not 200 but 21, in red. For comparison, let us draw a rising moving average with the same period, but in blue. So, the blue one is simple, with a period of 21, and the red one is exponential with a period of 21. So what is the difference?
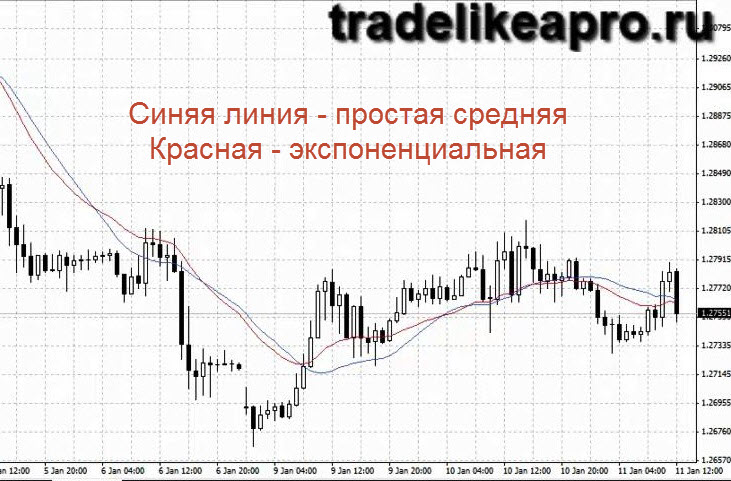
The exponential average gives more significance to the latest data. In our case it assigns values in descending order starting from the last bar.
The last bar receives the greatest significance. Further on, down to 1 of the 21 bars, the significance decreases, and the exponential average becomes less sensitive. On the last bar it is the most sensitive and less sensitive on the penultimate one, and so on, all the way to the very first bar (depending on what period you have set).
The simple moving average assigns equal significance to both the last bar and the first one. Therefore, the exponential average reacts a little faster to the changes that occur on the last bar of our chart. And for this reason it is used much more often than the simple moving average. As a rule, for small periods the exponential moving average is used.
But for longer periods, 200, 265, it is quite possible to use a simple moving average, since the difference between it and the exponential one will be insignificant. Let us add one more moving average, this time a weighted one, with the same period, 21, and make it dark green. This weighted average has the same period, 21, as our previous lines. It is a linearly weighted one.
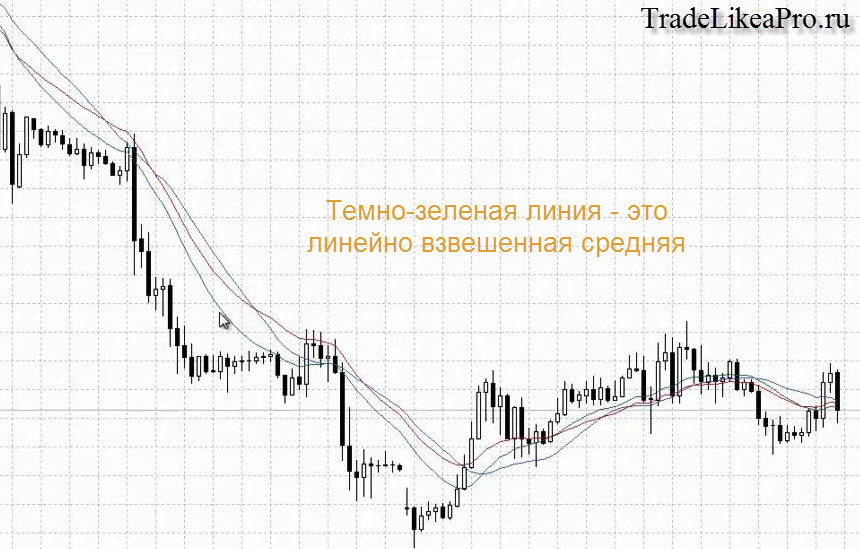
How does the linearly weighted average differ from the simple exponential one? It is, if I may put it this way, another version of the exponential moving average. It distributes the significance of the bars somewhat differently, but it also gives special significance to the last bar and assigns different weights to the bars. If in the exponential average the significance of the bars decreases more smoothly, then in the linearly weighted moving average the significance of the bars decreases more sharply, because it assigns weights to various bars, n.
If, for example, our last bar is 4n, the penultimate is 2n, the next bar is n, and then n divided by two. That is, it is sharper and more dependent on price fluctuations. For this reason it is not very popular, and therefore the linearly weighted moving average is used extremely rarely.
And the last calculation type we have left is the smoothed moving average, Smoothed moving average. Let us mark it on the chart in gold. Although, as we can see, the gold smoothed moving average has the same period as the previous ones, the simple and weighted moving averages, the gold smoothed moving average looks as if it has a larger period, although the periods in all our calculations are the same.
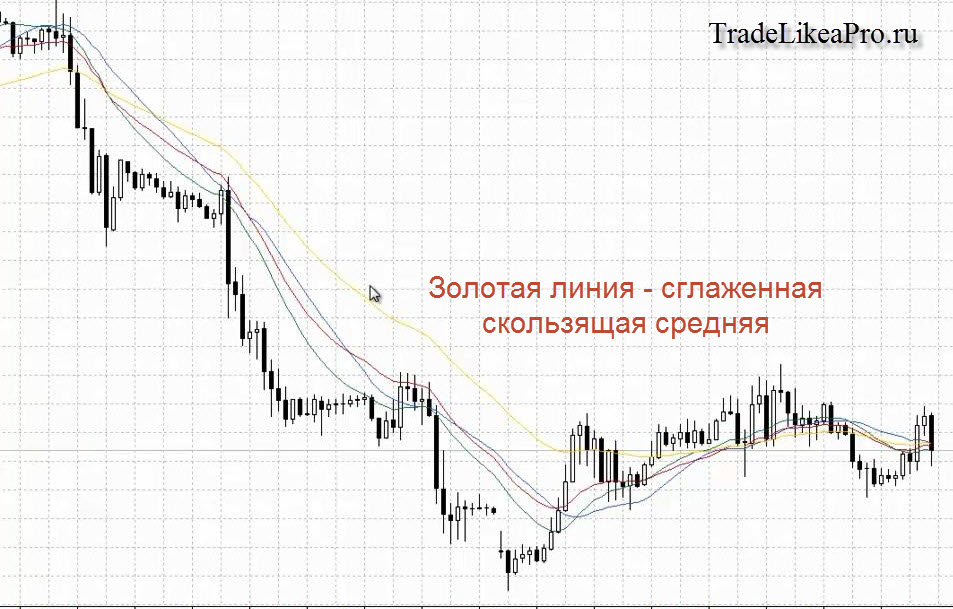
Why does this happen? The smoothed moving average lies between the simple moving average and the exponential one. But at the same time, if the simple moving average each time takes into account only the specific time period that we set (in our case 21 bars), then the smoothed moving average, while taking into account the time period that we set, also takes into account previous bars that are, as it were, outside the period that we set, which in our case is 21. This moving average also considers previous bars, takes them into account, but gives them less and less significance as they move further away from the present moment. Thus, we get a smoother variant that is suitable for identifying some long-term trends. Accordingly, it is desirable to set a longer period.
It follows from this that the smoothed moving average automatically increases the period that we set in the settings and thus becomes more stationary than other types of moving averages. It is used very rarely. In my practice I have hardly ever encountered it being used. Nevertheless, this information may not be useless.
So, which type of moving average should be used? Most often, traders prefer to deal with the exponential moving average, and for longer periods to use the simple moving average. You can forget about the other types.
You should understand that the larger the period, the more motionless the average is and the greater significance it has if the price nevertheless reaches it and crosses it or, say, was below it and then moved above it. Which periods should be used in trading? Most often, the short averages traders use are 8 and 21. The long moving averages are 150, 365, 200. Let us plot all of them on the chart.
You need to remember that the larger the moving average period, the less agile it is, and the larger the price move that is needed for it to change its direction and turn around. So how can we use moving averages in trading? In classic trading books, the concept most often considered is a crossover: when a fast moving average (for example, the 8-period moving average, yellow) crosses the red one, that means a buy.
Or vice versa, the fast moving average crosses the slow one from top to bottom, for example, the 8-period moving average crosses the 21-period moving average. This is a sell signal. Most often, the use of moving averages is considered in terms of their crossover. In general, it is believed that this approach is outdated. Since the market has become less trend-driven, there is a lot of noise, movement up and down.
And when the lines have crossed, it is often too late to buy or sell, because they follow the price and lag behind, that is, they give a signal when the trend has already lost its initial strength. And when you buy, the price may move only a little, and then a reversal will occur. Thus, the crossover of moving averages should not be used as a signal to open positions.
We can regard this as a certain confirmation of the logic of identifying our trend. Suppose we look at the chart and think about what is happening with the trend right now. The long-term one had been going up, and at some point a downward move occurred. We look at how the moving averages crossed some time ago and can generally say that there is a downward trend in place.
That is, the crossover of moving averages can be used by us as an additional filter for making decisions about the current trend present in the market and, accordingly, for opening additional positions based on our other signals. We can also use the angle of slope of our line. The steeper it is, the stronger the trend. Accordingly, this is applied to moving averages with a larger period, from 20 and above. The higher it is, the steeper the angle of slope of the moving average, the stronger the trend.
As you can see on the chart, the price returns to some moving averages, tests them, and in this way bounces off them, continuing the old trend. Thus, we can view moving averages as a kind of dynamic support and resistance level, dynamic trend lines that constantly follow the price. If a signal has formed from a moving average with a period of 89, then we can quite reasonably use it as a signal to enter a position.
If there is no nearby confluence level, but there is a moving average with a period greater than 20, then we can quite reasonably use it as some kind of level and, if there is an additional signal, assume that the price bounced off it and count on a continuation of the trend that had been in place earlier.
You can place stop-losses beyond the moving average and move them as it approaches the price, and you can use moving averages as a kind of signal for exiting or closing some position. Crossovers of moving averages should not be used for entering positions, but for exiting, quite the opposite. If you have long-term trades, then as soon as the moving averages with small periods cross, close the trade and thus find the point where the current trend ends.
Suppose you sold it, and after the 8 and 21 crossed, close the trade and exit the position. If a breakout of the moving average has occurred and you still do not know whether it will be a false breakout or not, then the longer the price remains above or below the moving average, the greater the probability that the trend will change.
Suppose that if it is one candle, the probability is small, but when a second, third, or fourth candle appears beyond the moving average, then we may assume that, most likely, the trend will change. But here again, everything depends on the periods of the moving averages. As I already mentioned, the higher the period, the more significant the moving average is, the greater the significance it has.
In the lesson I did not mention the formulas by which various types (methods) of moving averages are calculated. Why? I believe that for an ordinary trader, like me and you, the formulas for constructing the indicator are not as interesting as its purpose and the ways of using it in trading. After all, not everyone knows how a television or a microwave works, and that does not stop us from using these devices at all. If you still need the formulas for all the types of moving averages presented in Metatrader 4, then you can find them in the program help by pressing F1 inside the terminal.
Respectfully, Pavel Vlasov Tlap.io