
Moving Average Systems: Are "MAs" Still Alive?
 Greetings, friends!
Everyone who has ever dealt with trading in the financial markets knows what a Moving Average is. This classic technical indicator is so widespread that it appears in almost every trading system. Even if a strategy does not use moving averages directly, you will most likely find other indicators in it that use the average in their calculations. Today we will talk about the direct use of moving averages in trading systems, test the most common strategies built on "MAs," and draw a conclusion as to whether this indicator is still worth looking at in today’s markets or whether the grail should be sought elsewhere)

You can get acquainted with the indicator itself in this article. It will introduce you to the main ways it is calculated and the basics of its practical use. Also, in this article you can become familiar with the full variety of moving average types that appeared with the development of technology and, in particular, with the advent of home computers.
Moving averages are mainly used to reduce undesirable noise in time series so that the market behavior underlying the price formation process becomes more understandable and noticeable, more clearly expressed. They provide data smoothing. As a smoothing method, a moving average is a specific low-pass filter, passing low-frequency activity and suppressing high-frequency rapidly changing processes. On the price chart, high-frequency processes look like rapid vertical oscillations, that is, like noise, while low-frequency processes look like smoother trends or waves.
In addition to the ability to reduce the noisiness of time series, moving averages have the advantages of simplicity, clarity, and functionality. At the same time, however, like any powerful filtering method or real-time data smoothing method, they have a drawback: lag. Although smoothed data is cleaner and therefore more suitable for analysis, a lag appears between the data in the original series and in the smoothed data sequence. Such a lag can be a serious problem when a quick reaction to events is required, as is often important for traders.
In some cases lag is not a problem, for example, in systems where the price line crosses the moving average: in fact, price must outpace the average for such a system to work. Lag is more problematic in models where turning points of the moving average graph or its slope are used for decision-making. In such cases lag means a delayed response, which will most likely lead to unfavorable trades.
All moving averages smooth time series using some averaging process. The differences lie only in how much specific weight is assigned to each summation point and how well the formula adapts to changing conditions. The differences between the types of moving averages are explained by different approaches to the problem of reducing lag and increasing sensitivity.
Types of Trading Systems Based on Moving Averages

Models of trading systems based on moving averages generate buy or sell signals based on the relationships between the moving average and price or between two (or more) moving averages. There are trend-following and counter-trend models.
The most popular models follow the trend and lag behind the market. On the other hand, models that go against the trend predict reversals. This does not mean that models following the market work worse than counter-trend ones. Reliable entries into a trend, even if lagging, are considered more reliable and profitable than attempts to predict reversals, which only rarely occur at the expected moment: there is usually only one global extreme, while there will be many local ones.
Trend-following methods of generating trading signals based on moving averages can be implemented in various ways. One of the simplest models is based on the crossover of moving averages: the trader buys when prices rise above the moving average and sells when prices fall below it.
Instead of waiting for the average line and price to cross, you can use a fast average and its crossover with a slower one. A buy signal occurs when the fast average rises above the slow one, and a sell signal occurs when the fast average falls below the slow one. Smoothing the original data series through the use of moving averages reduces the number of false crossovers and, consequently, lowers the frequency of losing signals.
Another way of using moving averages is based on using the crossover of a moving average and a forward-shifted moving average with the same parameters. In this case, a buy signal occurs when the fast original average rises above the shifted one, and a sell signal occurs when the original average falls below the shifted one. By selecting the magnitude of the shifts, you can reduce the number of false crossovers, lowering the frequency of losing signals. Sometimes several shifted moving averages with different shifts and different periods are used simultaneously, as, for example, in Bill Williams’ Alligator or in the Ichimoku indicator.
Moving averages can also be used to obtain entry signals in counter-trend systems. Prices often react to the moving average line roughly the same way they react to support and resistance levels, which forms the basis of the entry rule according to which one buys when prices fall to the moving average or cross it from top to bottom, and sells when they rise to it or cross it from bottom to top. It is assumed that prices bounce off the moving average level, changing the direction of movement.
What Are We Testing Today?

So, I plan to test several classic approaches to using moving averages in trading systems:
- price crossing the moving average;
- crossing of two moving averages;
- using the crossover of shifted moving averages (Alligator and Ichimoku);
- price crossing a shifted moving average;
- working with several moving averages (three, four).
In addition to experimenting with the systems themselves, we will also reflect on various filters and techniques designed to improve system performance. And, in addition to this information, I selected more than a dozen modern trading systems based on moving averages that I found on various sites and forums on the web and would like to test within the framework of this article.
So, today we face several questions that we will try to answer:
- is it worth trying to create trading systems based on moving averages, or is this tool hopelessly outdated?
- what are the best ways to generate trading signals based on moving averages?
- what methods of filtering generated signals can be applied and in what cases?
- is it worth paying attention to modern trading systems that use moving averages as their basis?
- which types of moving averages are most effective and in what cases?
As you can see, there are quite a lot of questions, and a very extensive study awaits us. Nevertheless, I believe that the answers to them interest many traders and will be useful to both beginners and experienced traders. At the same time, it is worth considering that this study is carried out for the Forex market: for commodity markets, raw materials, and stock markets, the answers may differ radically.
And so as not to stretch out this already rather extensive study, I selected only a few currency pairs for the study, trying to choose them in such a way that the nature of their behavior differs as much as possible from each other. At the same time, these pairs had to be from the group of the most popular ones. I chose GBPUSD, EURUSD, USDJPY, USDCAD, and AUDUSD. I did not include USDCHF, since it correlates with EURUSD, and NZDUSD because of its correlation with the Australian. Thus, in our portfolio of currency pairs we can find traditionally trending and flat pairs, with relatively high and low volatility, and with sharp and smooth intraday movements.
Price and Moving Average Crossover

The simplest trading strategy based on the use of moving averages is based on using the crossover of price and the moving average. This trading system is based on a simple trading idea: in a trending market, the moving average lags behind price (due to the very principle of moving average calculation). Therefore, it is believed that if price is greater than its moving average, then the trend is upward, and if price is less than the moving average, then the trend is downward. Accordingly, if price crosses its moving average, then it can be considered that the direction of the trend has changed.
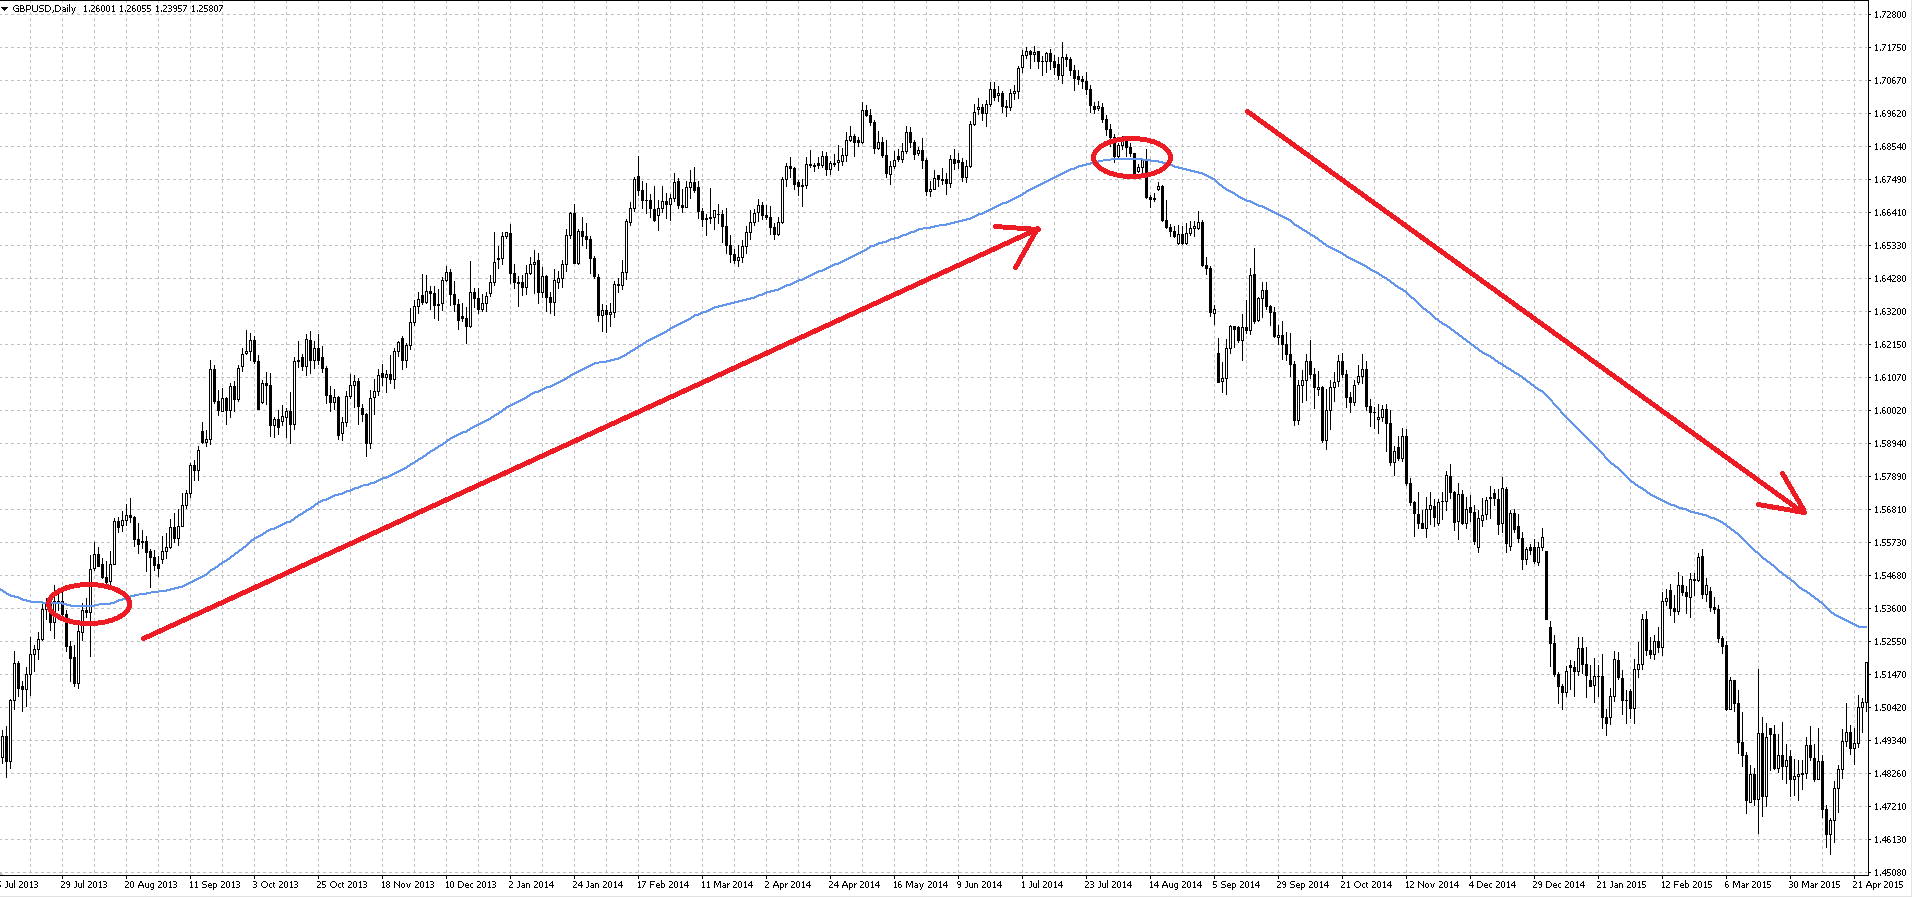 Using this simplest principle is the basis of the simplest trading system based on a moving average. Visually, looking at the chart, one can assume that this approach to trading is potentially capable of bringing us profit. Theoretically, we can receive huge profits from each trade, taking profit from most of the trending movements. Only one question remains: will all this profit be taken away by false signals, of which there can be a huge number in flat sections? Let’s check this by testing.
The trading system will generate entry signals when a daily bar opens on one side of the moving average and closes on the opposite side. An exit signal will be generated together with the opposite entry signal. This type of system is called reversing: trades will be open continuously, and when a new signal is received, the current trade will be closed and a new one opened in the opposite direction.
No position management such as trailing stops will be used. Take-profit and stop-loss orders will not be used either. In automated execution such a system is dangerous: if the server on which the system is installed goes down, you may suffer unlimited losses. Therefore, installing limiting orders (at least a stop-loss) in real trading is mandatory. But for testing, we can neglect this rule.
In our basic trading system there is only one optimizable parameter: the moving average period. Here are the results of one of the optimizations:
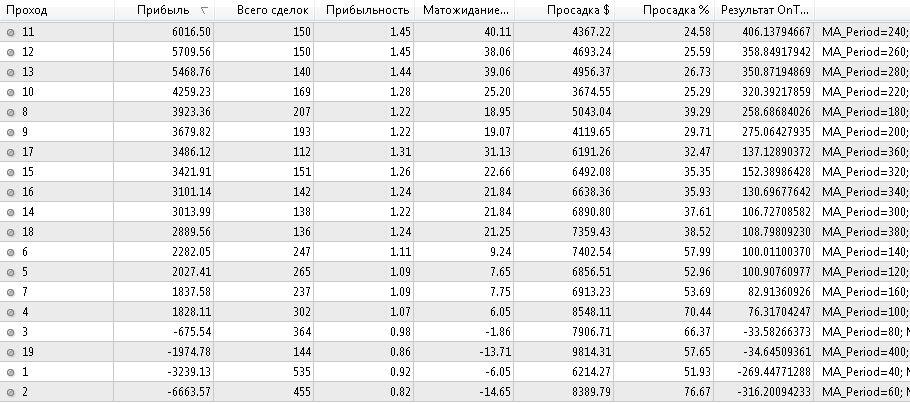 A result like this, where most runs show a profit, indicates that the system is quite stable and the results are not accidental. The strategy is indeed profitable for most optimization parameter values, the model is workable, and the profit is not the result of a random coincidence of circumstances.
Of course, the number of trades decreases as the moving average period increases, but even with a high period (200 and above) it remains large enough (150-200 trades) to trust the test results. Now let’s study the optimal results more closely:
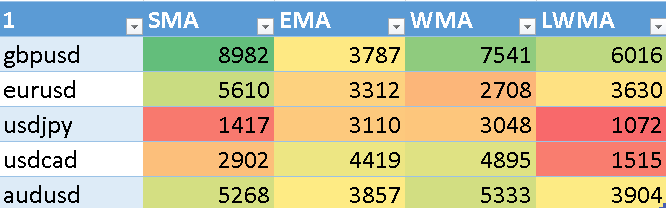 This strategy works best on the GBPUSD and AUDUSD currency pairs, regardless of the type of moving average used. On the USDCAD pair, the smoothed and exponential versions work better, while on EURUSD the simple one works best. The USDJPY pair showed low efficiency for this strategy, but nevertheless the exponential and smoothed moving averages work better.
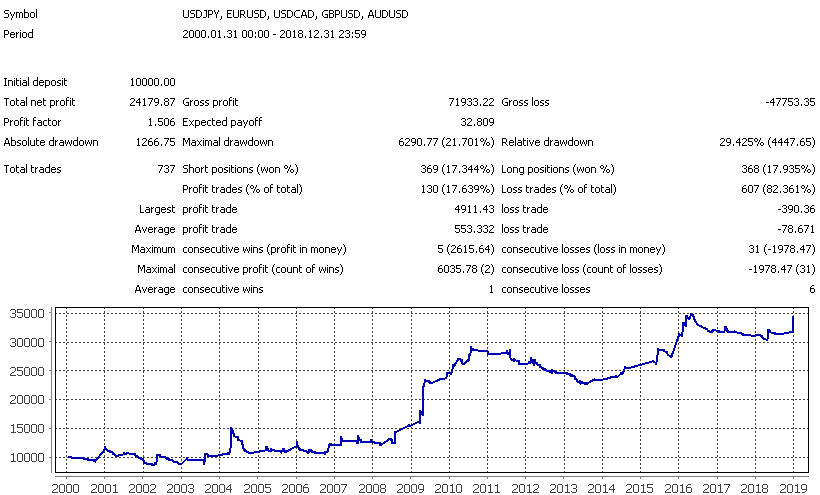
Summary statistics for the simple moving average:
 Now let’s try to select suitable filters, for which we will use only the simple moving average. The filters most often mentioned in the literature are the following:
- entry after 1-3 candles, if the signal has not disappeared:
 This filter significantly reduced the number of false signals and increased the system’s final profit in all cases;
- entry after the average has been broken and price has traveled a certain distance, depending on current volatility (according to ATR). This distance should appear between price and the moving average within a certain time not exceeding the time specified in the settings:
 This filter proved less effective than the previous one, and besides that, it filters out too many trades;
- entry after breaking the moving average built on High/Low prices:
 This filter showed even lower efficiency than the previous one.
Some entry filters do indeed improve the system parameters, and their combinations can also produce more optimal results. Nevertheless, the system is a classic trend-following trading system in which the number of profitable trades is much less than 50%, while the size of a profitable trade exceeds the size of a losing one by five times or more. Such a system is very difficult to trade psychologically, and for private traders who are used to more comfortable trading, such a system is poorly suited. A typical balance graph has the shape of a "staircase":
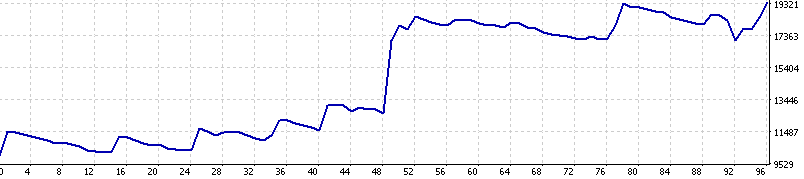 Long drawdown periods combined with a small number of trades will cause very tangible discomfort in trading. Nevertheless, trends will always exist in the market, and, as history shows, they appear quite regularly. And that means that such a system will work and earn for as long as you like, never losing its relevance. Another matter is that not every trader can withstand a drawdown stretching for, say, a decade.
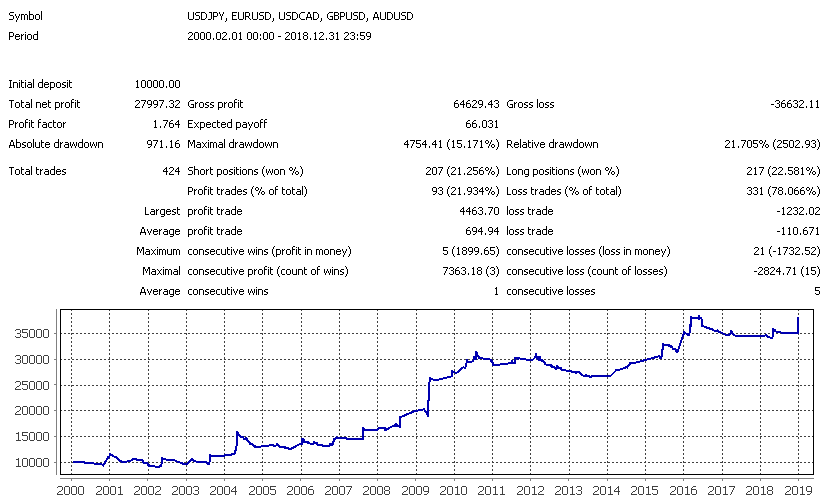 And finally, in the figure above you can see the overall statistics of the trading system using the most successful entry filter. As you can see, it is far from perfect. In fact, the account was in drawdown during the period from 2011 to 2015, which far from every currency speculator can endure.
Crossover of Two Moving Averages

In the previous example, we used the simplest principle of applying a trading system based on a moving average, taken in pure form and with some filters for entry signals. Yes, fundamentally it works, like most indicator methods of technical analysis, but the problems, as always, lie in the details and nuances. And one of the nuances of the example considered is the fact that strategies of this kind work poorly in markets where there is no pronounced trend. They open many opposite trades on price "noise" movements, losing the profit accumulated during trending sections of the market.
This drawback can be partially eliminated by using the crossover of two moving averages, one of which, the faster one with a smaller period, represents a smoothed equivalent of the price chart, while the second, slower one, is used to determine the trend direction. By choosing the ratio between the MA periods, you can reduce the number of "false" system triggers due to the noisy components of price movement, and also reduce the number of trades in sections of the market with a sideways trend.
The trading idea in this case is also very simple: if the fast moving average is located above the slow MA, then the trend is upward, and if it is below, then downward. Accordingly, the points where the fast and slow MAs cross are considered points of trend direction change and are used as the system’s trading signals:
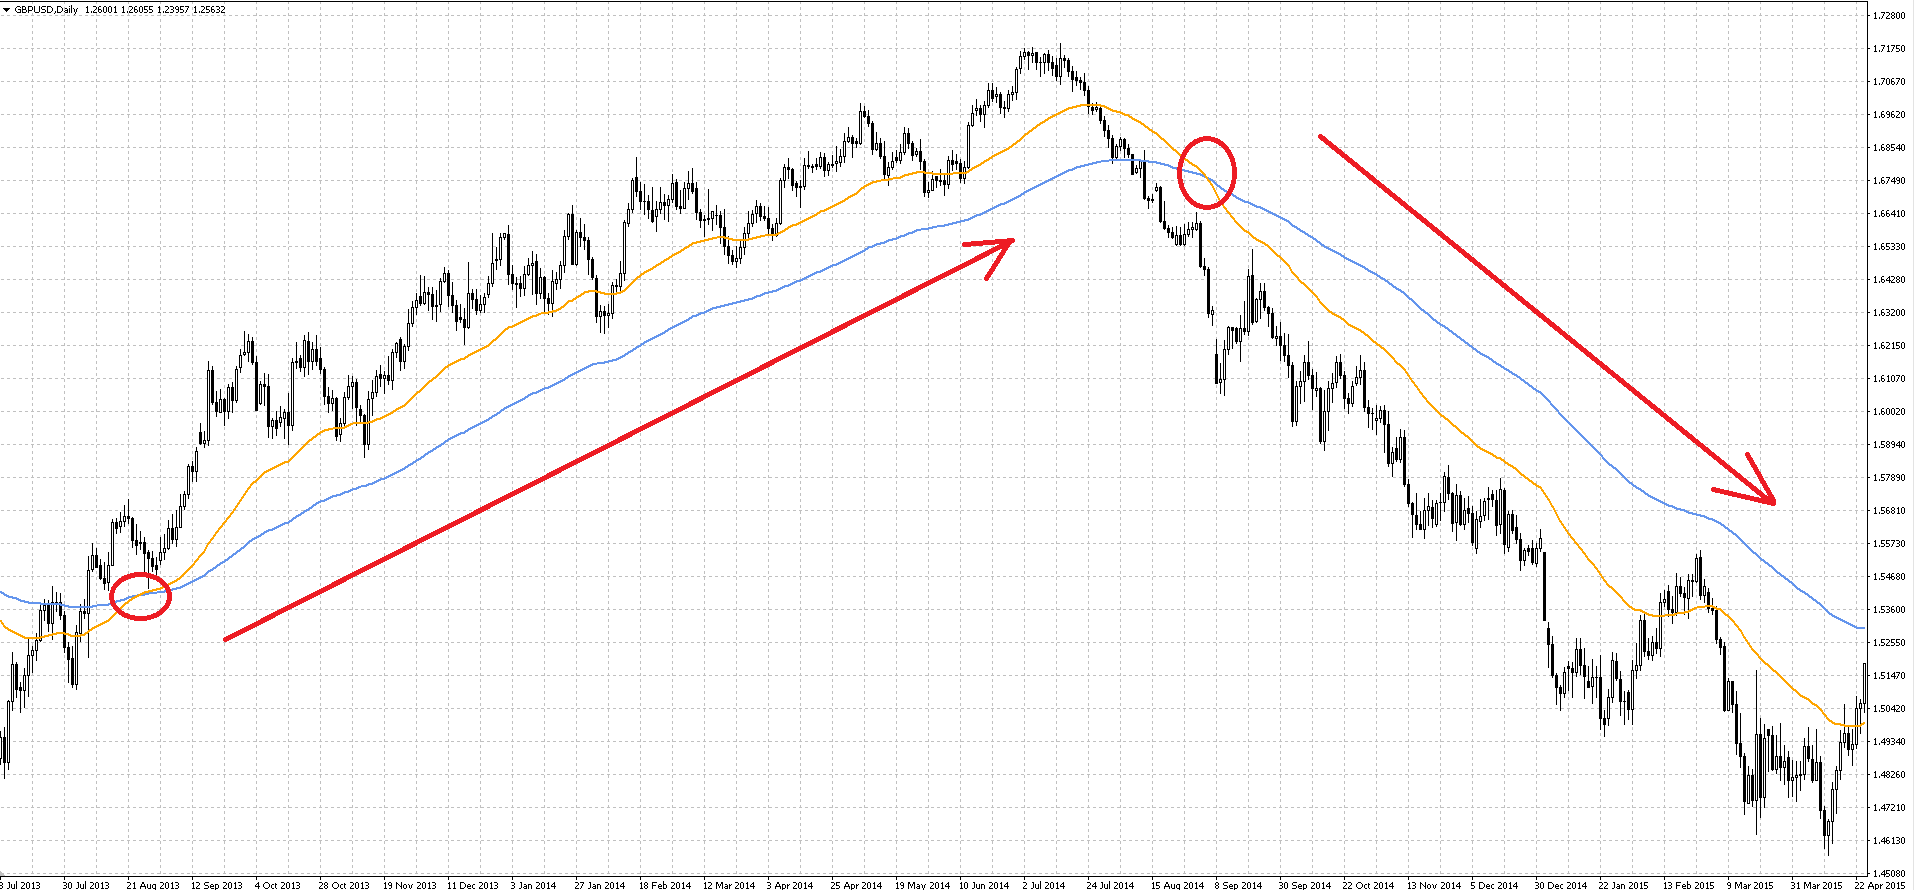 Now let’s look at the results:
 As in the previous system, the GBPUSD pair shows the best results. EURUSD also performed well. The remaining currency pairs showed roughly the same results, considerably better than when price crosses the MA.
In general, most optimization results are above zero profitability, which indicates satisfactory robustness of the trading system. The most profitable results for the GBPUSD pair, for example, are obtained when using a fast moving average with a period from 50 to 100 and a slow moving average with a period from 110 to 180.
 Many negative values during optimization correspond to parameter sets where the fast moving average period turned out to be higher than the slow one, that is, the system rules were inverted. In fact, with the correct set of settings, there will be significantly fewer unsuccessful runs.
This situation can be avoided by modifying the system rules. Instead of directly setting the period of the fast moving average, we will set a certain coefficient in the range from 0.01 to 0.99. Then MA_fast_period = MA_coeff * MA_slow_period.
Thus, the period of the fast moving average will never exceed the period of the slow one.
 We obtained a very similar picture of result distribution, but this time there were far fewer unsuccessful runs. A total of 1715 results were obtained, of which about 30% were negative.
This trading system implies more comfortable trading, and drawdown periods are shorter here. The average profitable trade mainly exceeds the average losing trade by two to three times, and the number of profitable trades stays in the 40-60% range depending on the currency pair. Such statistics are already more acceptable for a retail trader:
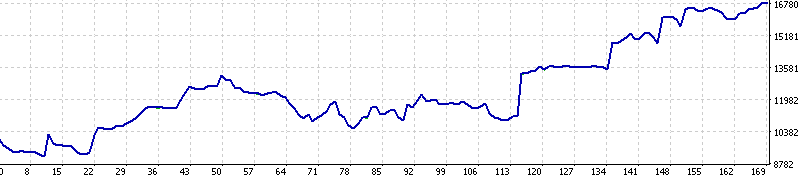 At the same time, if you assemble a portfolio from at least the currency pairs I tested, the characteristics of such a system may turn out to be quite interesting from the point of view of long-term investing:
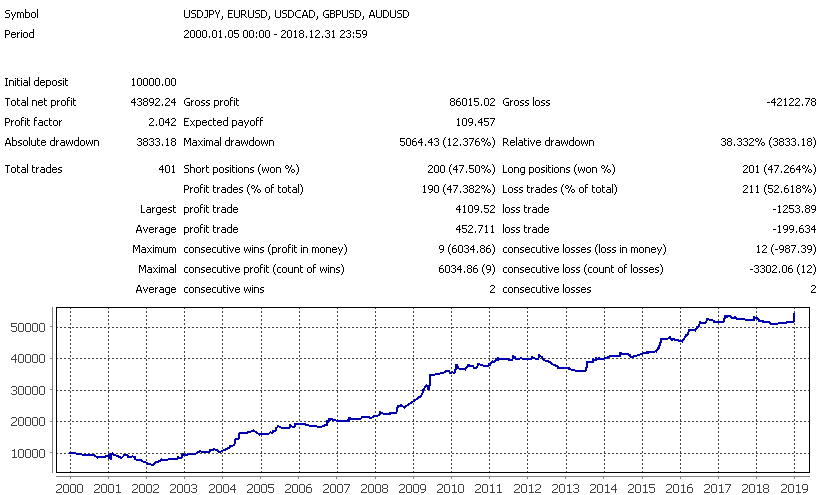 Of course, drawdown periods are still quite large, but in general the system’s results look much better than in the previous case. Nevertheless, here too we observe a very long drawdown period from 2012 to 2014, as well as from mid-2017 to today and from 2001 to 2003.
Using Shifted Moving Averages

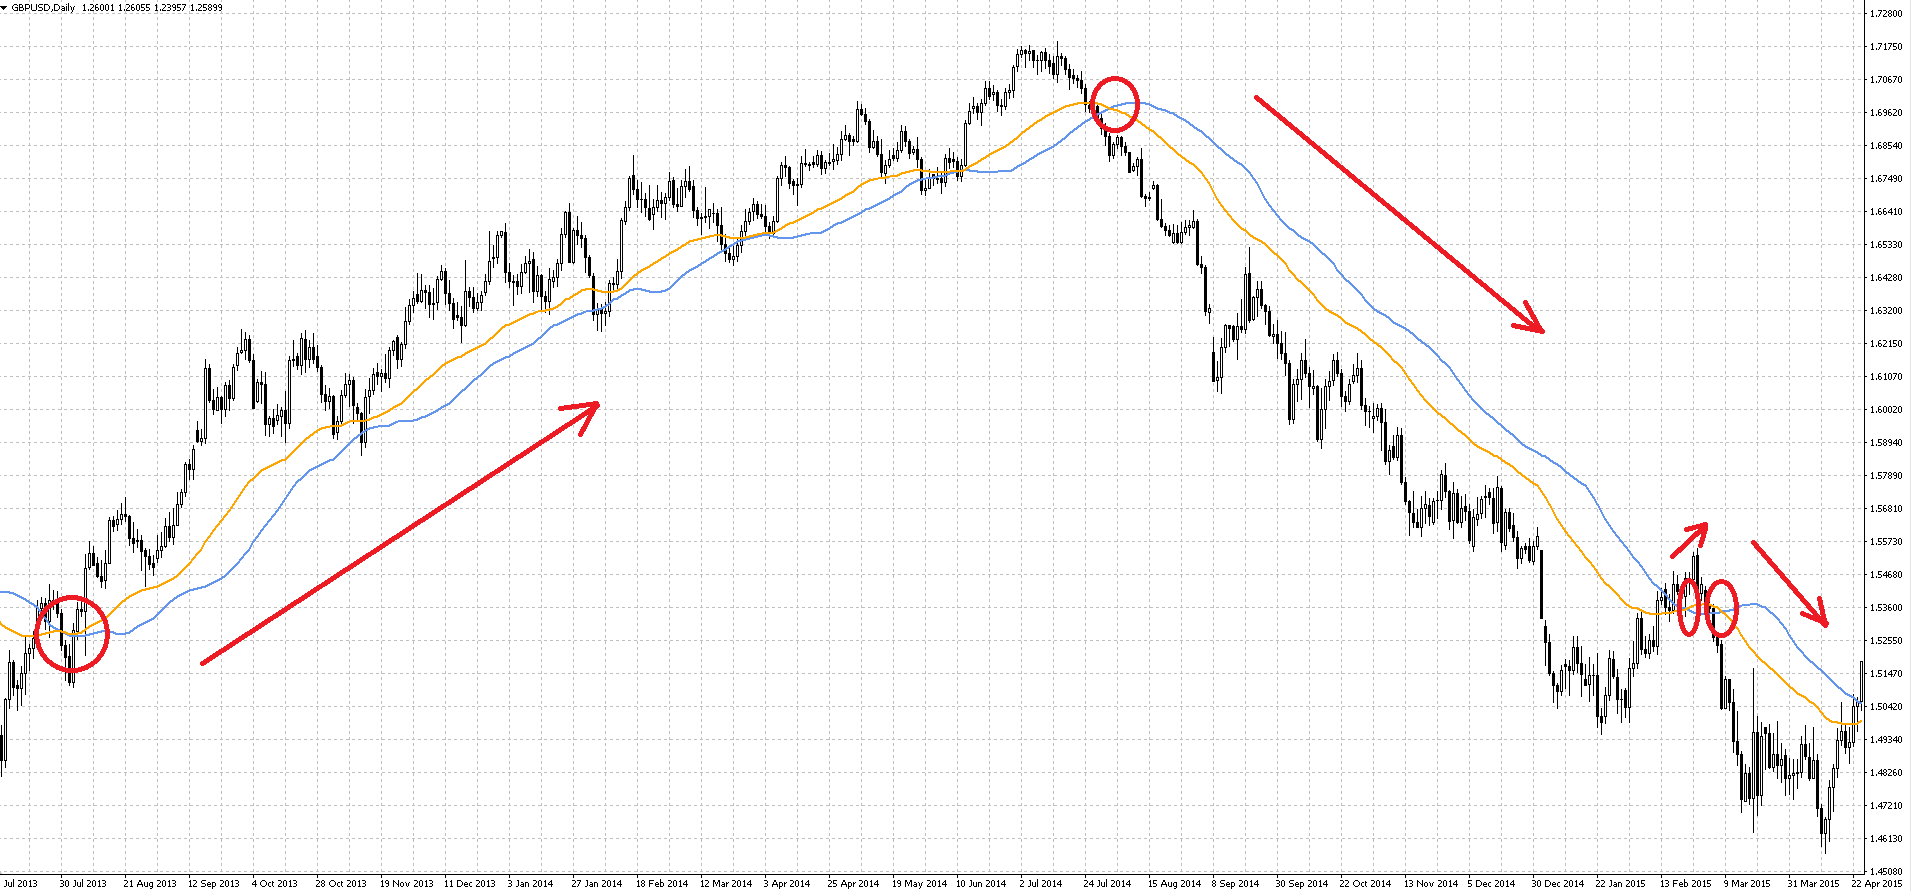
Another way of using moving averages is based on using the crossover of an MA and a forward-shifted (backward-shifted) moving average with the same parameters.
In this case, a buy signal occurs when the original MA rises above the shifted moving average, and a sell signal occurs when the original average falls below the shifted one. By choosing the amount of the shift, you can reduce the number of false crossovers, lowering the frequency of losing signals.
A variation of this method is the method that uses the crossover of the price chart with a shifted MA, or the price chart with a forward-shifted price chart. It should be noted that the latter version (used, by the way, in the popular Ichimoku indicator) is nothing more than another form of the Momentum indicator. The price chart, together with forward-shifted moving averages, is also used in Bill Williams’ trading system. We will consider a variant of crossing two moving averages with and without a shift:
 From the graph below it can be seen that regardless of the magnitude of the shift, the optimal period is from 90 to 150:
 Negative results are again within 30%, which is quite acceptable and serves as a signal that the system is sufficiently robust. As for the system’s performance results, they are not much worse than those of the two moving averages:
 If we combine all the tested currency pairs into one portfolio, we get the following picture:
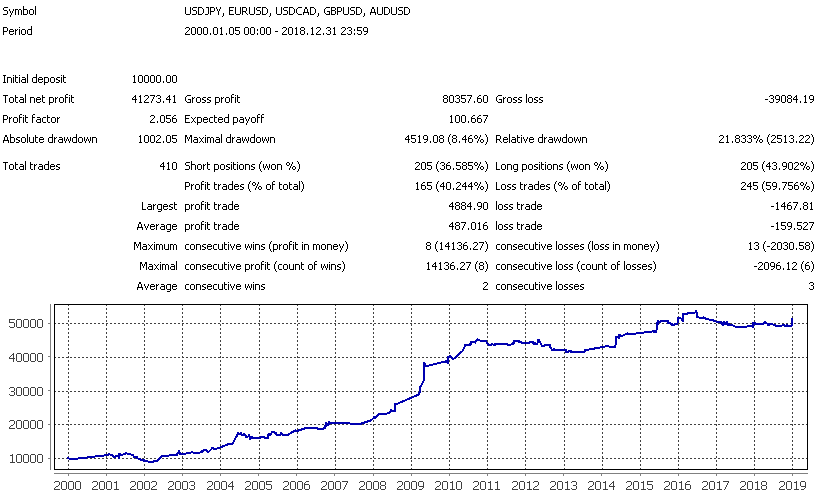 The picture is very similar to the result of the system based on the crossover of two different moving averages, but the number of profitable trades is lower, while the average profitable trade is more than three times larger than the average losing one. At the same time, drawdown periods are more prolonged. Overall, the previous trading system should be preferred.
Crossover of Price and a Shifted Moving Average

We will consider this variant of the trading strategy because it is used as an entry signal in a number of trading systems.
The trading idea differs only slightly from the previous case. The entire difference lies in the fact that instead of the crossover of two moving averages, the crossover of price and a shifted moving average is used.
This system produced a very large number of negative results, up to 50%, which may indicate instability of the model. Nevertheless:
 As can be seen, they are comparable to the model of price crossing a single MA without a shift. Here are the summary statistics:
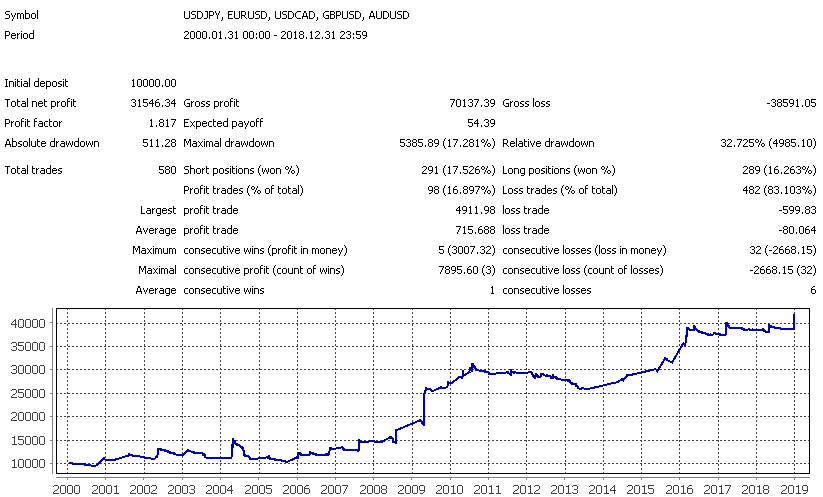 The parameters of the system are very reminiscent of the first trading system we considered. By the way, if you visually compare all the summary tests, you will see that their equity curves are similar: the same growth periods and the same places of serious drawdowns. All this indicates that moving-average-based systems generate very similar signals. Somewhere they turn out to be more effective, somewhere less so, but the final result depends largely not on the specific settings, but on the behavior of the market itself.
All this also indirectly speaks of the fairly high robustness of moving-average-based trading systems: if on a specific currency pair most settings during optimization produce a profit, then it is not so important which of them to use. If the market does not change (trends do not disappear, which is unlikely), then the system, with a huge degree of probability, will bring profit to its owner over a long period of time. How acceptable the potential profit is for the trader is another question, but judging by the test results, it has every chance of suiting many people.
A Multi-Timeframe System Based on MAs

This trading strategy is the equivalent of a random crossover of price and a moving average, but simultaneously for several timeframes differing in the time scale of data presentation. The essence of the trading idea in this case is as follows: we believe that the trend is upward if price is above all three moving averages, that is, that three trends of different duration on three multiple timeframes of data presentation are classified as upward. To do this, we will take the timeframes H4, D1, and W1 and place moving averages with different periods on them.
The system turned out to be very robust, with negative results accounting for less than 10% of the total. Nevertheless, the results themselves are not particularly impressive. Here they are:
 And here are the results of the summary statistics for all the tested pairs:
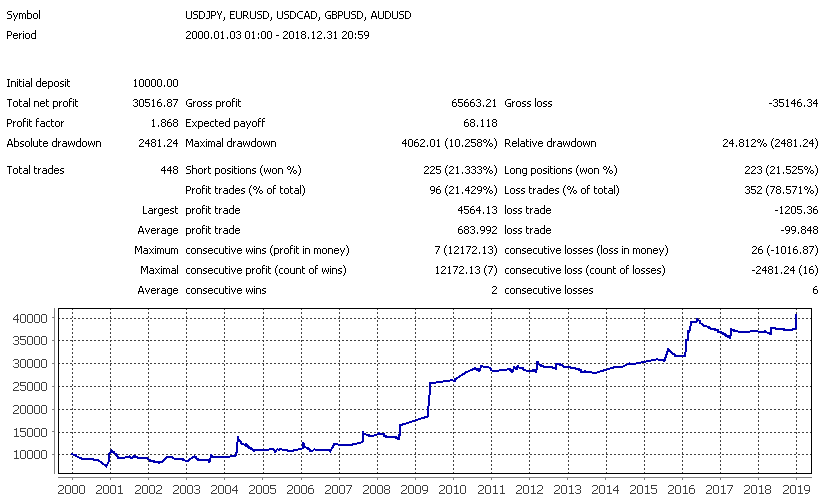 As can be seen, the results are not much better than the outcome of the very first trading system we considered.
Trading Systems Based on Bill Williams’ Alligator Indicator

Opinions about Bill Williams’ books "Trading Chaos" and "New Dimensions in Stock Trading" in the trading community range from complete rejection to enthusiastic admiration. What is absent is indifference, and if people talk about the books and the method, then there is something in them; at the very least, one should give credit to Bill Williams’ talent for popularization.
Bill Williams’ trading strategy is not a mechanical trading system, but a kind of trading-analytical complex made up of a large set of rules and market analysis techniques and trading operations, following which anyone can create their own trading strategy.
We will consider only one of the elements included in Bill Williams’ trading-analytical complex and based on the use of a set of shifted moving averages, the so-called Bill Williams’ Alligator, and the simplest trading strategies that can be built on the basis of this indicator.
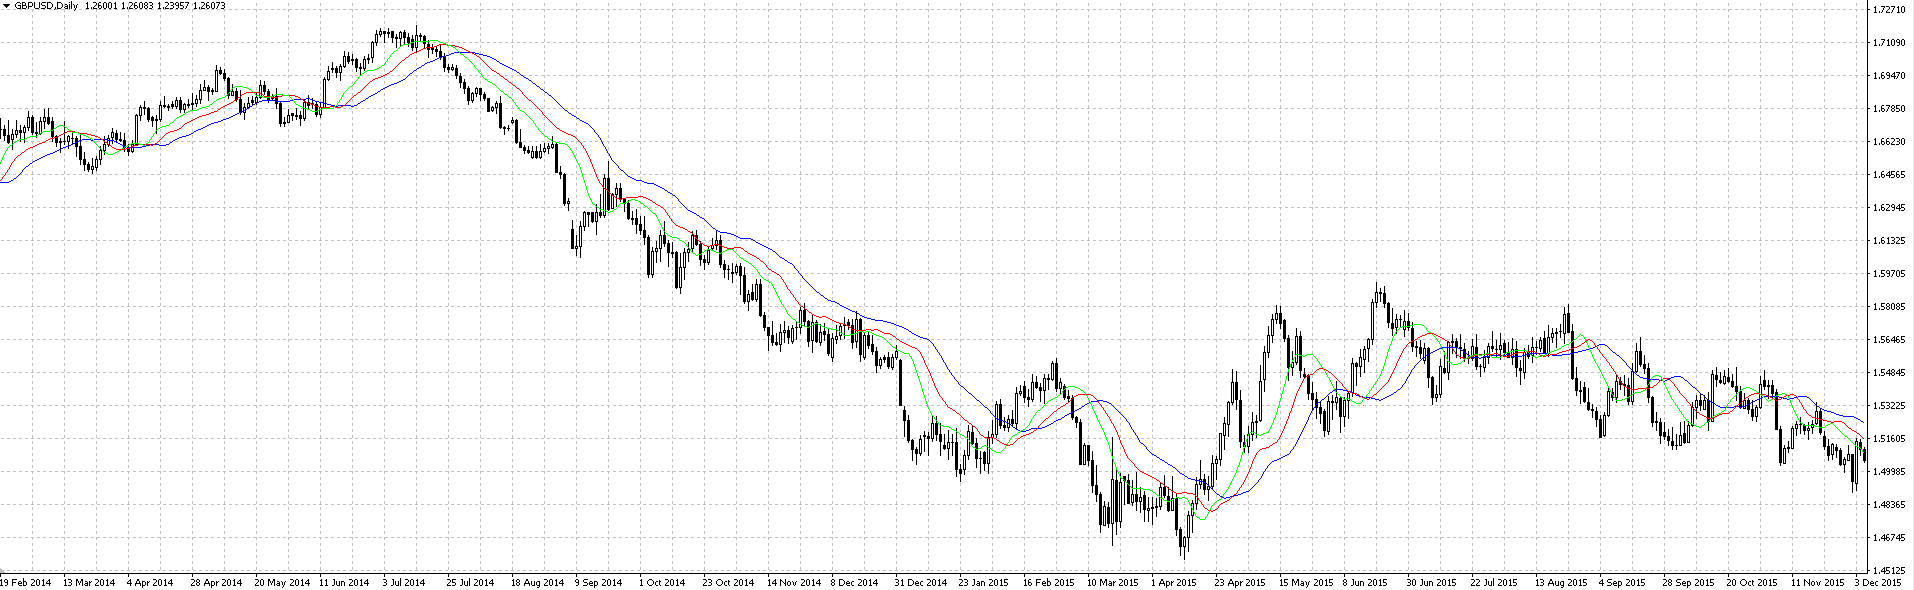 The Alligator indicator is three shifted moving averages of different periods with different shifts, considered together as one object. The Alligator is nothing more than a set of three shifted moving averages with periods of 9 (shift 3), 15 (shift 5), and 25 (shift 8), calculated on the median price of the chart. Different combinations of the mutual arrangement of the price chart and the indicator elements serve as guidance for one or another action in the market. The Alligator is very popular, especially among beginner traders. Let us consider in tests what the use of the Alligator as an element of a trading strategy gives.
Bill Williams, a psychologist by education, writes figuratively and vividly, taking into account the psychology of the reader’s perception of the text. Therefore, his books are memorable, especially if they were read at the stage of initial acquaintance with the market. According to Williams, the Alligator hunts prey, and that prey is price. When the Alligator’s lines are intertwined with the price chart line, the prey has been caught, the alligator is full and passive. At that moment the trader is also in standby mode.
Taking advantage of the Alligator’s passivity, the prey, that is price, begins to slowly slip out of the zone of the indicator lines, the alligator begins to feel hunger, wakes up, and opens its mouth, trying to catch the escaping prey. First the Alligator’s lips open: the green line, then the teeth: the red one, and finally the jaws swing open: the blue line.
The indicator lines line up in the order green-red-blue and move after price while the trend continues. Since a trend cannot last forever, sooner or later the alligator catches up with the prey and price again enters the zone of the indicator lines. The process, with one or another difference, cyclically repeats as new trends appear and develop.
The first trading idea that arises when considering Williams’ Alligator indicator is to use it as a trend indicator. If the indicator lines line up in the order green-red-blue, then it is obvious that the trend is upward; if the order of the lines is blue-red-green, then the trend is downward. Let us try to test a trading strategy based on the order of the Alligator lines.
For buys, we identified the simultaneous fulfillment of the conditions that the green line is above the red line and the red line is above the blue one. For sells, the simultaneous fulfillment of the conditions that the green line is below the red line and the red line is below the blue one. We will supplement the condition for opening positions by checking the mutual arrangement of the closing price and the red Alligator line so that there is no conflict between the rules for opening and closing positions. We will not use optimization; we will test the Alligator in its original form.
This system did not produce a single positive result:
 We examined several typical ways of constructing trading systems based on moving averages, and also reviewed several filters for entry signals. We discovered several interesting features, such as the strong "similarity" of the balance charts of the systems being tested.
In addition, we found the answer to most of the questions we posed. For example, we can say with certainty that the moving average is still quite an effective technical analysis tool and that systems based on it can be quite effective. The system based on the crossover of two moving averages showed itself best, while the most effective type of moving average differs for each currency pair.
The typical examples we have considered do not exhaust the entire possible variety of options for using moving averages as elements of trading systems, but they provide a basis for formalizing and studying practically any trading strategy based on moving averages.
In addition, we still have the last question we posed about the advisability of studying modern trading systems based on moving averages and freely distributed on the internet.
Modern Trading Systems Based on Moving Averages

Regardless of the timeframe for which the strategy is designed, we will use H1. We will also apply our own rules for exiting and managing positions. This will unify the strategies: in essence, only the rules for entering a position will differ. Thus, we will be able to compare specifically the efficiency of entries into trades.
MA Window

After the price breaks out through EMA8, it is proposed to wait for a pullback and for the price to touch EMA8 within 5-15 candles. If this happens, a new position is opened in the direction of the original breakout. It is proposed to set fixed stop-loss and take-profit levels; position management is not provided.
The strategy is designed for the M15 timeframe, but we will use it for H1. We also use different rules for exiting and managing positions. We will also slightly modify the entry rules: the candle that touched the MA must be directed toward the position being opened. This is a small candlestick filter designed to improve the trading system’s results.
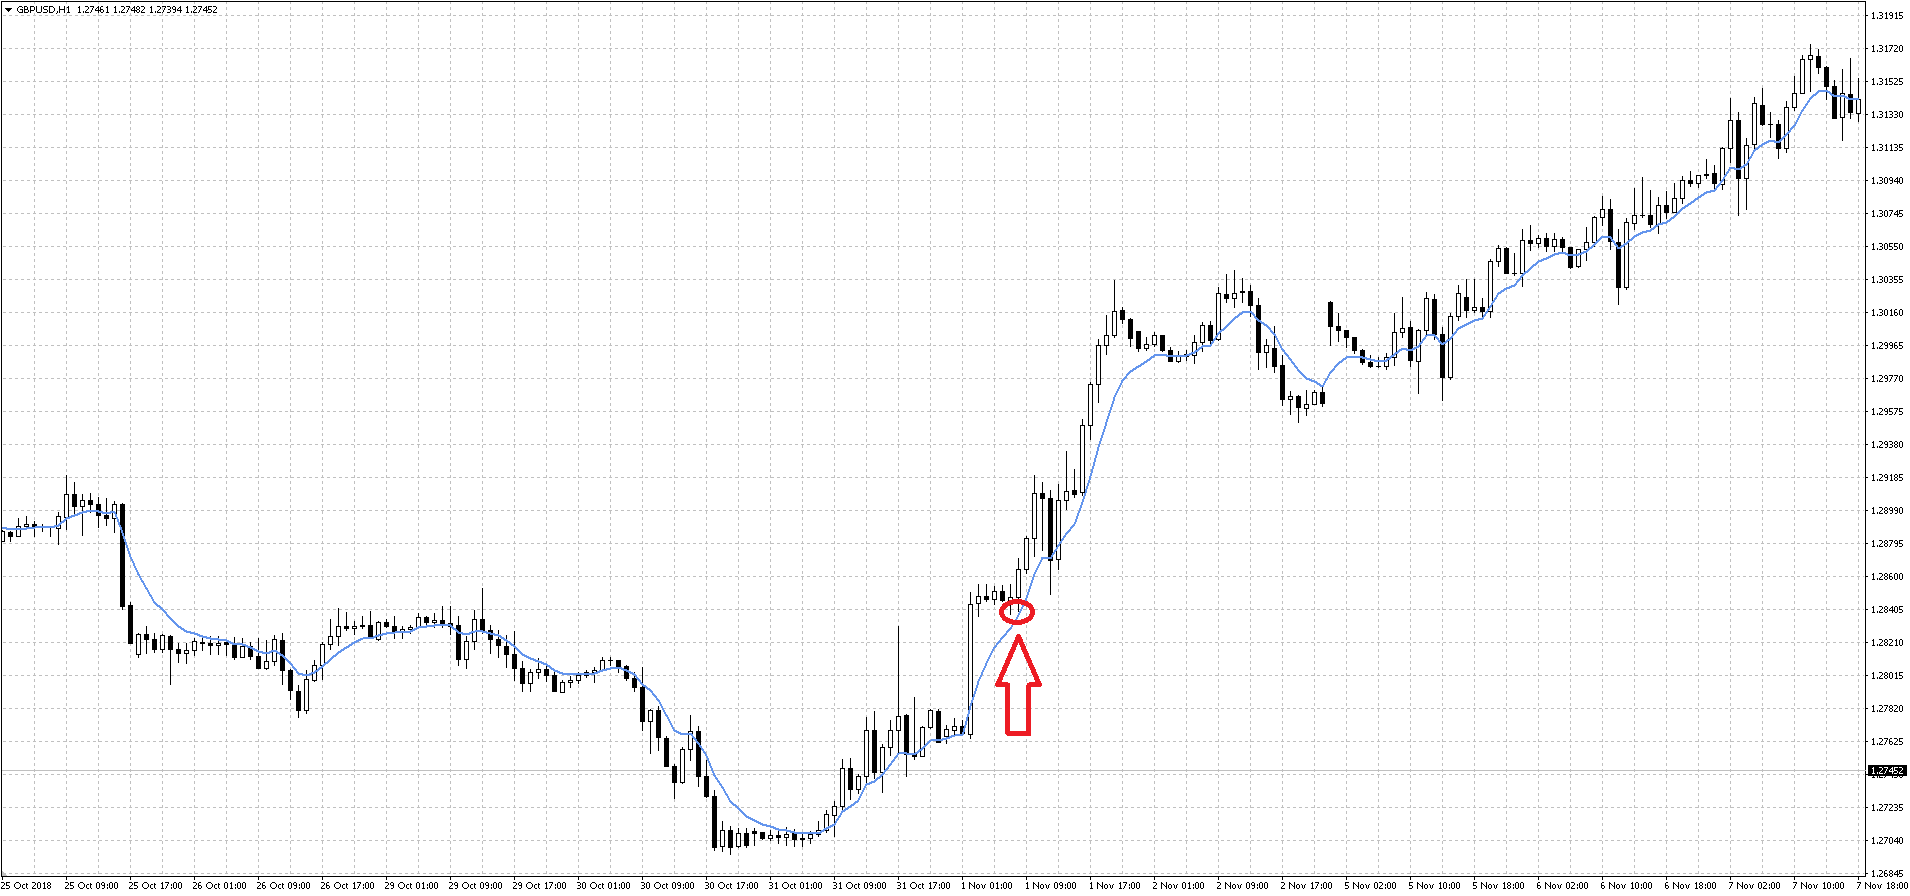 In essence, this strategy is a more complex modification of the classic trading system of price breaking one MA with a filter by the number of candles.
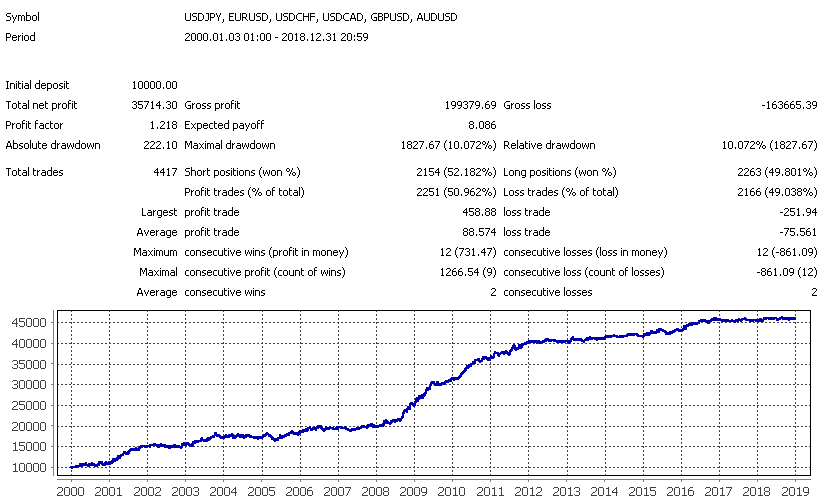 The strategy proved to be quite robust, and its results are quite suitable for real trading. Nevertheless, drawdowns are still rather long and amount to periods of up to one year. In addition, several years were closed at zero: 2002, 2004, 2007, 2012, 2017. Nevertheless, the result can be considered quite acceptable.
Battle of the Channels - Battle of the Bands

The next strategy is called Battle of the Bands. The trading system is designed for hourly charts and uses a channel of two MAs built on the high and low prices. For filtering trades, moving averages with periods 100 and 200 are used: for sells, price must be below them; for buys, above them. A trade is entered when price breaks through the MA channel and the Parabolic SAR indicator confirms the intended trend. In the original, it is supposed to set a stop-loss on the opposite side of the MA channel and a trailing stop of about 15 points, but we, as usual, use our own exit rules.
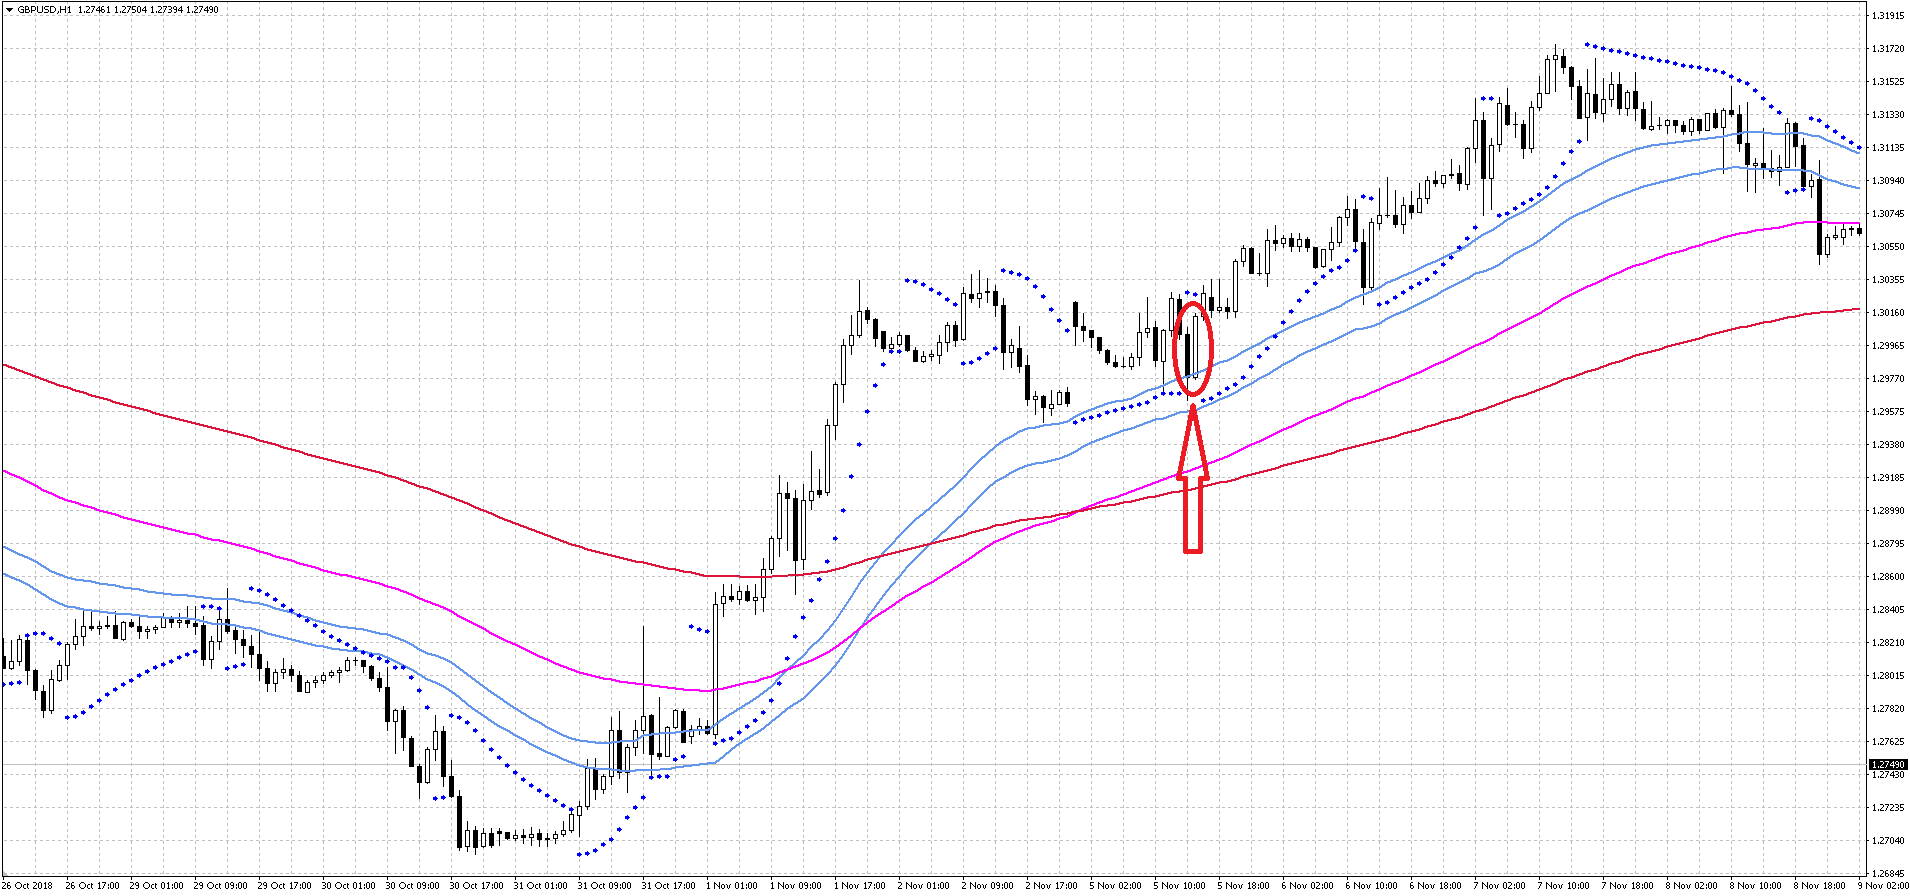 As you can see, the strategy is almost entirely tied to MAs, and its rules are quite simple. Let’s look at the test results:
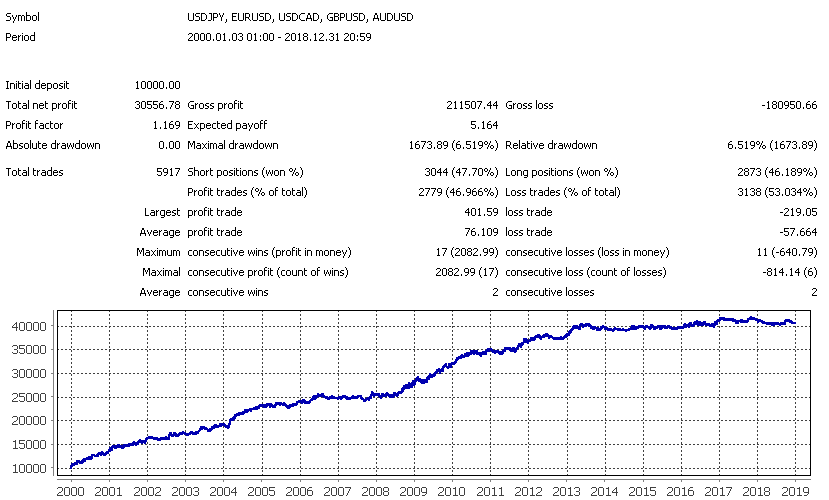 The strategy’s effectiveness decreased significantly after 2014, almost to zero. Nevertheless, it worked for a long time and brought profit. It is quite likely that with additional refinements, the trading system could be profitable.
EMA + Stochastic

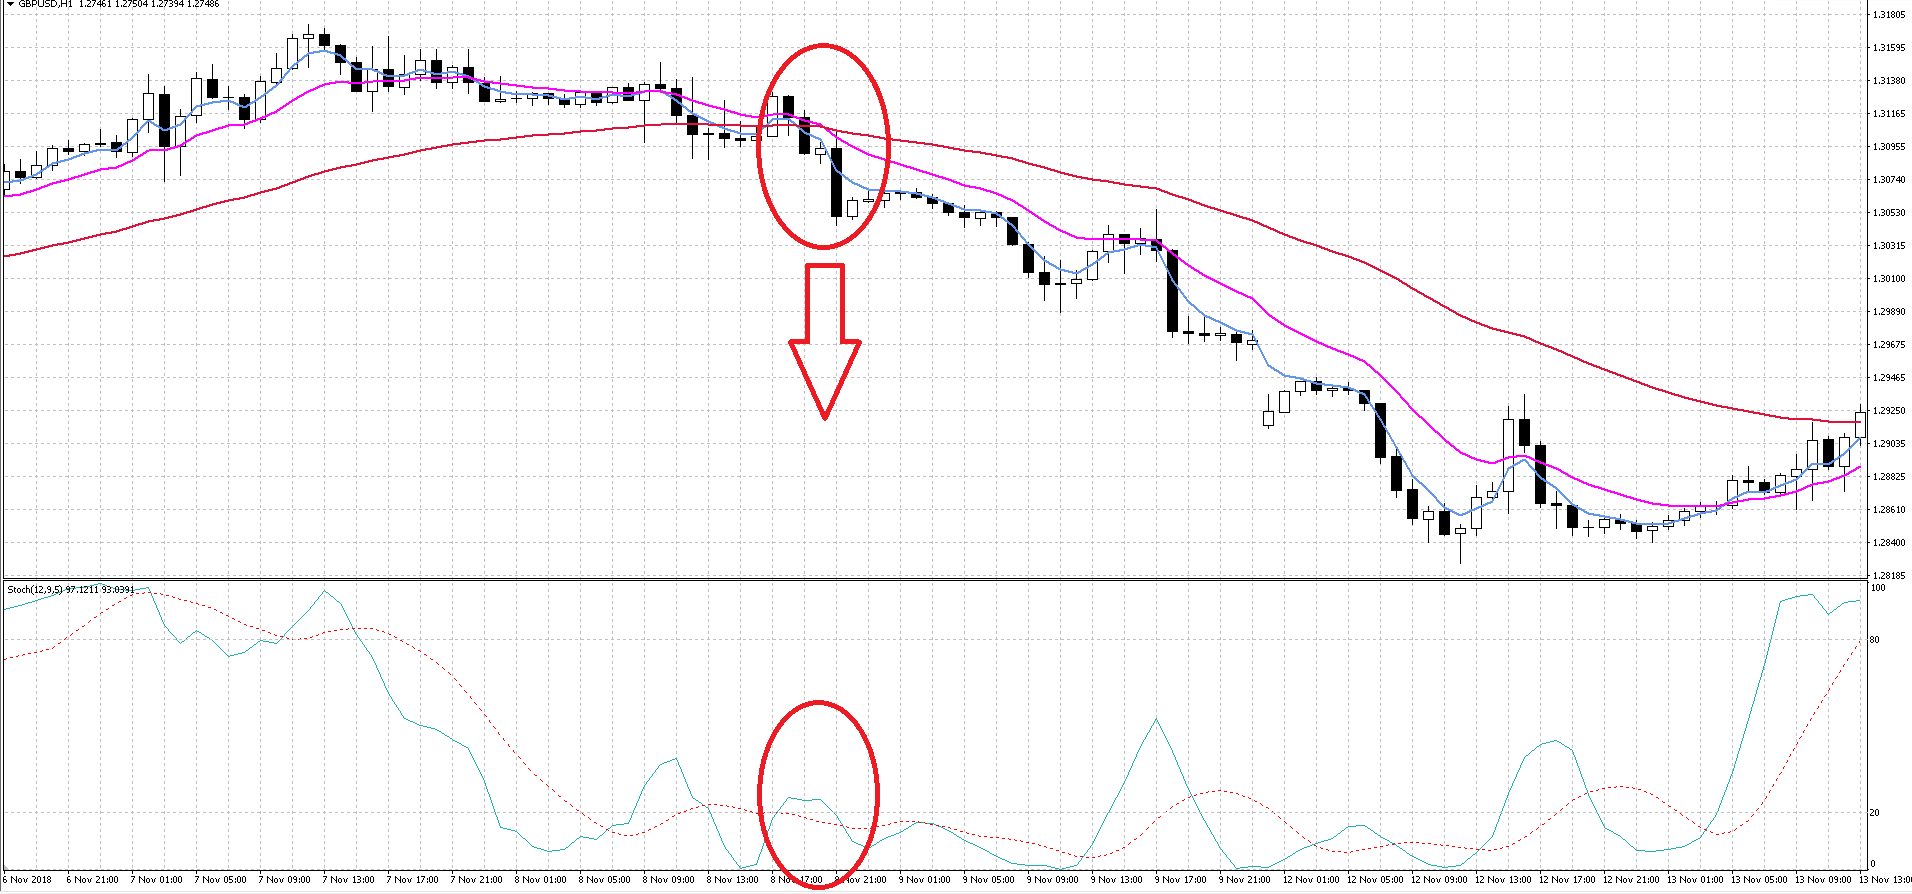
The next system is EMA + Stochastic. This is another fairly simple strategy that uses three moving averages and the Stochastic oscillator.
The rules are simple and banal. Here is an example for buys: two fast MAs cross the slow one upward, and the stochastic is above a certain level. In the figure below is an example for sells:
 Now let’s look at the results:
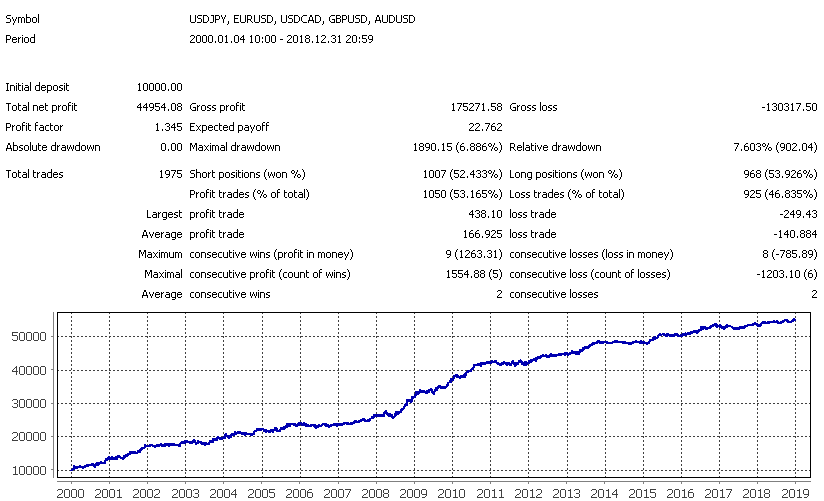 The system generated enough trades to assess its effectiveness. The average profit is slightly larger than the average loss, and the number of profitable trades is slightly above 50%. Judging by the balance curve, trading is quite stable, although 2006, 2011, and 2014 were closed roughly at zero. This trading system can quite reasonably be used on a real account.
Hi-Lo

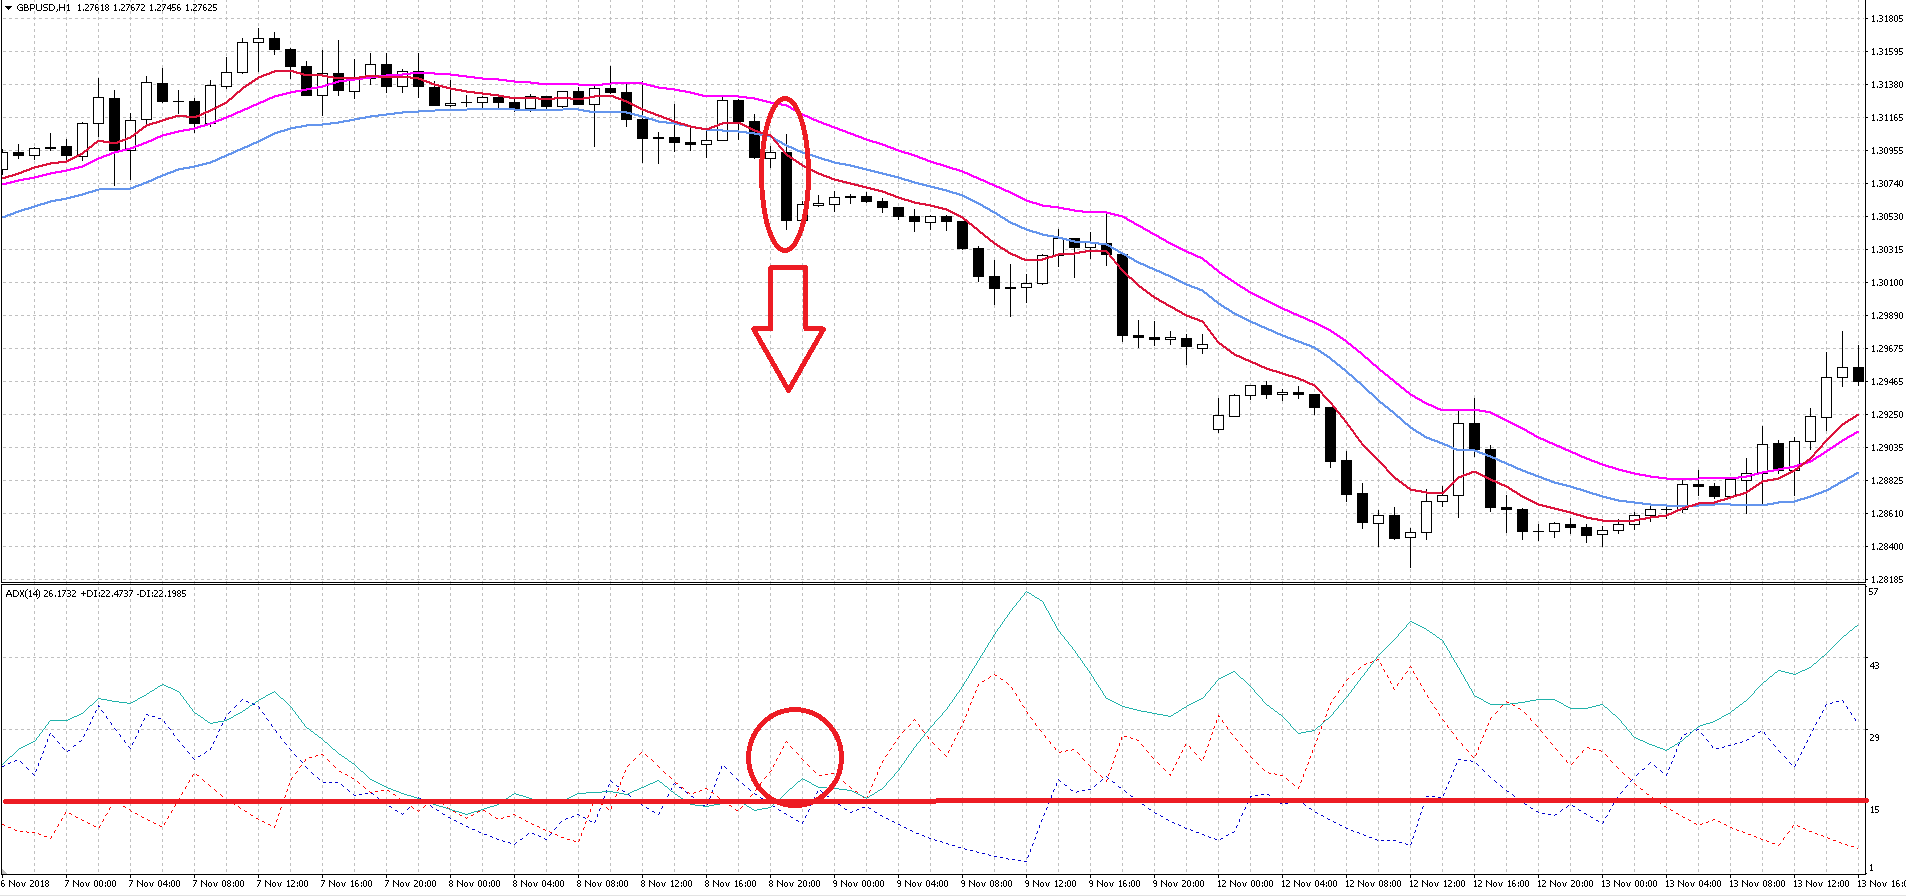
This strategy uses a moving average channel. The signal to buy is the crossing of the channel boundary by a faster moving average. An additional filter is provided by the readings of the ADX indicator and the candle closing beyond the channel boundaries:
 Let’s take a look at the results:
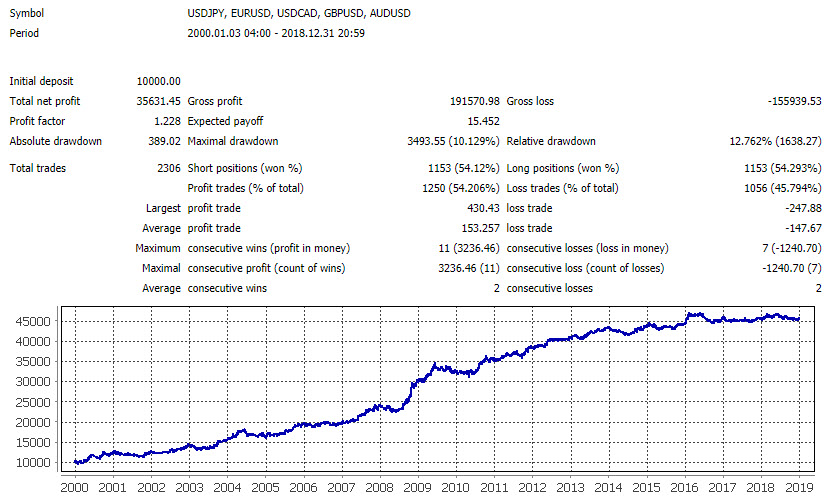 The system generated enough trades to assess its effectiveness. The average profit is slightly larger than the average loss, and the number of profitable trades is slightly above 50%. Judging by the balance curve, trading is quite stable, although profitability has been practically zero since 2015. With some refinement and the addition of other instruments, the system could be used on a real account.
Conclusion

As we have seen today, trading systems based on moving averages still remain relevant. Judging by the results of our research, it is possible to develop quite profitable trading systems based on this indicator that are capable of consistently bringing profit to their owner over a long period of time.
As the results of our tests show, the best option for generating entry signals with the help of moving averages is to use the crossover of two MAs. This option showed the smoothest equity curve and the best statistical data compared with the other classic ways of trading moving averages.
At the same time, the best option for filtering trades is to wait for a certain number of candles. If, say, within 3-5 candles the entry conditions have not disappeared, such a trade will be successful with a greater degree of probability. In addition, you can experiment with filtering trades by the readings of various indicators or candlestick patterns, but that was not part of our task. Therefore, I leave this opportunity to you.
We also became acquainted with several modern trading systems that I chose at random on the internet. All of them showed very similar results. The main point I would like to emphasize is that three of the four systems considered lost their effectiveness since 2015. Most likely, this indicates that the authors of manual trading systems perform rigid curve-fitting to the market, do not use forward testing, and violate in every possible way the basic principles of developing robust trading systems. It is not at all surprising that the majority of retail traders lose their deposits using trading systems found on the internet and put on a real account without thorough testing on a demo.
Nevertheless, in almost any trading system you can find something interesting: the approach itself, the principles of managing positions, closing trades, or original methods of filtering signals. This can be especially useful for beginners in the Forex market.
Thus, no matter how much moving averages are criticized for lag, excessive smoothing, and so on, today we have become convinced that this is quite an effective tool that can and should be applied in your trading systems.
Respectfully, Dmitry aka Silentspec TradeLikeaPro.ru