
Mean Reversion Strategies, or How to Develop a System for a Flat Market
 It is believed that trends are present in the markets less than 30% of the time. All the rest of the time, prices move randomly and chaotically within ranges. But what should traders do in such cases, sit and wait for the weather by the sea? Of course not. It was precisely for such situations that mean reversion systems were invented, and that will be the subject of our discussion today.
Mean reversion strategies became very popular starting in 2009. They performed very well over the past 10 years, including during the bear market of 2008-2009. What is especially appealing about this class of strategies is the simple and clear idea: if price moves up today, it will tend to return down tomorrow. That is what we will talk about today.
Mean reversion (mean reversion) is a mathematical method that used to be frequently applied when investing in securities. It is based on the assumption that both high and low prices are temporary, and that prices usually have an average value over time. When using strategies of this class, the average price value is calculated with the help of analytical methods, for example, moving averages. When the current market price is lower than the average value, the asset is considered attractive for purchase, since the price is expected to rise in the future.
When the current market price is above the average value, it is expected that the price will decline in the future. In other words, this strategy is based on the expectation that, despite deviations from the average value, the market price will still return to it. Various oscillators are often used as an indicator showing whether it makes sense to buy or sell.
An example of such a strategy is the Rubber Band system we reviewed recently.
What Is an Oscillator?

An oscillator is an indicator based on prices that tends to fluctuate or oscillate within certain fixed or fairly rigidly limited bounds. Oscillators are characterized by a certain normalization of the range and the removal of long-term price trends. Oscillators extract information from such measures as momentum and overextension. Momentum is a state in which prices move strongly in a given direction. Overextension is a state of excessively high or low prices (overbought and oversold), when prices are ready to return sharply to a more reasonable level.
Sometimes an oscillator is figuratively represented as a pendulum: the more it deviates from the equilibrium value, the greater the force acting on it, returning it to the equilibrium point. This is a very rough model, but it explains the principle behind the idea on which the use of oscillators is based. In a more accurate model, there are many more degrees of freedom. The oscillator is a pendulum, but this pendulum is fixed to the end of another larger pendulum, which in turn is fixed to the end of an even larger pendulum, and so on to infinity. Even in this respect, markets have a fractal nature.
There are two main types of oscillators. One of them is linear operators (filters), which perform certain linear transformations on a time series and mainly analyze fluctuation frequencies, acting as a kind of band-pass filters. The other class brings some aspect of price behavior to a normalized scale. Unlike the first category, these oscillators are not linear filters, that is, the operations they perform on the price chart are irreversible. Both types of oscillators react to price momentum and cyclical movements while reducing the role of trends and ignoring long-term shifts. Charts built for such oscillators have a jagged, oscillating appearance.
The simplest method of obtaining signals from oscillators is to use them as an overbought/oversold indicator. A buy occurs if the oscillator value drops below a certain threshold into the oversold zone and then returns back. A sell occurs if the oscillator rises above the overbought threshold and then drops back. There are traditional overbought/oversold thresholds used with various oscillators.

You can also use the relative position of the oscillator and its moving average, which acts as a kind of signal line. If the oscillator crosses its average upward, a buy signal is generated; if downward, then correspondingly a sell signal. The crossing of the oscillator and the signal line can be used in combination with overbought/oversold zones and the corresponding threshold levels. The resulting signals can be used both for entry and for exit, as well as only for entry with exit determined by other rules. In addition to moving averages, a wide class of trend-following and channel indicators applied to the oscillator chart can be used as signal lines, such, for example, as price envelopes, Bollinger bands, MACD, and many others.
Another well-known method is searching for discrepancies in the behavior of the oscillator chart and the price chart, namely divergence. A discrepancy occurs when prices form a new low (below previous lows), while the oscillator forms a higher low (above previous lows). Such a discrepancy gives a buy signal. In the opposite situation, when prices form a new high but the oscillator fails to reach the previous high, which is a sign of fading price momentum, a sell signal is generated. It is easy to see the discrepancy with the naked eye, but for a program with simple rules it is almost always difficult to find. Mechanical generation of signals based on discrepancy requires pattern recognition, which complicates the system and therefore makes its testing more difficult.
Mean Reversion Strategies
A moving average of any variety can be used as the trend indicator, as well as various channel indicators, for example, Bollinger Bands or Moving Average Envelopes.
In the first case, the moving average is used more for exiting a position, while the main entry signals are given by various oscillators:
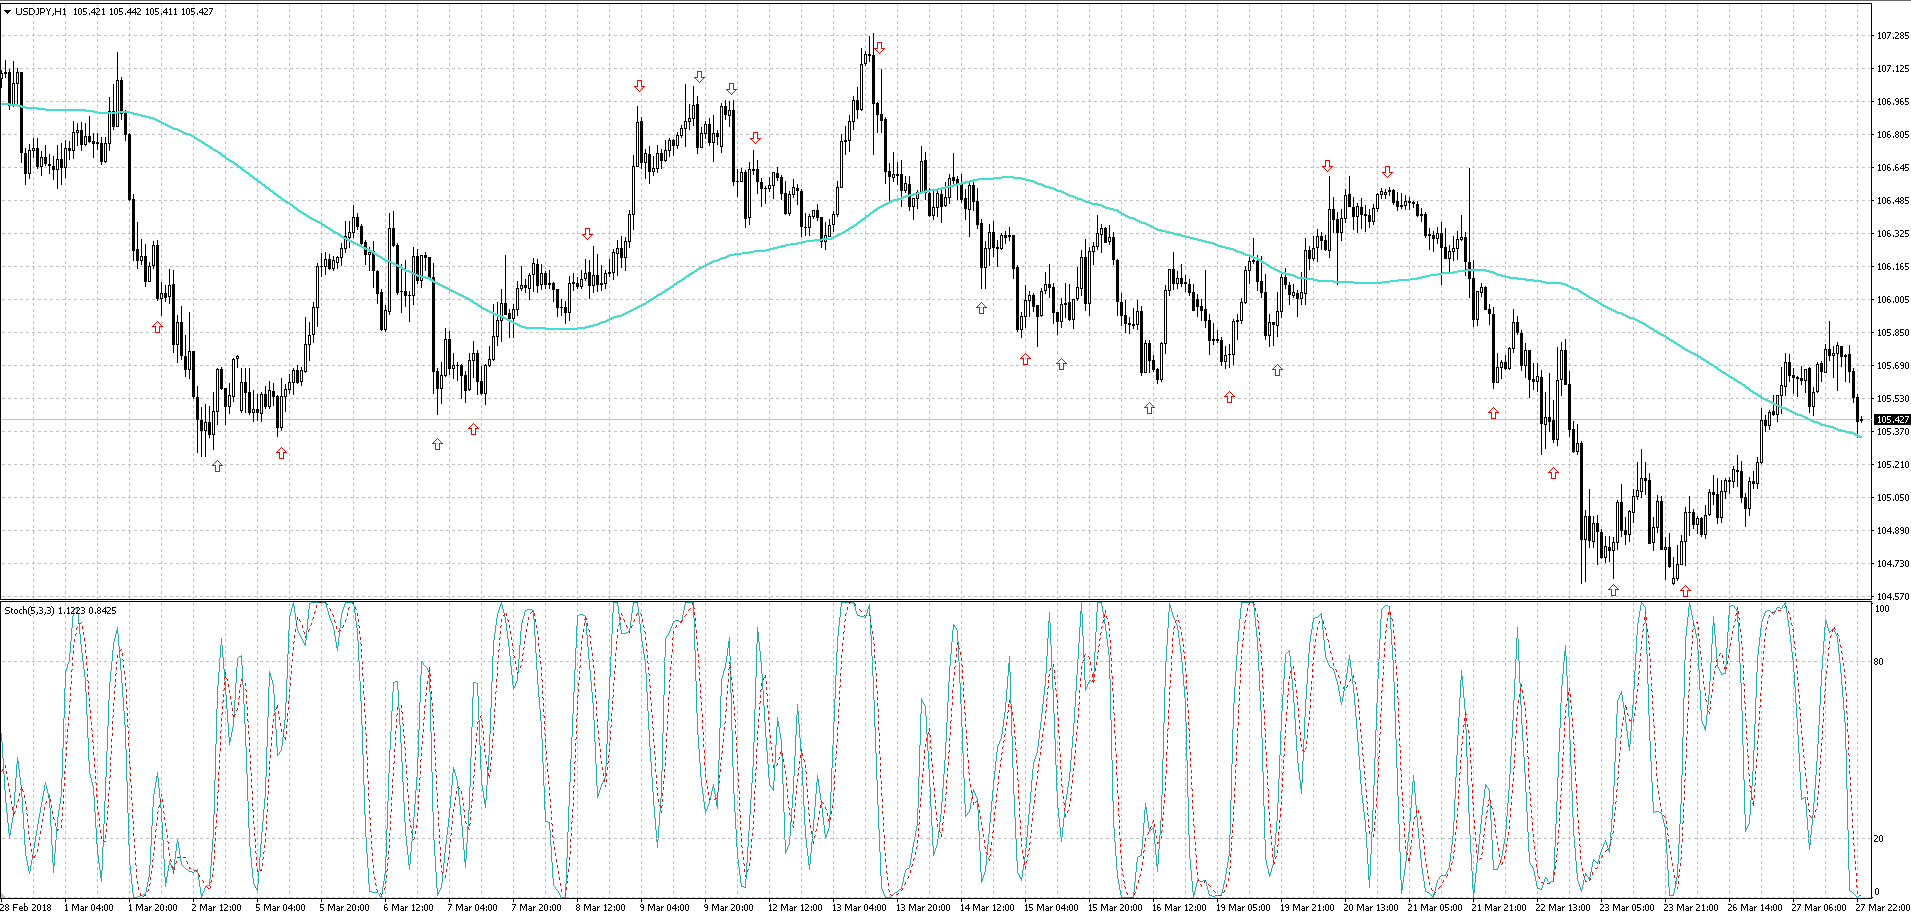 As you can see, the signals come out rather inaccurate and premature. Therefore, such strategies are often combined with a system of scaling in, with grid trading. Experiments with the type of moving average, as well as a more careful selection of the oscillator, will not improve the result much. Therefore, a whole group of oscillators is often used, which filter each other's readings:
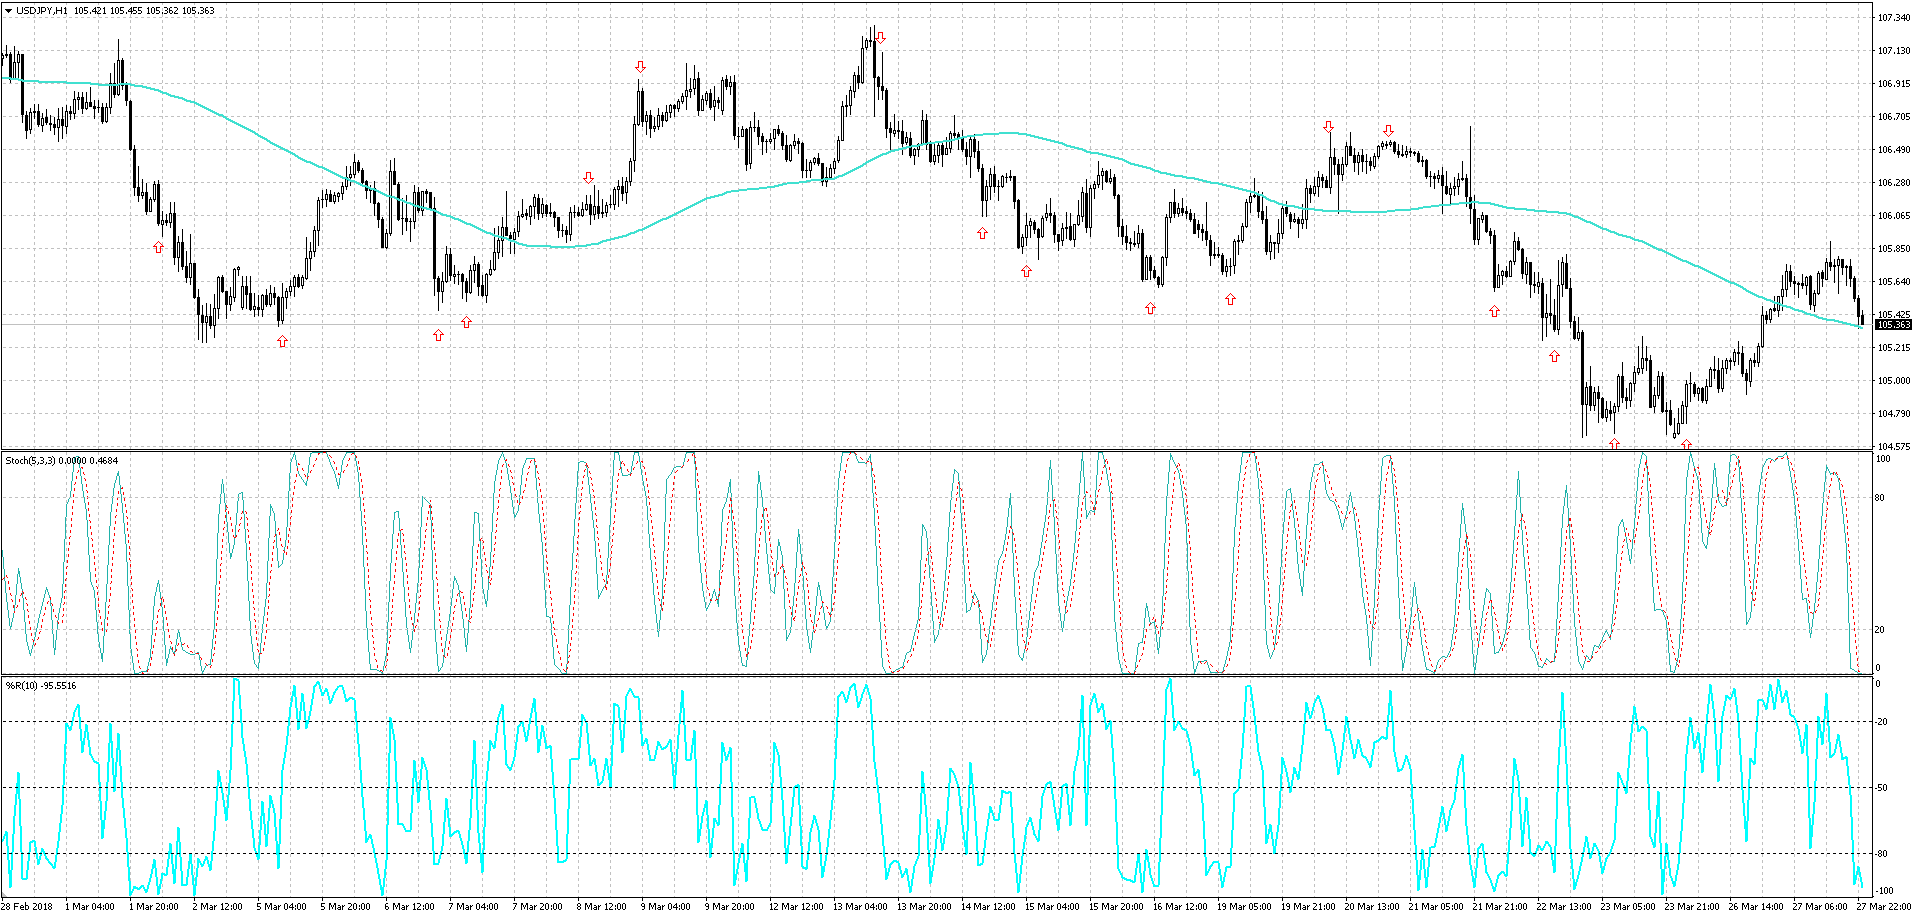 But this approach also filters out a significant portion of potentially profitable trades. The main problem when using an oscillator is that we have no information about the optimal deviation of price from the moving average; we only know that at the moment we are in oversold or overbought territory.
The simplest way to take the deviation distance into account is to set a minimum distance in points. A similar option is to use the Envelopes indicator. With this approach, you will have to constantly adjust to the current volatility, which differs not only from day to day, but also changes considerably from session to session. Therefore, it is more logical to use indicators such as Keltner channels and Bollinger Bands for these purposes:
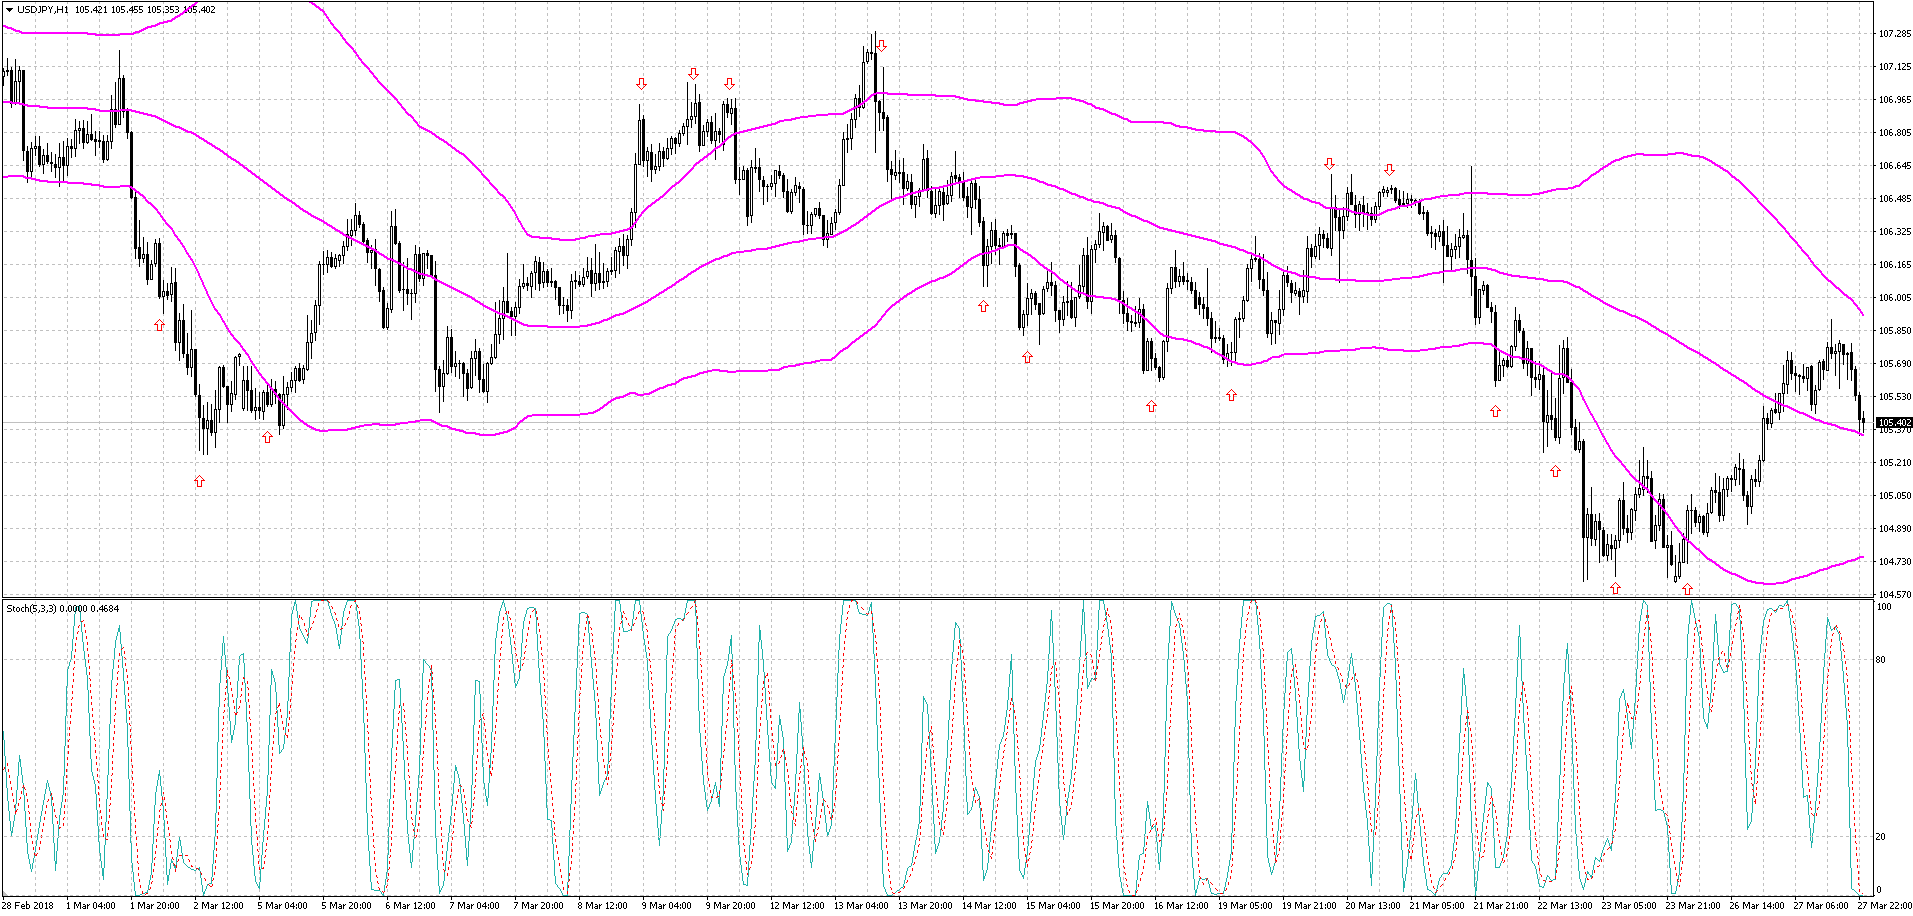
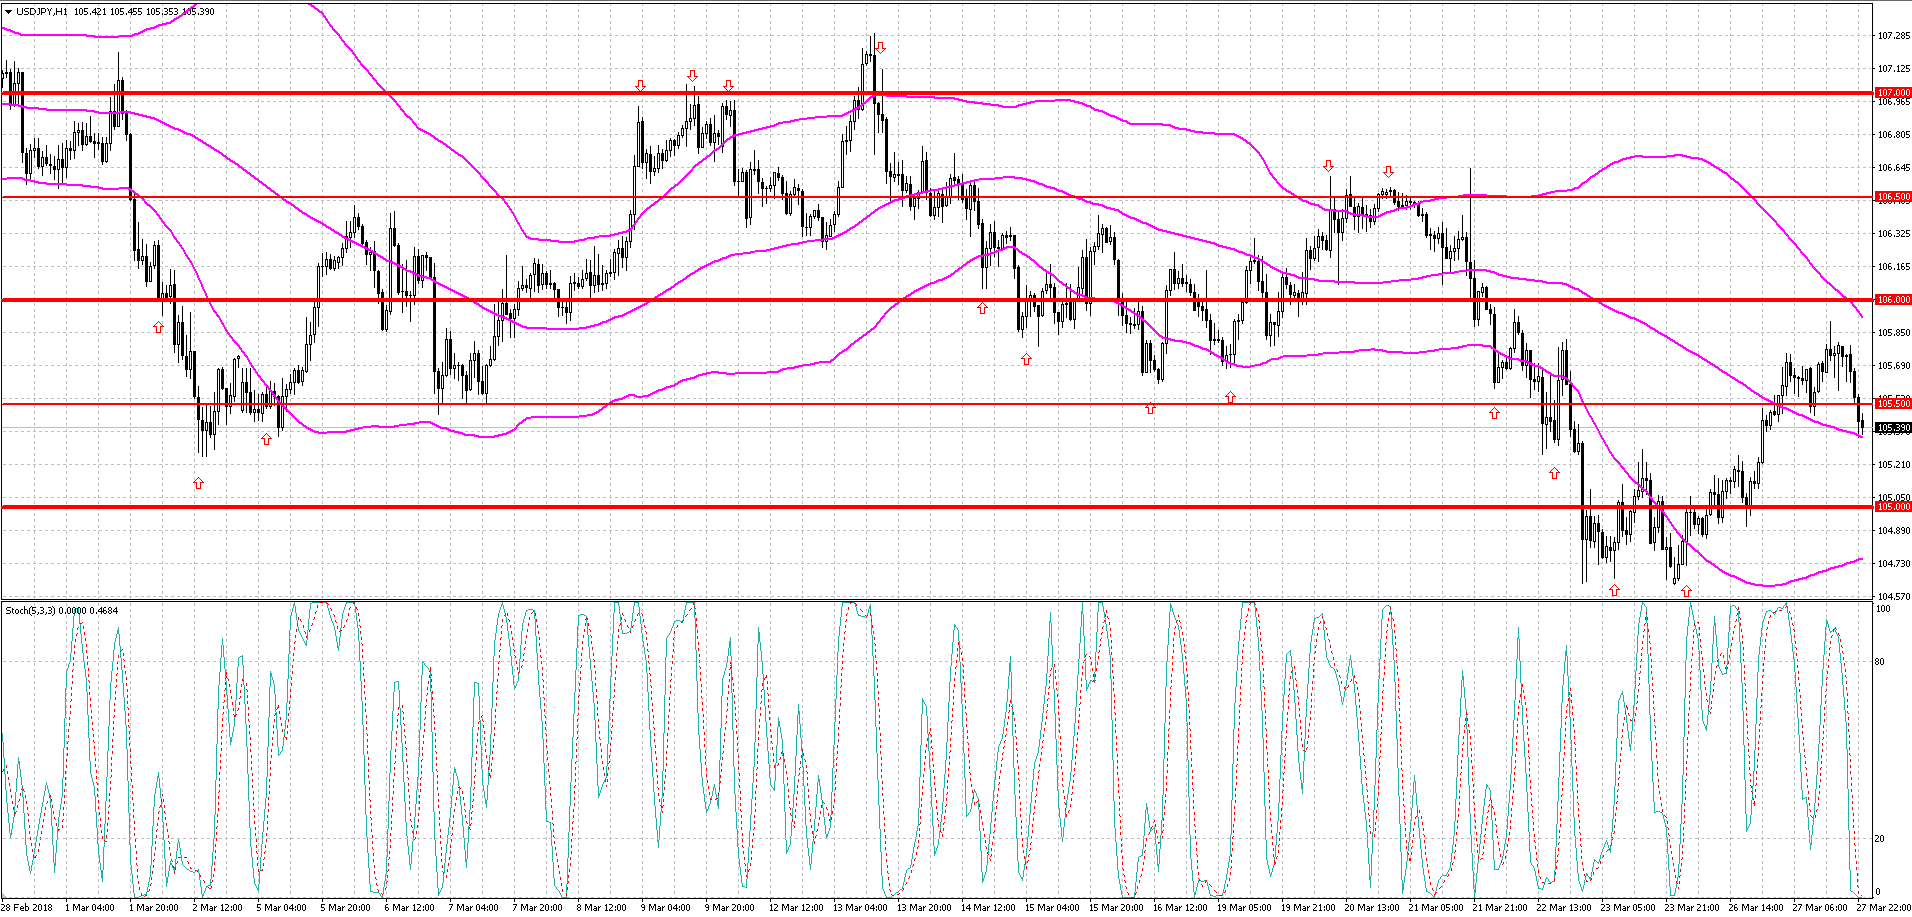 As for filters, everything is quite simple here. Most often these are time filters or volatility filters. For example, you can forbid entering the market if current volatility is too low or, on the contrary, too high. Quite often the price marks time only to continue moving in the direction of a new trend, thereby dooming the position to be closed by stop. Conversely, increased volatility may indicate a dangerous news background, when price behaves unpredictably. In such conditions, the effectiveness of using pending orders is low and often inferior to entering at market.
A time filter will also help improve the system's final results. Most often, the hours between sessions are filtered out, when volatility is very low, as well as the hours when several sessions overlap, when volatility, on the contrary, is high and strong movements against the position are possible.
Closing a position is often carried out when price returns to the area of the moving average. But, taking into account the variability of modern markets, timely closing of profitable positions and competent trade management come to the forefront. Trade management in mean reversion systems is not only the various options of trailing stop. Exits by oscillators also perform very well, allowing a position to be closed at the very beginning of an emerging price reversal.
A separate group of strategies within the mean reversion class consists of night strategies. In fact, the main differences here are the use of these strategies exclusively during the Asian session, as well as the low timeframe, usually M15, or even M5. One should also remember the disadvantages of night trading: increased spreads, swaps for carrying a position to the next day, as well as the low quality of quotes during these hours with relatively low average profits and rather impressive stops. It is not uncommon for such systems to deprive you of a month's profit in one unsuccessful night session. Even despite fairly smooth equity curves, there are quite long periods of increased volatility in the Asian session that lead to prolonged drawdowns. Therefore, night trading with mean reversion systems should not be considered a primary source of income.
Night strategies can be identified as a separate group of mean reversion strategies. In fact, the main differences here are the use of these strategies exclusively during the Asian session, as well as the lowtimeframe, as a rule, M15, or even M5. Don’t forget about the disadvantages of night trading: increasedspreads, swapsfor moving the position to the next day, as well as low qualityquotesduring these hours, with relatively low average profits and quite impressivefeet. It’s not uncommon for such systems to deprive you of a month’s profit in one unsuccessful overnight session. Even despite fairly smooth yield curves, there are quite long periods of increased volatility during the Asian session, leading to prolonged drawdowns. Therefore, you should not consider night trading of mean reversion systems as the main source of income.
Limitations when trading mean reversion

The point is that some markets lend themselves well to a mean reversion strategy, while others will result in nothing but losses if this strategy is used. This depends on many factors, the main ones being:
- what drives the price of a particular instrument (macroeconomics, reports, news, etc.);
- number of market participants;
- the ability to open short positions;
- trade volumes;
- average volatility of the instrument in question.
There is general agreement that commodity time series are better suited to continuation trading systems (trend trading,breakdownsetc.) than for systems based on mean reversion. The same applies to currency pairs, in which long-term and short-term trend movements are observed. Therefore, if fortrend strategiesBest suited periods are at least daily, then for reversals these are, as a rule, periods up to H1. At the same time, traders try to choose pairs with an average level of volatility.
Popularity of mean reversion strategies
There are at least two main reasons for this radical change in short-term market behaviorforex, in which following the trend was replaced by a return to the mean. The first is the extraordinary growth in transaction volumes in the market over the past 30 years. The buy-and-hold investing strategy that characterized much of the 1900s has given way to activeinvesting, as well as short-term trading and day trading. This increase in volumes brought unprecedented levels to the market. liquidity of assets by allowing buyers and sellers to match each other more efficiently and thus curbing the runaway trains associated with illiquid markets. Nowadays, anyone can make transactions on the foreign exchange market almost anywhere.
Mean reversion is not a universal phenomenon. The prices of some financial instruments have such a tendency, while others do not. This makes many analysts and traders view mean reversion with a certain degree of skepticism. Nevertheless, these systems can quite well bring traders very good income, especially during periods when there are no trends at all.
Conclusion

Mean reversion is not a universal phenomenon. The prices of some financial instruments have this trend, while others do not. This causes many analysts and traders to view mean reversion with some skepticism. Nevertheless, these systems may well bring very good income to traders, especially during the absence of any trends.
Best regards, Dmitry aka Silentspec
TradeLikeaPro.ru
