
Mean Reversion Indicator - a ready-made channel strategy
 Good afternoon, friends!
Support and resistance levels are an excellent technical analysis tool. However, sometimes it is difficult to determine whether a breakout has really occurred, or whether the price is simply testing the level. The Mean Reversion indicator helps identify false breakouts, improving the quality of analysis.
As is well known, price has the ability to always return to the mean. The indicator exploits this feature, using a somewhat non-standard mathematical approach. It is based on regression analysis, specifically polynomial regression, on the basis of which the so-called "center of gravity" of price is formed. The indicator makes it possible, with a sufficient degree of probability, to determine whether price will break through a support/resistance level and continue moving in the intended direction, or rebound from it. Today the Mean Reversion indicator is the hero of our review.
Indicator characteristics
Platform: MetaTrader4
Currency pairs: any
Timeframe: any
Trading time: any
Indicator type: channel indicator
Recommended brokers: Alpari, Roboforex, Amarkets
Indicator description

The indicator is installed according to the standard instructions and is a price channel consisting of 7 lines. The dashed line in the center is called the "center of gravity." In fact, all the other lines are calculated on the basis of the standard deviation from the central one. The channel has overbought and oversold zones, located between the gray and outer channel lines. These two zones deserve special attention.
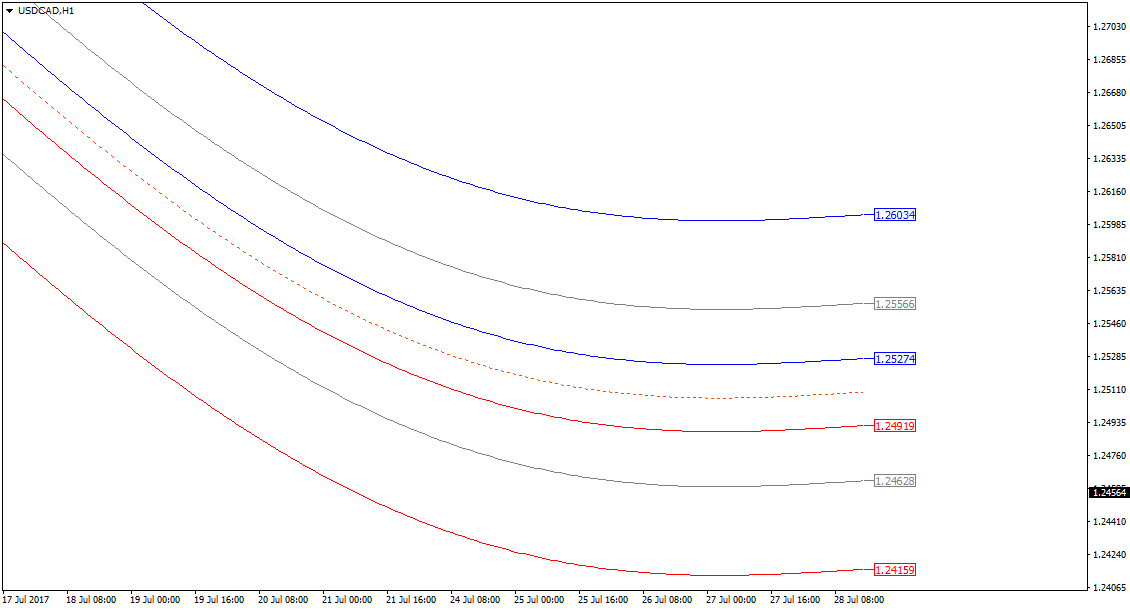 The indicator settings include 4 items:
- Enables or disables price labels on the right side of the chart;
- Number of bars for the calculation;
- Standard deviation coefficient — affects the spacing of all lines;
- Relative position of the middle lines (gray) — takes values from 0 to 1.
Indicator signals

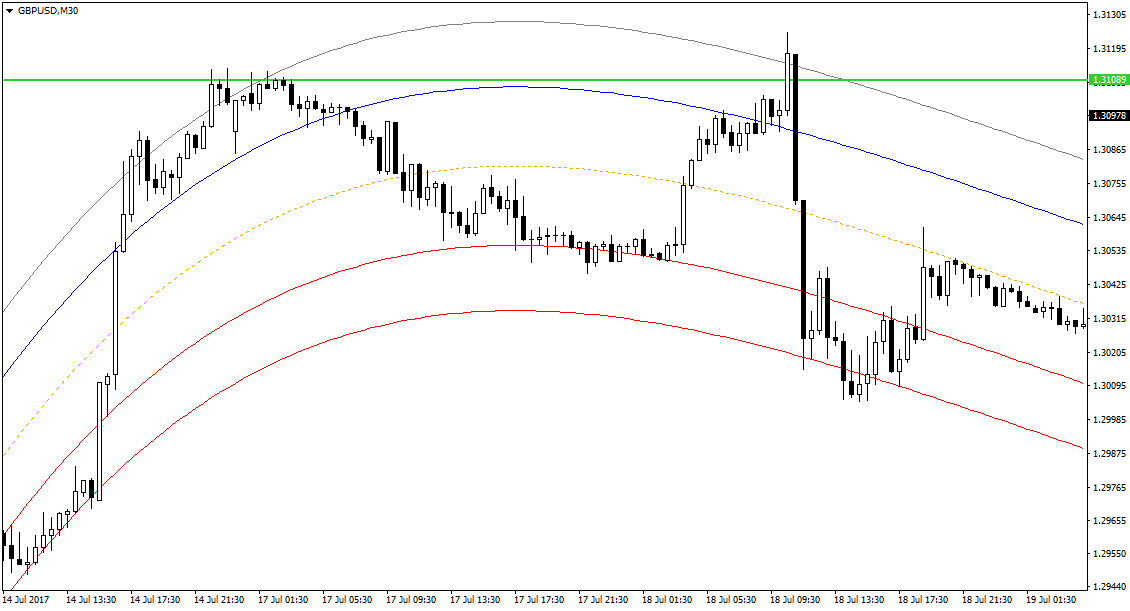
The main task is to determine whether the market is in an overbought or oversold zone. Let us look at a simple example. Suppose price breaks through a certain resistance level. How can you determine in that case that the breakout is false? The generally accepted method is to wait for confirmation — the closing of a candle beyond the level. However, such a method does not give a 100% correct result.
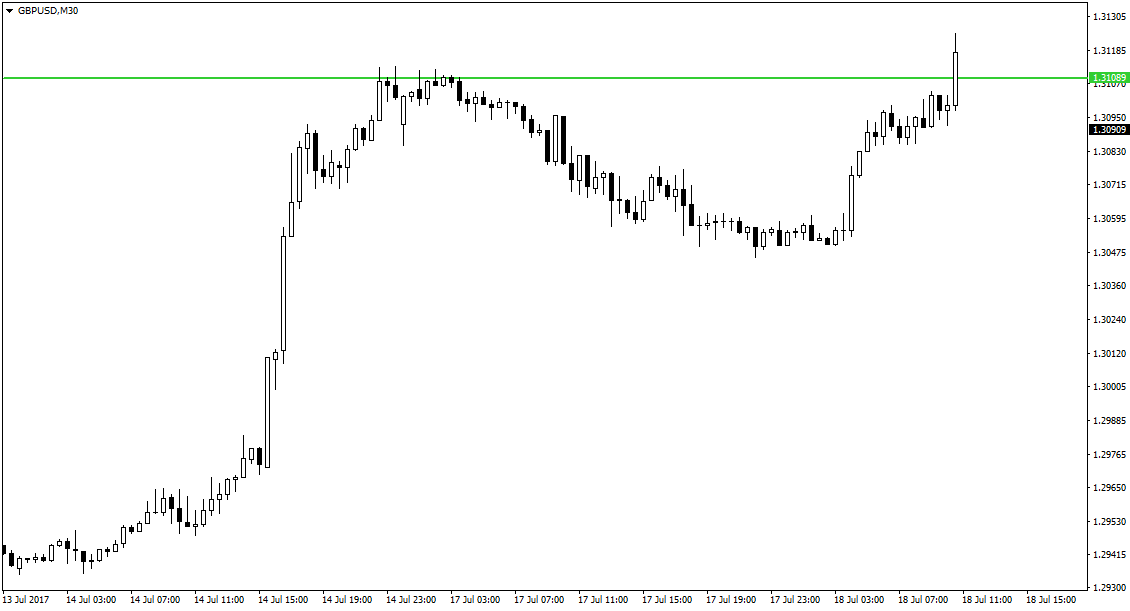 The Mean Reversion indicator draws a channel that defines the extreme zones for price. The outer channel lines define the overbought and oversold zone. In this case, price touches the upper line, which is a strong sign of buyer exhaustion — the market is simply unable to cope with the pressure.
 Another way to use the indicator is to determine the exit point from a position. Suppose you opened a sell order following a downtrend. The task is to determine when the trend will end and the price will reverse in the opposite direction. A fairly reliable signal is the price entering the oversold zone — touching the lower boundary of the channel. This means that the market is exhausted, a rebound will most likely occur, and this is the right time to lock in profits.
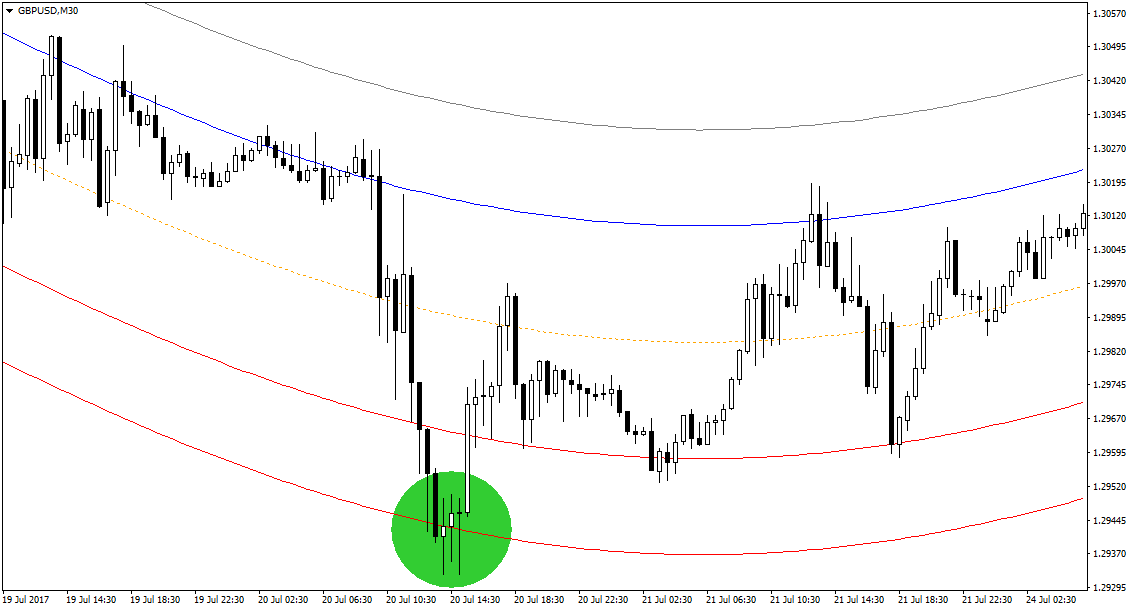 Following the same principle, you can enter at a favorable price on trend pullbacks. For example, in the case of an upward trend, enter or add when the lower boundary of the trend channel is touched.
How to trade
Opening a buy order:
- The channel is directed upward;
- Price is near an important support level;
- At the same time, price touches the lower channel line.
Opening a sell order:
- The channel is directed downward;
- Price is near an important resistance level;
- At the same time, price touches the upper channel line.
The procedure is as follows:
- Mark the nearest levels;
- Determine the direction of the channel;
- Wait for the simultaneous touch of the level and the outer channel line by price.
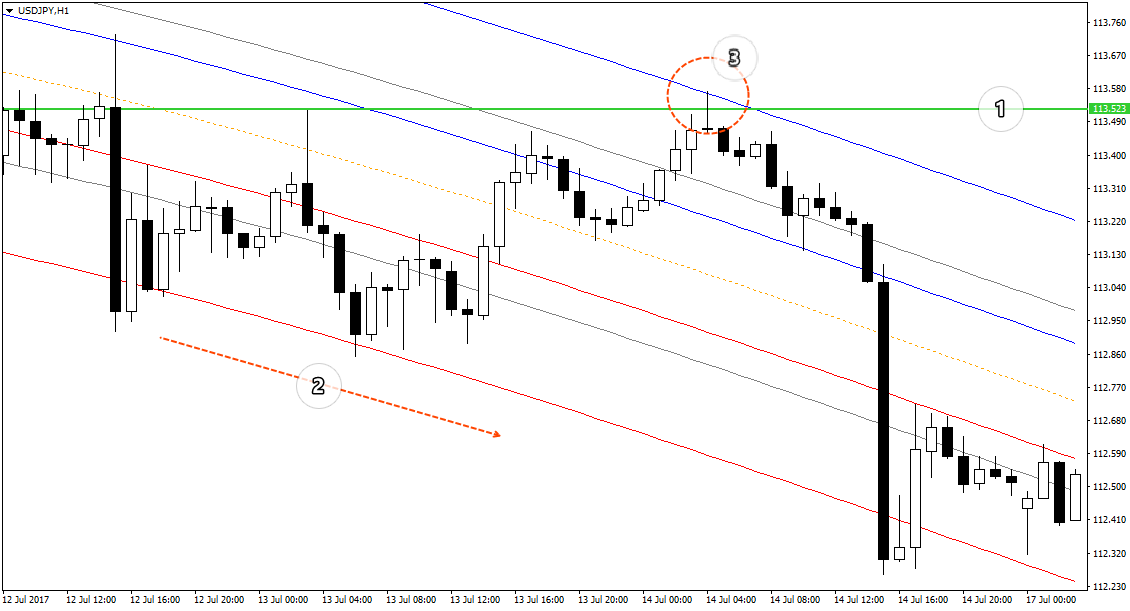 Stop loss is placed slightly below the support level. Also, as the stop loss level, you can take the value of the outer channel level several bars back.
Exit the position when the opposite side of the channel is touched. When an opposite signal appears, enter the position again.
Examples

One of the main advantages of the indicator is independence from a specific trading pair and timeframe. The indicator performs equally well on both crosses and majors. The only thing is that during the first installation it is necessary to adjust the parameters to the instrument's volatility so that price remains inside the channel most of the time.
An example of a typical trade: the price touches the outer side of the channel, moves horizontally for some time (usually a short time), and then shoots toward the opposite boundary. A stop loss in such a case is needed in case of force majeure circumstances, when the market begins to behave unpredictably.
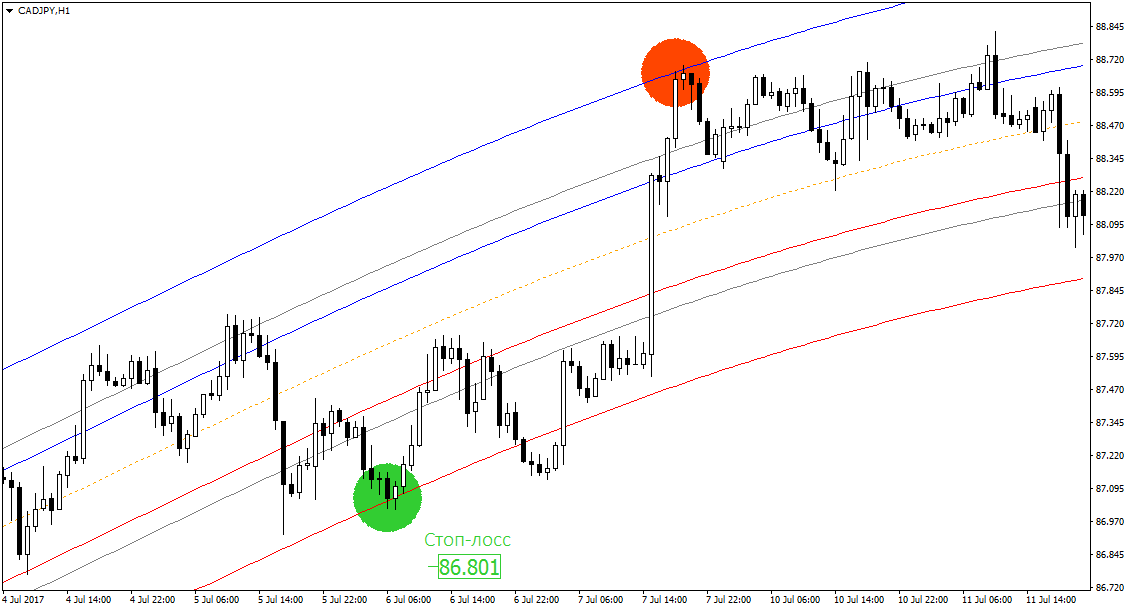 If the price, before reaching the opposite line, forms another entry signal in the same direction, it is allowed to use add-ons. In that case, the stop loss can be moved to the break-even level of the first order.
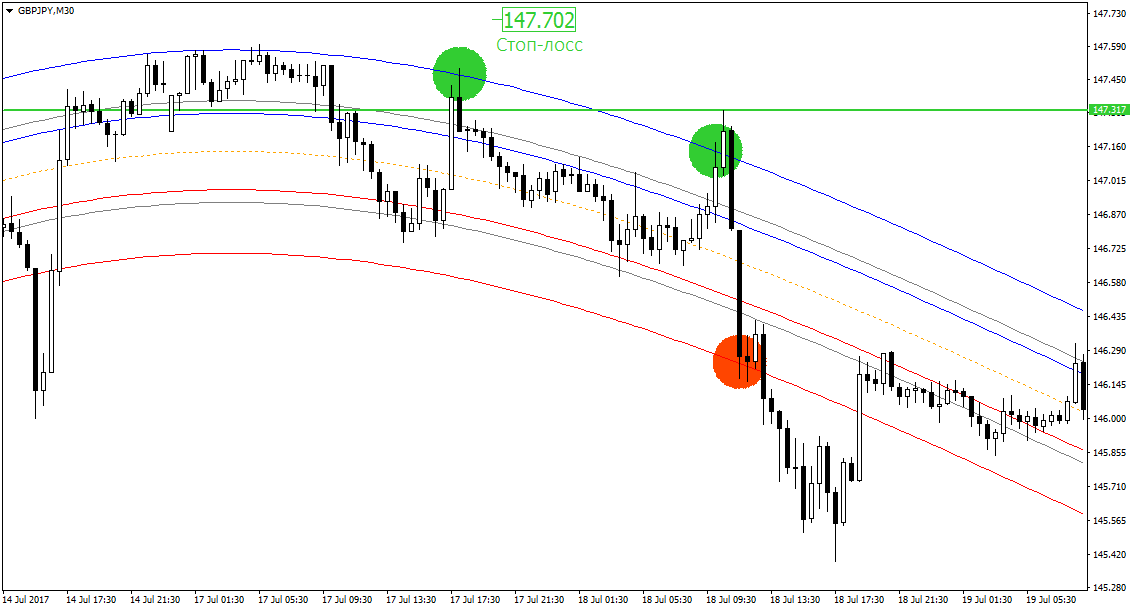 Naturally, the strategy shows the best results in a channel. In that case, there is no need to mark levels, since these are the boundaries of the horizontal channel. The profit on such movements is, of course, not the largest, but it is almost guaranteed.
Conclusion

Mean reversion is a multipurpose tool that can be used both to confirm an entry into a position and to find the best exit point from it. Much better results can be achieved by adjusting the indicator parameters to the volatility level of the trading pair so that the price remains inside the channel boundaries more than 90% of the time. In that case, identifying overbought and oversold zones will be the most accurate.
Download the Mean Reversion indicator

Best regards, Alexey Vergunov TradeLikeaPro.ru
