
Market Profile - separating truth from noise

Hello, fellow forex traders. Candles on the chart sometimes do not give a completely accurate picture of what is happening. Too often we miss the forest for the trees because of insignificant price movements.
But what if you could see the most important price values, separate true value from speculation? See the real trend, without unnecessary maneuvers distracting your attention? Today we will get acquainted with just such a method, invented many years ago on the Chicago exchange, meet the Market Profile.
Normal distribution
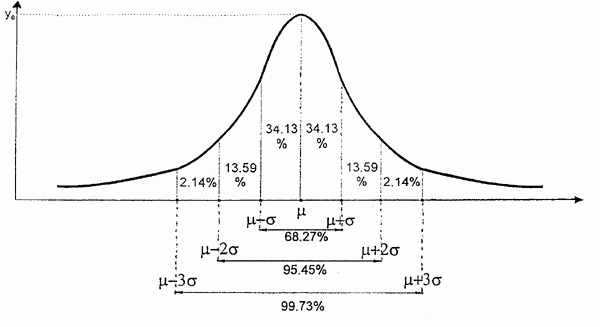
Before we move on to defining the market profile, we should mention the "normal distribution," on which the whole idea is based.
Normal distribution is a probability distribution that plays a crucial role in many fields of knowledge, especially in physics. This phenomenon also occurs in the Forex market.
Examples of normal distribution in our lives include such phenomena as deviation in shooting or the measurement of various quantities, human height, and, of course, normal distribution also occurs in the Forex market.
A characteristic property of the normal distribution is that 68% of all its observations lie within the range of plus or minus one standard deviation from the mean reference value.
This distance is marked in the figure above.
These are the most valuable data. In our case, these are the places where the price traded most often during the day.
The range of plus or minus two standard deviations contains 95% of the values of the normal distribution. All other data are not so important.
How can this information be useful to us in trading?
In order to apply normal distribution in the market, we need to focus only on the value area, that is, within plus or minus one standard deviation of all the day's price values; we will not pay attention to all other prices.
In addition, we should take the most important reference price of the day, which is located in the middle in the figure above. But I want to note right away that on trading days it will not necessarily be in the middle.
Market Profile

This is what the market profile looks like on the chart:
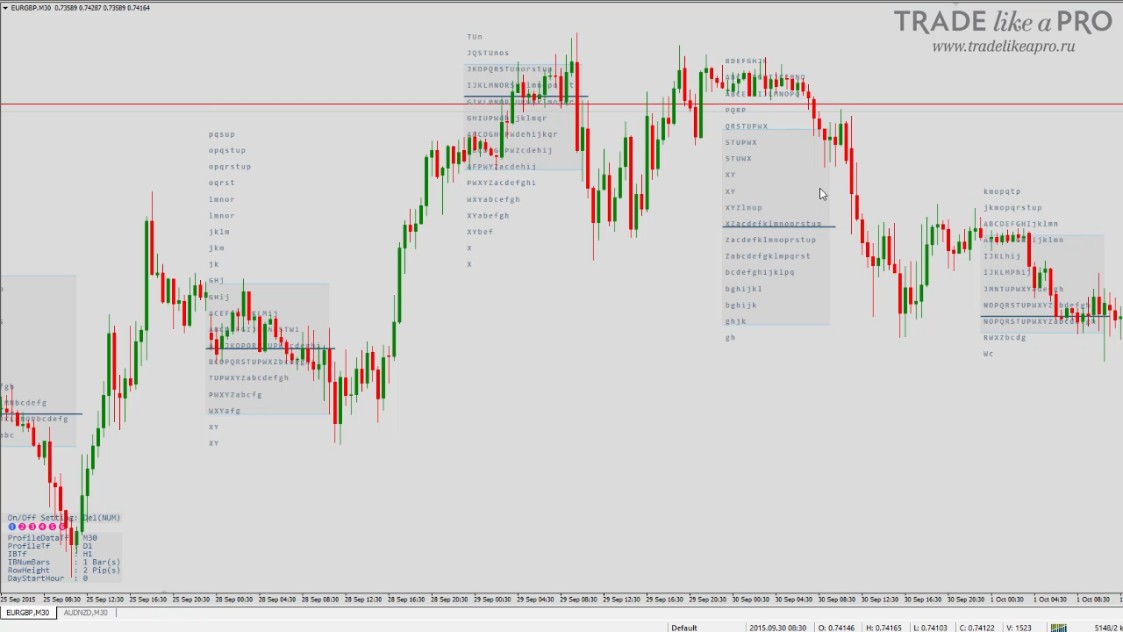
This method is based on the principle of normal distribution, and it first appeared on the Chicago exchange. The market profile defines the value area (Value Area), namely, where the price was 70% of the time during one day.
This market analysis technique is suitable for short-term trading, and you can trade both intraday and over 2-3 days. More long-term signals will need to be sought based on some additional factors.
The market profile allows us to find 2 price points, the area between which we can call the value zone, and with its help we can separate unnecessary noise.
We can call the value area the zone that has real priority on the price chart. As you can see, a special indicator is used here. The link to it is at the end of the article.
In fact, there are many such indicators for displaying the market profile in MT4. They mainly differ in visual details and additional functions, but from a practical point of view they are all the same.
The place where the price traded most during the day, in other words, the value area, can be determined by eye, but with the help of an indicator it is much more convenient to do. There is nothing magical about the market profile, and I am sure that everyone will be able to understand this trading tool.
The indicator that I present in this article is called: riv_ay-TPOChart. It is installed on the chart as usual according to the standard instructions available on our website.
If for some reason this indicator does not suit you, you can simply type TPOChart into a search engine and you will find plenty of similar indicators.
The timeframe commonly used for market profile is M30, but you can do your analysis on M30 and open positions on any other timeframe that is familiar for your trading.
Let us take a closer look at the chart with the indicator:
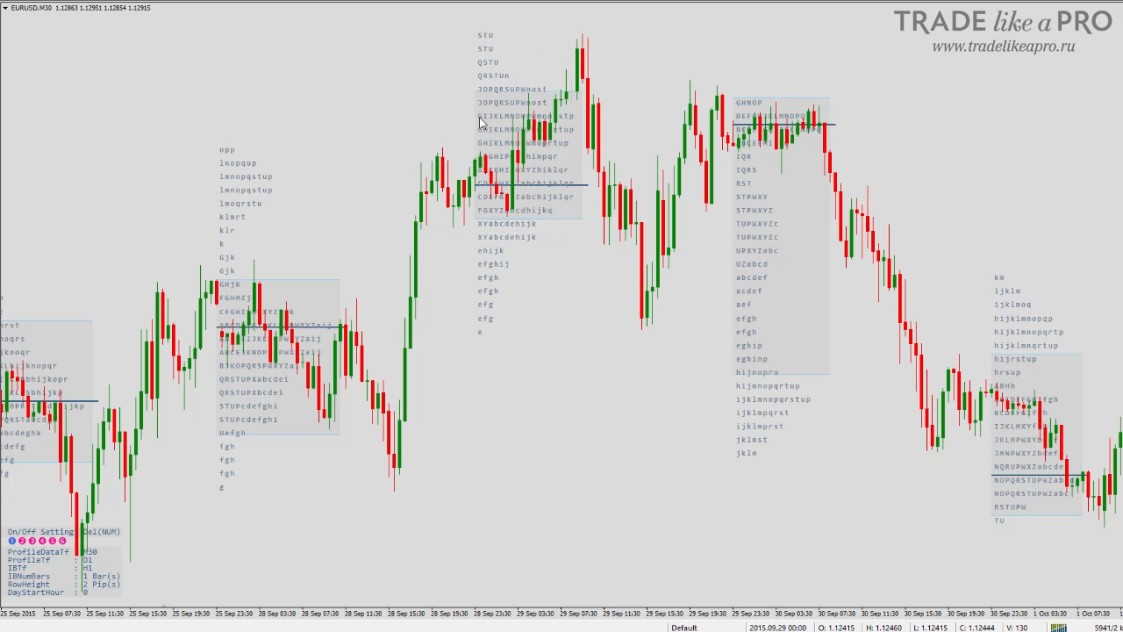
We can observe various letters on it. They represent one candle or one price bar.
If we place a ruler over it, we can see that one row of letters matches one candle:
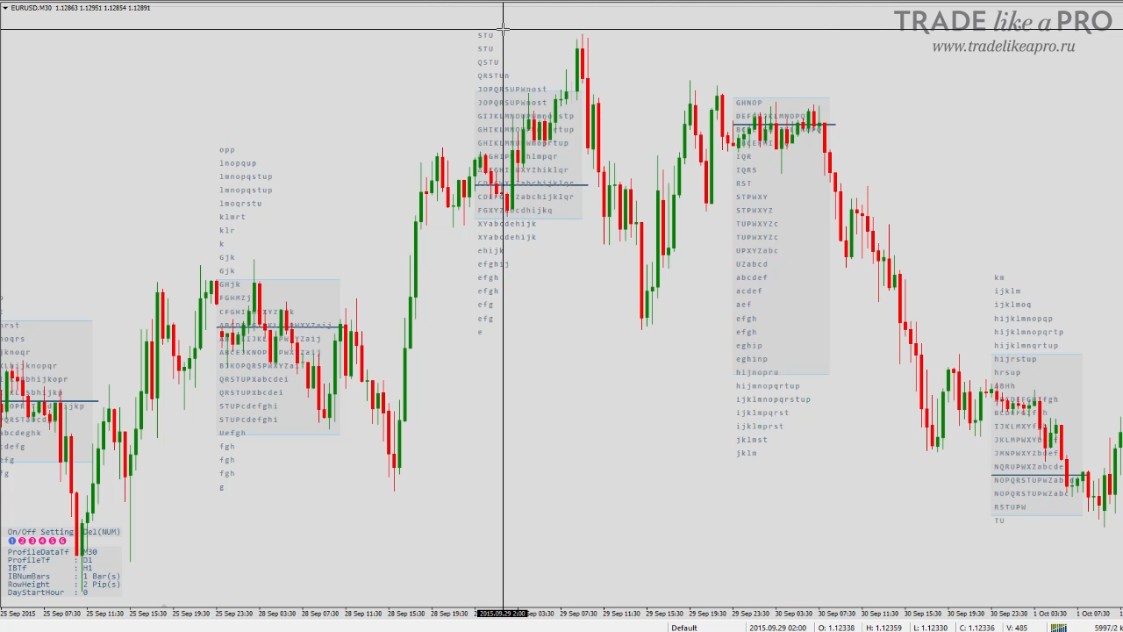
If the indicator shows only one letter, then accordingly only one candle was in that area on that day.
That is how the letters are distributed on the market profile.
If you change the indicator settings, these letters will be colored differently depending on the trading session in which the letter appeared:
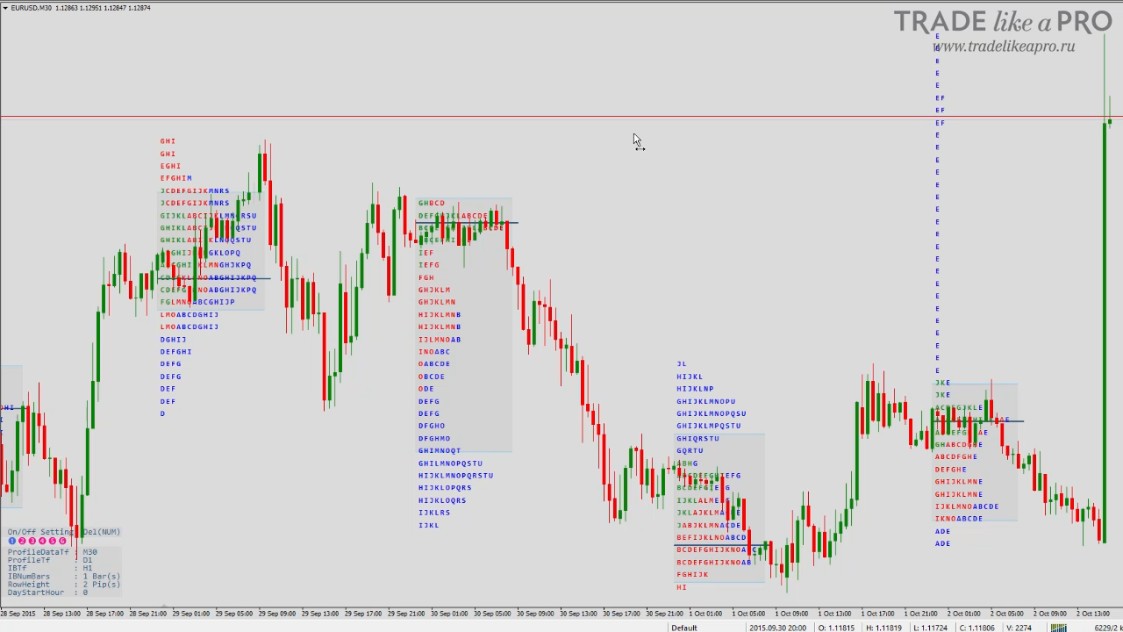
You can also disable the display of letters in the settings and replace them with squares:
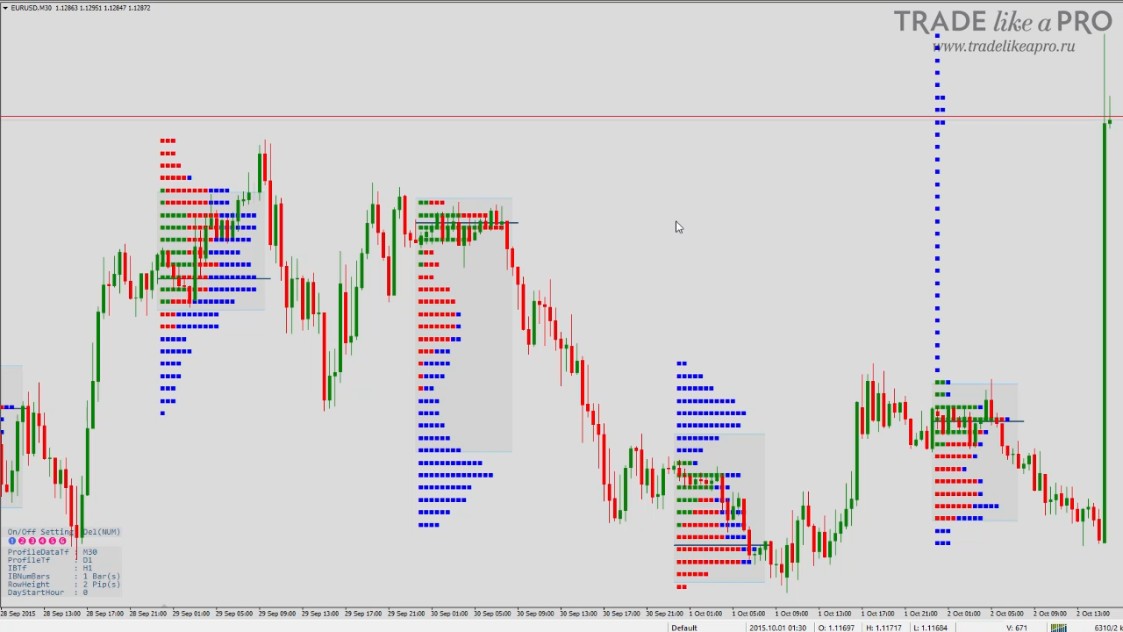
All of these are simple visual settings of the indicator. For some, it will be more convenient to look at letters, as in the classic version, while for others squares will be more convenient as a clearer option.
Next, on the chart we can observe the middle lines.
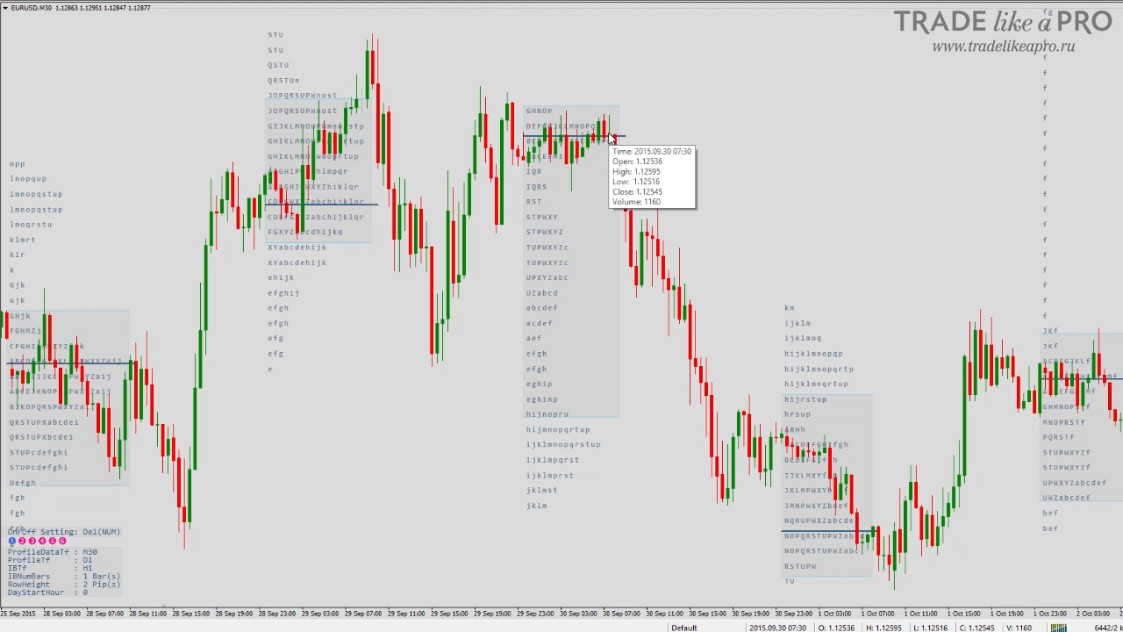
This is the Point Of Control, that is, the most important price for the given day, or the place where price spent the greatest amount of time.
In a normal distribution, about 70% of the data has value for us, or the zone in which price spent 70% of its intraday time. It is this value area that is highlighted by a gray square. Everything else is price noise to which we pay significantly less attention.
The middle line is the Point Of Control. The area highlighted by the gray square is the value area. And the zones where we have one or two letters are the low-resistance area.
Such gaps, like gaps, gradually tend to close:
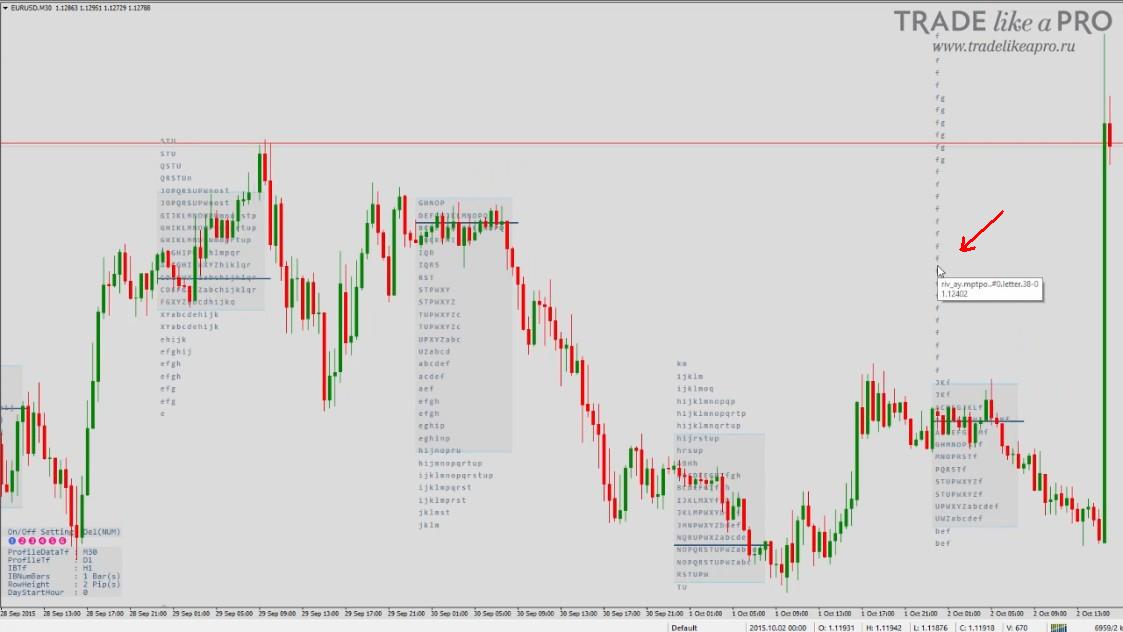
Everything that is not included in the gray square is called the rejection area, these are the places where price did not linger on that day.
How is Market Profile applied in practice?

Now let's figure out how to apply the market profile in practice.
First of all, it is worth noting that the market profile makes it possible to see the true trend through the movement of value areas. If the price does not return to the areas of previous days, then there is a strong and clearly expressed trend.
If the value areas overlap one another, then we can say that there is no clear trend at the moment.
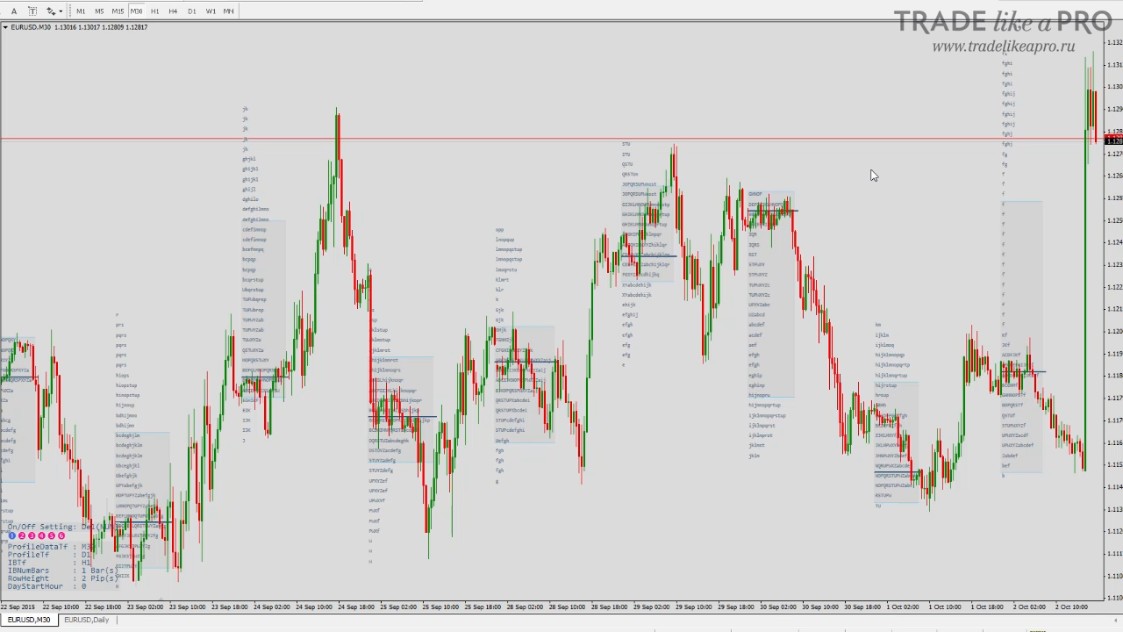
Gaps in poorly traded areas, zones where there is only one letter, just like GAPs, get closed.
If there is no trend present, then most likely one letter will be closed by the end of the day, or within 1-2 days. At this moment the market is trying to restore balance. Therefore, it is possible to develop a tactic aimed at working with this aspect of the market profile.
If you see one letter and at the same time do not observe a clearly expressed trend, then you can expect that this letter will be closed by a move in the opposite direction.
The boundaries of value areas are very often used as support and resistance levels built on the basis of the market profile. As a rule, this tactic is used when value areas fluctuate inside a range formed after a strong move.
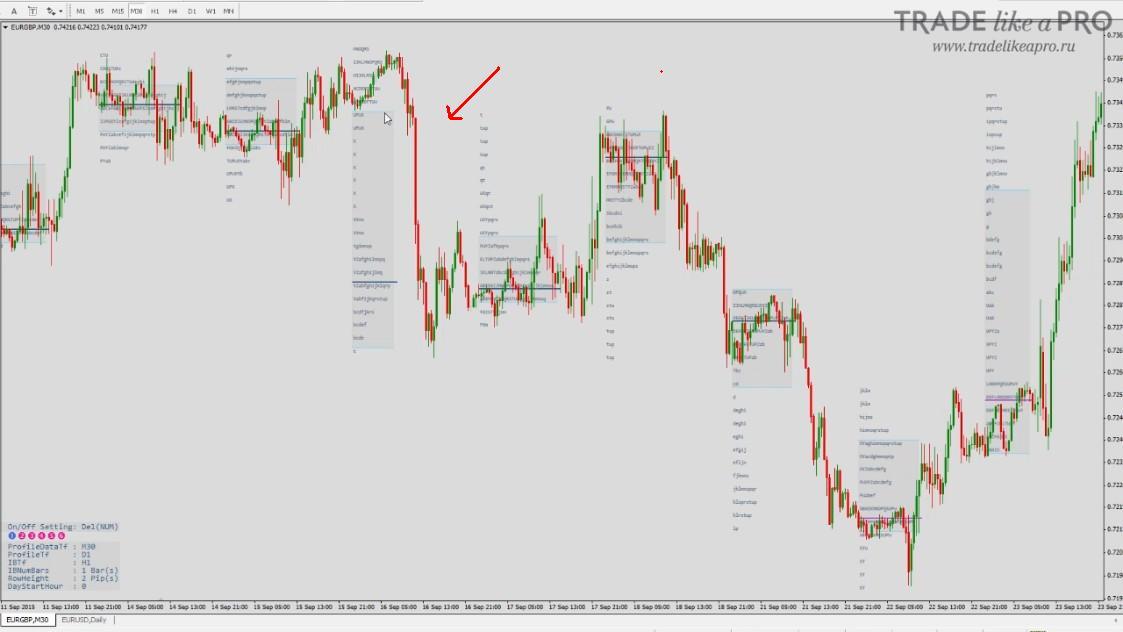
To put it more simply, the value areas overlap one another, and a strong price movement acts as the mother candle.
In general, we observe the inside bar pattern, with the outside bar highlighted by a more extended value area and the following two candles located inside it.
You can work a breakout or a bounce from value areas. The method is the same as when working with Price Action while trading the breakout and rebound of levels. The only difference is that we define the levels by the boundaries of the value areas of the mother candles:
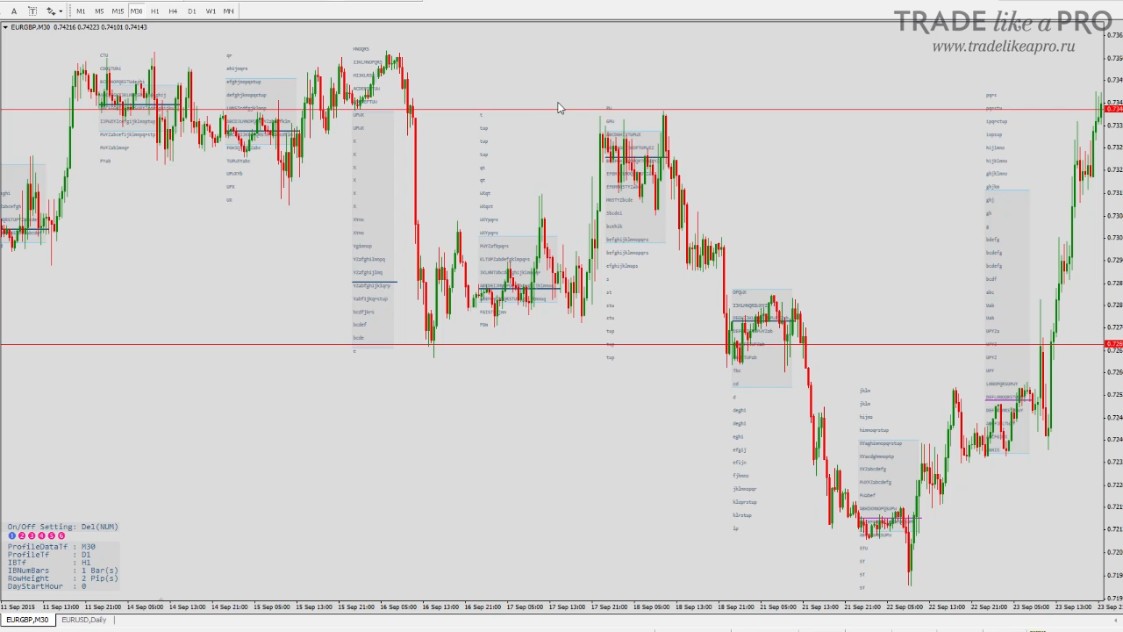
The boundaries of value areas can also be used for placing stop-losses.
If we were considering some sell positions, then it would be logical to place a stop-loss slightly above the boundary of the upper value area:
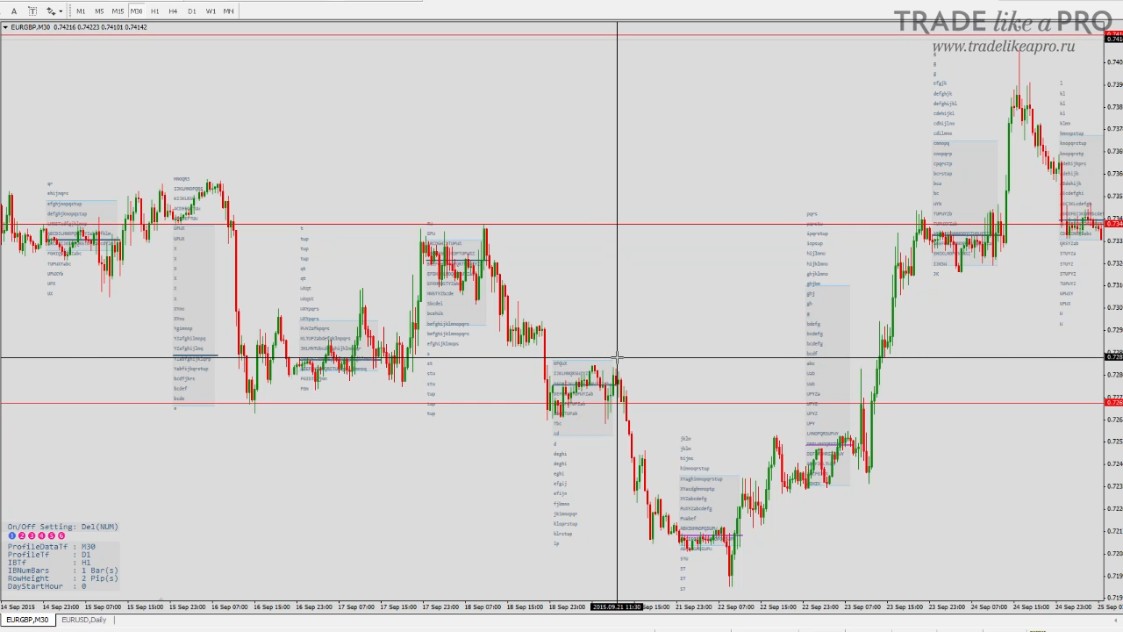
In my opinion, one of the most valuable applications of the market profile is trading in a flat, or more precisely understanding when the flat has ended.
Let us imagine that there are several days during which a flat is going on. Suppose that the designated day has not yet arrived:
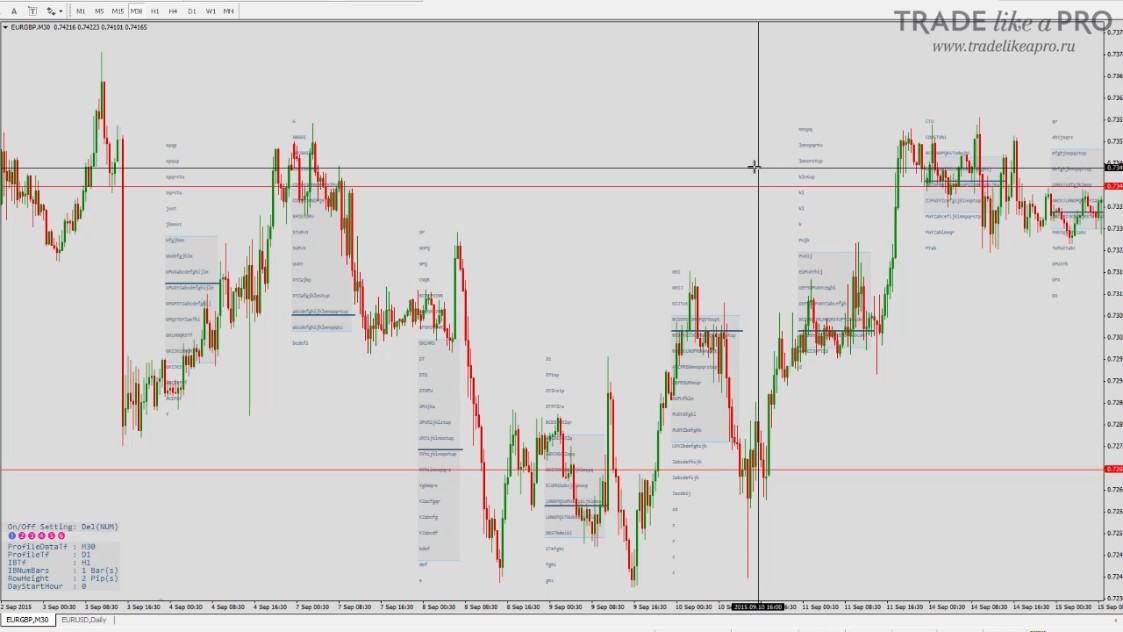
We can build the boundaries of this section by the value areas. Not by the candle tails, but specifically by the value areas.
Remember that technical analysis is an art, not an exact science, so we set the values approximately in order for a picture of what is happening to take shape:
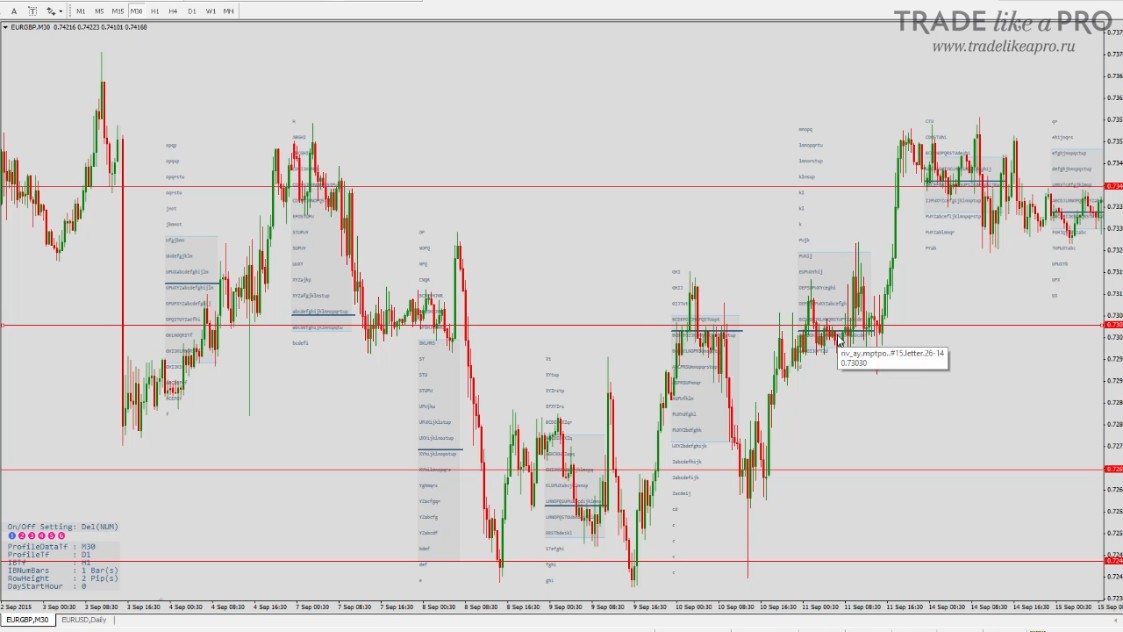
At these boundaries, we can quite reasonably work a breakout. When the breakout occurs, we understand that, overall, the flat has ended, and we can profit from it.
I would like to add that this use of the market profile fully justifies itself.
Indicator for Building the Market Profile in MT4
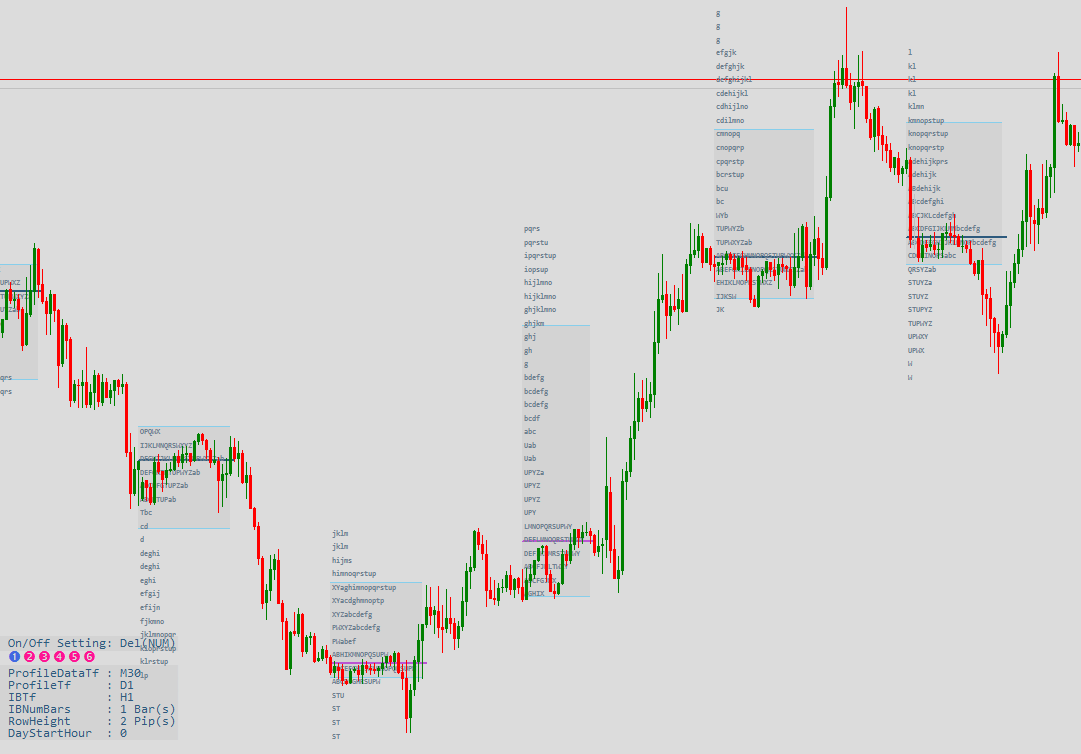
Indicators for Metatrader 4 designed for building a Market Profile are quite numerous, but because of constant terminal updates most of the indicators currently do not work. I suggest using the riv_ay-TPOChart.v102-6 indicator. It has a large number of options and, most importantly, is compatible with the latest MT4 builds.
Installation into the terminal is done according to the standard instructions. Timeframe - M30
Description of the indicator settings

- LookBack - the number of days over which the Profile will be built
- ShiftBrokerofGMT - the broker time shift from Greenwich Mean Time. In fact, this setting determines from which hour to build the profile
- ShowPriceProfile - whether to show the price profile
- ShowFromStartPeriod - do not change this setting, otherwise the display will be thrown off
- ModeLetter - on/off display of the profile in the form of letters
- ModePseudoLetter - on/off display of the profile in the form of squares
- ShowColorBySession - on/off coloring by trading sessions
- ShowProfileInfo - on/off display of additional information: boundaries, span, and so on
- ShowPoc_AsLineSupRes - on/off display of the day's point of control as a support/resistance line
- ShowPocInfo - on/off display of information on control points (prices) on the right side of the chart
- ShowCurrentTVPO - show the current market profile data and the volumes traded at price levels
- ShowVAHL_Lines - on/off display of the value area boundaries as lines
- UseVaHL_AsLineSupRes - whether to build support and resistance levels based on the value area boundaries
- ShowOHLCbar - display of the current daily candle to the left of the profile
- BarH4asThinkorswim - display of H4 candles with a time interval as in the ThinkOrSwim platform
- ShowIB - on/off display of the Initial Balance, what this is we will cover in subsequent lessons
- ShowDIB - on/off display of the Double Initial Balance
- UseTruePoint - do not touch this setting, it was used for previous versions of the indicator
The remaining settings are responsible for the indicator's display and for nuances in symbol specifications; if everything is displayed normally for you, it is not worth touching them.
Download the Market Profile Indicator for MT4

Conclusion

Market profile is quite a multifaceted tool. In this review we became acquainted only with the basics. We will consider more in-depth trading tactics and strategies in future lessons, so keep an eye on the site's updates.
Respectfully, Pavel Vlasov TradeLikeaPro.ru
