
Market Facilitation Index - Bill Williams' Volume Indicator

Market Facilitation Index (BW MFI) was created by Bill Williams at the moment of a radical revision of approaches to technical analysis of the market. A new vision of forecasting and evaluating trends by this talented theorist and practitioner was set out in the book "Trading Chaos", which gave traders both standalone indicators and full-fledged trading systems.
In today's article, we will take a detailed look at the legendary trader's indicator.
Indicator Characteristics
Platform: Metatrader or any other
Currency pairs: any
Timeframe: any
Trading time: around the clock
Recommended brokers: Alpari, RoboForex, FortFS

Despite the exotic title of the work, Williams managed to find simple approaches to organize the price chaos of quotes. BW MFI, or the "market facilitation index," visualizes the impact of trades by market participants on the current trend, automatically comparing the current volume value with the price range.
The importance of Bill Williams' contribution to market analysis theory is reflected in a separate "Indicators" section of the MT4 terminal, which contains six tools authored by him. BW MFI was also included in this set, and it can be found in many widely used trading terminals.
Indicator Formula

The study and description of the influence of volume on the trend began as early as the start of the 20th century; by the middle of the century, these assessment methods had formed a separate field - Volume Spread Analysis (VSA). At the time Bill Williams wrote the book, traders analyzed the current trading volume by visually comparing it with the price range on the chart.
VSA theory operated with four basic concepts:
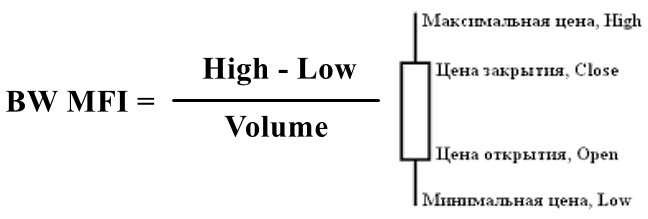
Bill Williams reflected all of the above points in one concise formula of the BW MFI "market facilitation index":
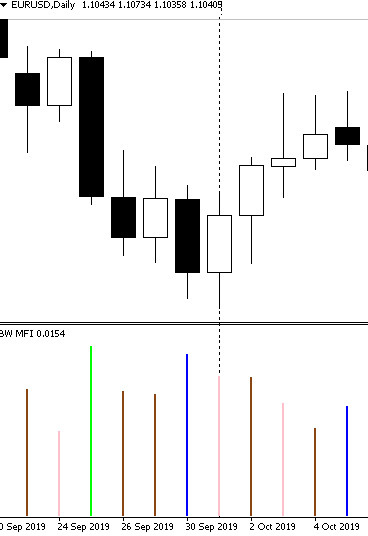
The calculation results were displayed on the chart as a four-color histogram depending on changes in the numerator and denominator compared with their previous values, in order to take into account the fourth VSA postulate:
The formula covers only three of the four rules described above. The closing price of the candle and the direction of the trend must be determined by the trader independently by analyzing the chart.
The Volumes parameter in trading terminals is expressed in natural units: the number of shares or derivative contracts (futures, options). It is possible to obtain the real currency volume on the Forex market only on accounts of the ECN type; in all other cases the Metatrader terminal gives the number of ticks - Buy/Sell trades.
Description of How the Indicator Works

Market Facilitation Index, like many volume indicators, is used as part of trading systems only as a filter for signals for trades.
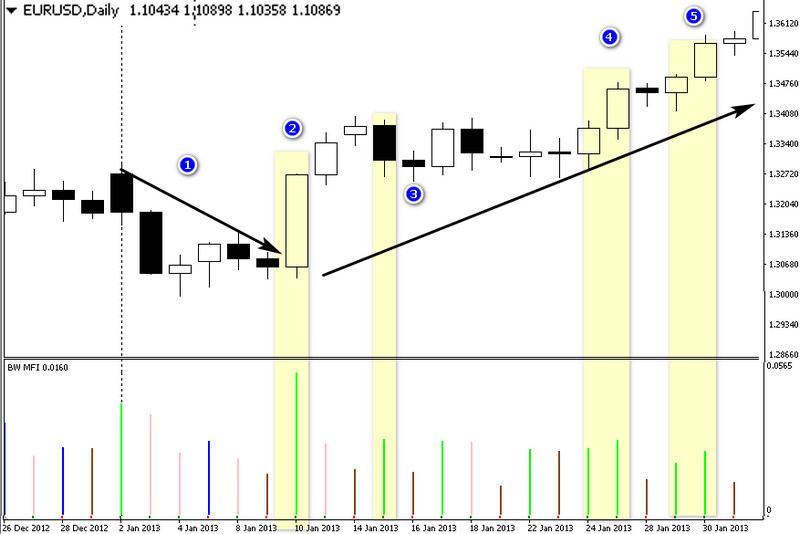
The main colors of the indicator are considered to be green histograms that confirm the trend in the direction of the candle's closing price. If it is below the opening, the trader should expect:
To apply the last point correctly, it is important to understand that the histogram is tied to a single candle. The figure below shows a falling trend (1), but a rising candle (2), corresponding to the green BW MFI histogram, became the start of a long-term upward movement in the EURUSD pair.
This fact did not cancel a similar signal of trend strengthening during the correction at point (3). Several rising green bars in a row confirmed the strength of the positive trend (4 and 5).
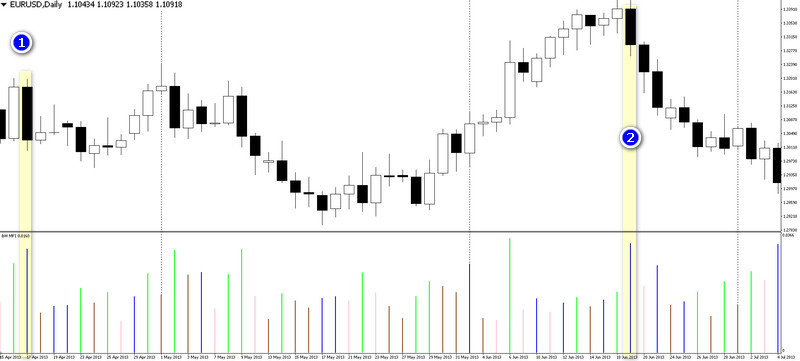
The second most important BW MFI signal is the blue bar, indicating divergence - a trend direction not confirmed by trading volume. Market makers or crowd inertia continue a movement not supported by major players. This means that at any moment a strong speculative pullback may arise in the market, which the current Buyers or Sellers will not be able to resist because of low trading liquidity.
Divergence applies to the current candle: if it is bearish, as in case (1) in the figure below, then an upward bounce should be expected. Sometimes trading volume declines for objective fundamental reasons, without meaning a decline in demand for the currency. In case (2), a strong downtrend coincided with the summer period, when the number of trades and players in the market traditionally declines.
Pink and brown colors also predict fading or a possible trend reversal. Bill Williams singled out the "squatting bar" with a falling trading range amid rising trading turnover. It corresponded to the pink bar as the most likely harbinger of a reversal.
The brown color corresponded to the "fading bar," often called a "stub" in candlestick analysis, whose trading volumes were extremely low.
The size of the histogram bars is very sensitive to volatility - the trading range in the numerator, that is, an increase in the indicator's values points to an increase in the trading range. A decline in BW MFI histograms means that volumes in the market have increased, but the range has returned to "normal" weighted-average values.
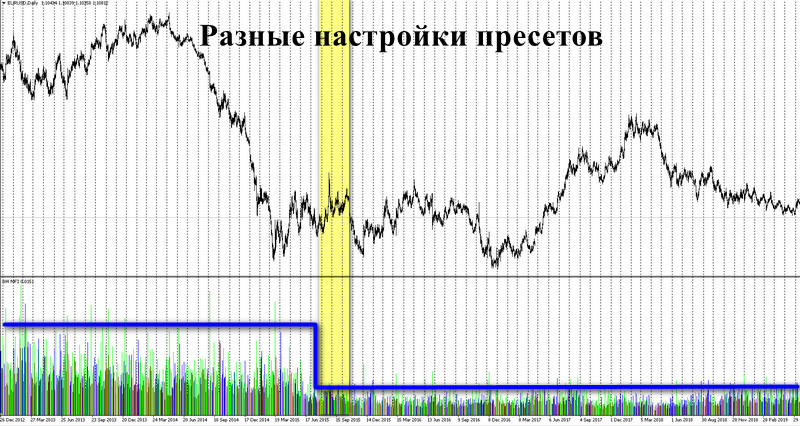
Modern market theory defines the boundary of a change in the volatility regime as a trigger indicating the possible need to optimize the settings of a trading system. A trader should take a closer look at the statement to monitor the number of losing trades if BW MFI has moved to a significantly new level of average readings.
Settings Description

The Market Facilitation Index indicator can be found in the Metatrader trading platform through the Navigator or the "Insert" menu, the "Indicators" option in the "Bill Williams" section.
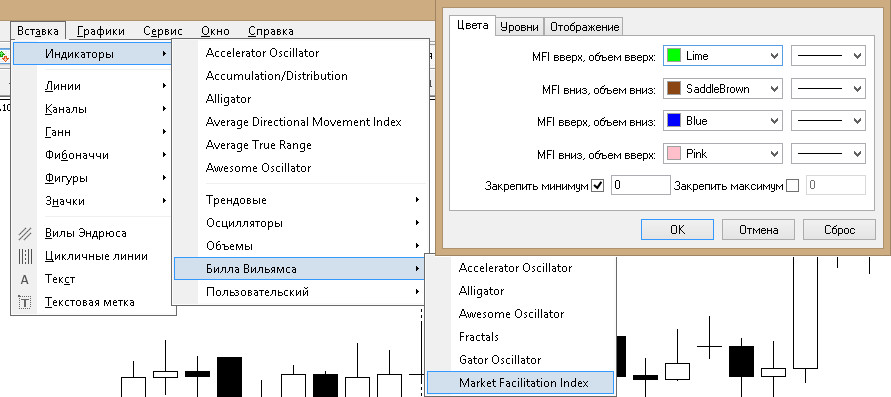
The histogram has no numerical settings, only a color scheme. On the "Levels" tab, the trader can display line values that are convenient for them.
Conclusion

The BW MFI indicator breaks market fluctuations down into 4 components, conveniently marked with different colors. The tool requires no setup, automatically adjusting to the timeframe. Both factors make it easy for beginner traders to use the indicator.
For all the advantages of the tool, it should be taken into account that this is only a signal filter within the candle being studied. The conditions for entry according to the trading system should always come first; BW MFI is the "last resort" that confirms or rejects trades.
Respectfully, Aleksey Vergunov
Tlap.io
