
How to Make Your Strategy Profitable in 10 Minutes
 Hello, trader friends! Today I want to tell you about one secret service that professionals in trading actively use. Something that is not customary to talk about. A tool capable of turning an unprofitable trading system into a strategy that steadily brings profit.
I think no one needs to be convinced how important trading statistics are when working in the financial markets. This has been discussed more than once on the pages of our blog, professional traders constantly tell beginners about it, and you yourself have surely already had time to see this. Many have probably watched A. Gerchik's video lessons, in which he explained the importance of analyzing trading statistics using one very convenient service as an example: MarketStat. It is what will be discussed below.
What kind of service is it?

This service, as you may have already guessed, is intended for detailed analysis of trading statistics for traders who trade manually. It abounds in various filters and statistical data, with which I will acquaint you. It is an online resource where, after registering, you can upload a report from the terminal of your manual trading and begin a detailed analysis of your mistakes.
Registration in the service
You can register at: http://webmarketstat.ru/user/register
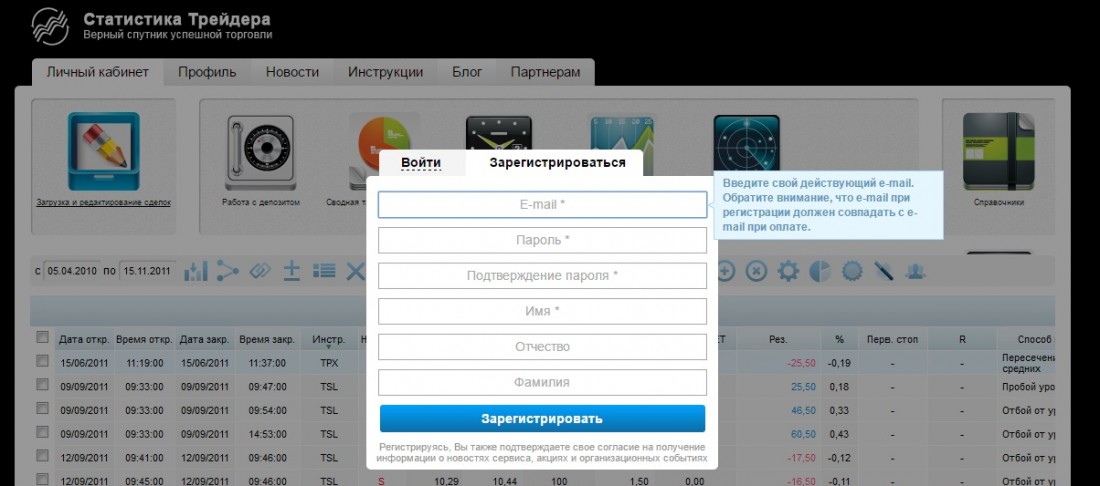
After filling out this simple little form, we proceed to creating an account.
Creating an account
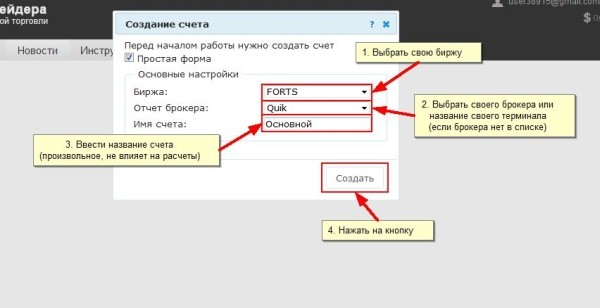
We select the exchange, in our case it is FOREX. In the broker or trading platform field, select broker_meta4.
The account name can be any.
If you want to configure additional parameters right away, uncheck the "Simple form" mark. But these settings can also be made later.
We proceed to the tariff selection page.
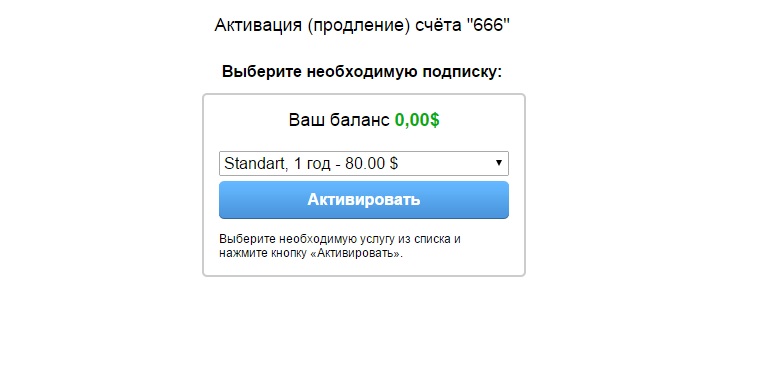 An account is accumulated statistics within one exchange, one broker, and one deposit. Each created account is paid for in the service separately. If you need analysis of several accounts at the same time, each of them will have to be paid for separately. The service gives one user the opportunity to have as many accounts as desired, but each of them must be paid for separately. The service does not offer a trial version, but provides a "moneyback" guarantee if you contact them within 7 days from the moment of payment.
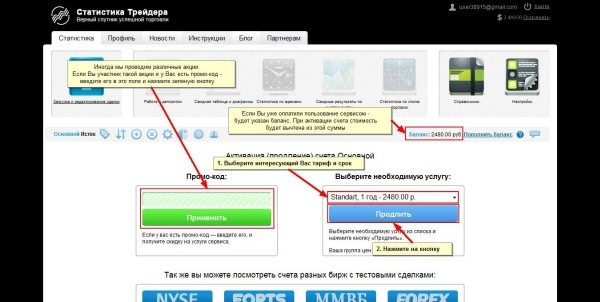
We activate the account.
Uploading data from the terminal
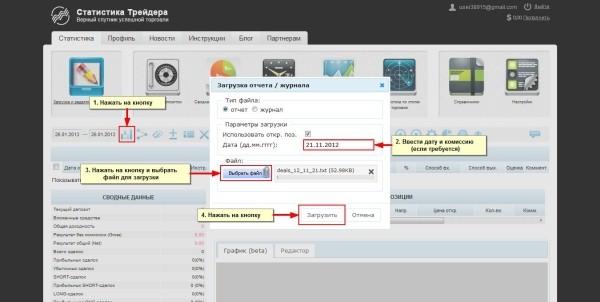
You can upload reports one by one, in chronological order. That is, for example, you started using the service, uploaded the entire report that you have, and then continue uploading data once a week or month.
For how to prepare data for upload, see the video at the beginning of this article.
If the upload was successful, you will see your trades and be able to start working with the service.
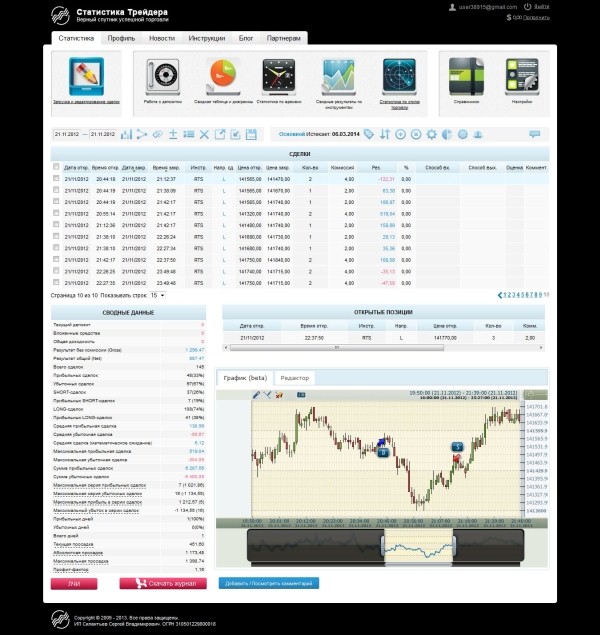
In order for the current deposit and invested funds to be displayed in the summary table, it is necessary to enter deposit changes.
So, to enter the initial deposit, you need to go to the "Deposit Management" page, select the "Deposit Change" tab, and in the input field above the table specify the date and the amount of the deposit credited to the account. To show a withdrawal of funds, the amount is entered with a minus sign.
On the same tab there is a table with the following columns:
- "Deposited" - invested money
- "Changes" - amounts of changes to invested money by dates
- "Deposit" - current deposit taking profit into account
- "Result" - trading result for the day. The amount by which the deposit changes as a result of trading activity
- "Return for the day" - percentage change relative to the previous day
- "Total return" - total percentage return on invested funds for the entire period, taking deposit changes into account
Service Functionality
Account Management Panel

- Account name.
- Expiration date of the paid subscription.
- Extend account - account extension. Payment from the service balance.
- Switch - allows you to choose another account to work with. The button is visible if you have several accounts.
- Create - creation of a new account.
- Delete - deletion of the account. An account can be deleted only if it has not yet been paid for or the account term has expired.
- Edit - editing the account settings.
To change such account properties as the name, exchange, broker, or commission calculation settings, click the "Edit Account" button on the account management panel.
In this form you can change the following settings:
- exchange and broker (when changing the exchange, all uploaded data will disappear)
- the method of commission calculation. By default it is taken from the broker's report.
- the method of compiling trades. Either it is taken exactly from the report, or trades that differ in time by 10 seconds or less are merged.
- the sequence when uploading the report.
- settings for groups of traders.
- Display settings - setting up additional analytics and displaying additional trade attributes.
It is possible to configure some columns in the trades table, for example the ability to show the initial stops of positions, the maximum drawdown and profit in a trade, or the profit-to-risk ratio. It is also possible to add your own additional columns.
Here you can also configure the methods of entering the market and exiting it, as well as the strategies used. For example, you work with several strategies on one account and each of them implies several different entry and exit options. All these points are configured, and later when analyzing trading you can evaluate the effectiveness of each strategy and each method of entry or exit.
- Upload demo data - filling the account with demo data. Possible only if the account does not contain trades.
- Show - creation/deletion/modification of the link for viewing the personal account.
Trades Table
Checkbox for selecting a trade. Selected trades can be assigned additional attributes, merged, or deleted. Checkboxes can be set only within one page.
The following columns come next:
"Open date" - the trade opening date.
"Open time" - the trade opening time.
"Close date" - the trade closing date.
"Close time" - the trade closing time.
"Instr." means the instrument name (stock, currency pair, futures).
"Trade dir." means the direction ("L" for long, "S" for short).
"Open price" means the opening price in account currency.
"Close price" means the closing price in account currency.
"Qty" means the quantity.
"Commission" means commission, trade costs.
"NET adj." means the NET adjustment.
"Result" means the trade result after all costs (Net). It is calculated as follows: NET = Gross - Commission - NET adjustment.
"%" means the trade return percentage (%). It is calculated as: (Net/Deposit on the trade closing date*100%). It works only when the deposit is filled in.
"Initial stop" means the initial stop. An important parameter for calculating the Profit to Risk ratio (R). Before opening a position, it is necessary to determine the price point at which we will close the position at a loss in order to protect capital, the so-called stop-loss.
"R" means the R-multiple. In terms of R-multiples, the basic principle of speculation is this: keep losses at the level of 1 R whenever possible, and allow profits to reach larger R-multiples. It is calculated as follows: R = (Closing Price - Opening Price)/(Opening price - Initial stop).
"Entry method" means the trade entry method, an analytic intended to reflect the way of entering a trade; the methods are configured in the account display settings and assigned to each trade in the editor or by using bulk trade editing.
"Exit method" means the exit method (like "Entry method").
"Strategy" means the strategy (like "Entry method").
"Analytics 1" means custom analytics (similar to "Entry method"), except that the setting name is specified arbitrarily. Type "reference".
"Analytics 2" means custom analytics (similar to "Analytics 1").
"Analytics 3" means custom analytics. Type "number".
"Rating" means rating, an analytic for evaluating your positions, for example on a five-point scale.
For additional analytics there are tables, graphs, and charts on the "Statistics by trading style" tab. The need for additional analytics is configured in the account display settings. Each analytic has fields for filling in within the editor and the possibility of bulk editing.
"Comment" means a comment; for each trade there is an option to create a comment that is displayed below the editor when positioning on the trade.
"Uploaded" means the date and time the trade was created or uploaded. For each trade it is possible to upload up to 4 screenshots, each up to 400 KB in size. Screenshot thumbnails are displayed below the editor when positioning on the trade. By clicking on a screenshot, it opens in full screen.
The open positions table
As the name implies, the open positions table stores trades that are currently unfinished. In the case of loading reports automatically, the "current moment" is the trading state after the last report is loaded, or before the very first one is loaded.
Unfinished trades from the table do not participate in statistics and are needed only to reflect the current trading state and to close trades correctly when the next report is loaded.
For correct calculations, before loading the very first report it is necessary to carefully fill in manually, using the editor, the open positions that were opened before the reporting period. Later, if the chronology of report uploads is observed, the open positions table will be kept up to date automatically.
Trade Editor
The trade editor is used to manage trades manually.
Using the editor, you can enter new trades, edit existing ones, fill in the main and additional attributes of a trade, and open and close a position.
Also, when you position yourself in the "Trades" table on a row, the editor displays additional information about the trade, such as the instrument name, sector, industry, day of the week, time range, time in trade, and the presence of screenshots and a comment.
To add a new trade, click the "add trade" button. The editor fields will then become available, where you need to enter all the required details. After that, click the "Save" button. The editor will check that the fields are sufficiently and correctly filled in and will add the trade to the trades table. The trade will be added to the end of the trades table, regardless of the date and sorting set in the table. After refreshing or switching pages in the table, the trade will "take its place."
To edit an existing trade, position yourself in the trades table on the required trade and click the "Edit" button in the editor. The fields in the editor, with the attributes filled in, will open for editing. After editing the trade, click "Save" or "Cancel" if you decide not to continue editing.
To add an open position, click "Add unfinished trade", fill in the available fields, and click the "Save" button. The trade will be added to the "Open positions" table.
To close an open position, position yourself on the required open position and click the "Close trade" button in the editor. The attributes for closing the trade will then become available, which you need to fill in and click the "Save" button. Upon saving, the now closed trade will be removed from the "Open positions" table and written to the "Trades" table.
Open positions can also be edited and deleted using the editor.
It is also possible to add comments and screenshots to trades.
Working with Filters
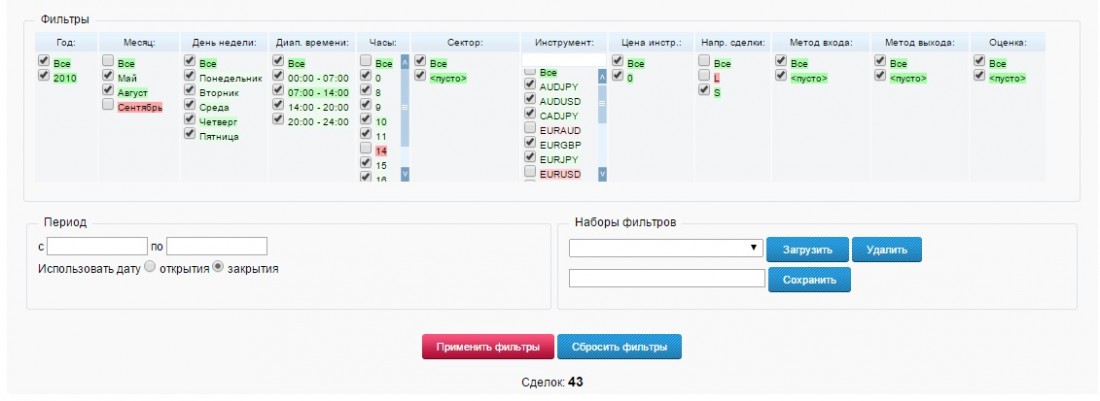
Filters are a powerful tool for statistical analysis.
Filters are applied to ALL data and are used for ALL tables and charts. Thus, with the help of filters, you can analyze any analytical slice or several within the entire trading activity. Using various filters, you can reveal any hidden strengths or weaknesses of the trading.
Then you can check whether this was always the case by setting filters by month.
Next, you can test this entry method in relation to other currency pairs and on other days, analyze charts, look at successful formations for specific trades, and draw conclusions.
This is only a particular example of reasoning, but none of this would have been possible to see without using filters.
Be sure to use filters.
Summary Table and Charts

Summary data
A general summary of various statistical account data: profitability, the number of profitable and losing trades, everything that the terminal produces when saving a detailed report.
Income chart by days/weeks/months
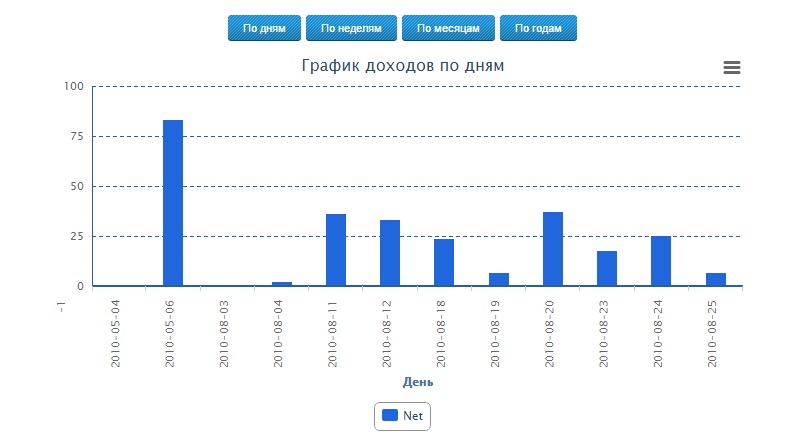
The "Income chart" diagram in each bar reflects the aggregate result of all trades for the period, in absolute terms, set by the buttons in the upper part of the chart (days, weeks, months, years). The blue part of the bar is the net result without commission, the light blue part is the commission.
Net - Gross
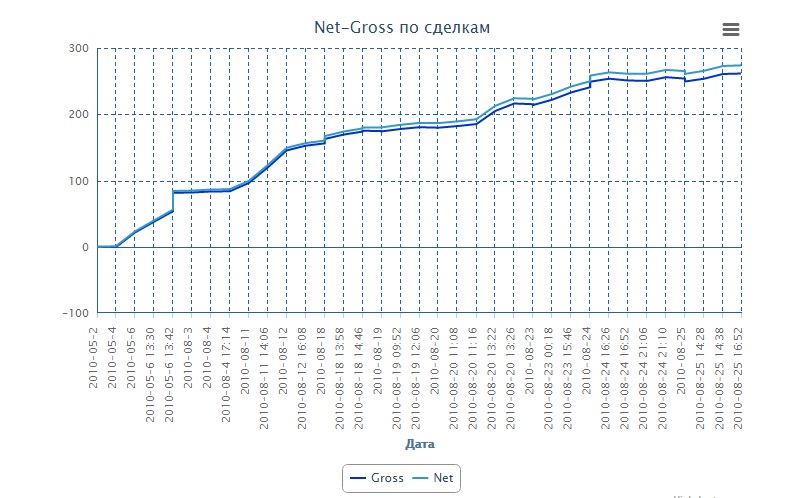
The "Net-Gross" chart shows trading results on a cumulative basis.
Net is the net result with commission taken into account.
Gross is the result without exchange and broker commission. It is useful for analyzing the success of trading relative to other market participants. If the result is positive, regardless of NET, the trading strategy is successful, we are taking money from the market, outperforming other participants, and it makes sense to pay attention to improving the strategy and optimizing commission.
Chart of result dependence on volume
Each point on the chart of result dependence on volume shows the absolute result, where on the X axis is the volume traded during the day. It is assumed that with a sufficient set of statistical data, clusters of points may form that will show the optimal, effective, convenient trading volume per day.
This chart is most useful for American markets, since all stocks have the same lot size of 100 shares.
For other markets, it makes sense to use this chart only when filtered by a single instrument.
Chart of result dependence on the number of trades
Each point on the chart of result dependence on quantity shows the absolute result, where on the X axis is the number of trades per day. It is assumed that with a sufficient set of statistical data, clusters of points may form that will show the most comfortable number of trades per day.
OHLCV chart
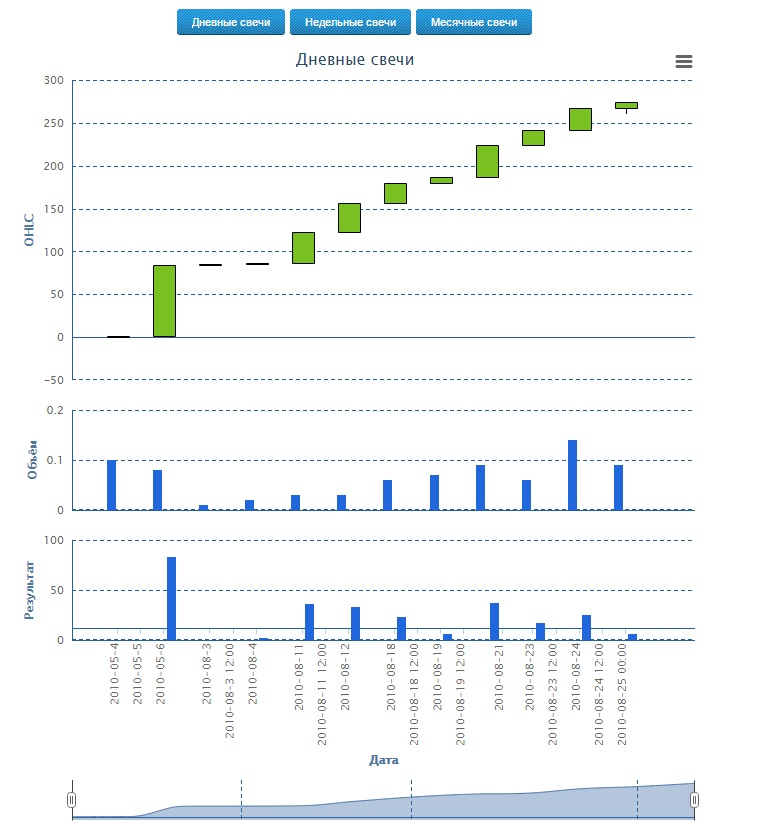
The change in results as a cumulative total reflected with the help of an exchange chart, where
- Open - result at the beginning of the day
- Hi - best result of the day
- Low - worst result of the day
- Close - result at the end of the day
- Volume - number of completed trades
By analyzing this chart, you can see how you recover losses or, on the contrary, lose accumulated profit, the trends of successful streaks, and the internal structure of the day. Comparing it with the market situation, your internal state, and other analytics, you can see visual patterns present in your trading.
The chart can be scaled using the buttons at the bottom of the window.
Normal distribution
The value of "Mathematical expectation" will show us how profitable the strategy used by the trader is. In turn, the spread of the distribution will show how high the risk is in the trader's trading strategy. Even with a positive mathematical expectation, a high standard deviation value will mean that the risk is too high.
Summary table
The summary table shows overall results grouped by day. This table gives a general picture of how trading results change over a certain period of time.
Time-based statistics

Dependence of the result on the day of the week
The chart displays results for all time grouped by day of the week.
The green part of the bar shows how much was earned by all profitable trades on this day of the week, the red part of the bar by losing ones. The difference will show the overall result. The overall result is reflected in the table below. As a rule, over a long period of time it turns out that some days of the week are significantly better or worse than the others, which indicates the need to study the reasons or even exclude these days from trading.
Dependence of the result on the entry time range
The chart shows all-time results grouped by entry time range.
The green part of the bar shows how much was earned by all profitable trades in this time range, the red part of the bar by losing ones. The difference will show the overall result. The overall result is reflected in the table below.
Time ranges divide the trading day into several logical periods. For Forex these are the sessions of different countries: Asian, European, American.
Dependence of the result on the entry time range and day of the week
The chart shows all-time results grouped by days of the week and entry time ranges. It is a general representation of the two previous charts.
Dependence of the result on the entry time
The chart shows all-time results grouped by hours.
The green part of the bar shows how much was earned by all profitable trades whose exit time fell on this hour, the red part of the bar by losing ones. The difference will show the overall result. The overall result is reflected in the table below.
You can see both trading activity and the most favorable time for trading.
Dependence of the result on time in the trade
The chart shows all-time results grouped by time in the trade
The green part of the bar shows how much was earned by all profitable trades having such a duration in minutes, the red part of the bar by losing ones. The difference will show the overall result. The overall result is reflected in the table below.
You can see what trade duration is the most optimal. Based on the conclusions, you can configure the most convenient timeframe for display.
Summary Results by Instruments

In this section you will find statistics on the instruments used in trading.
Top 10 instruments shows the most popular instruments.
The results chart by instruments shows which instruments are the most effective to use.
The pie chart of the number of trades by instruments clearly shows how much you trade each instrument. When you hover over a chart sector, its name and the number of trades will appear.
The dynamics of results by instruments will show the results for each pair in the form of charts.
The summary table whose values are used for the charts is ordered by result from the best instruments to the worst.
Statistics by Trading Style

If you filled in the entry types, exit types, and strategies used for each trade, in this section you can study the statistics for these items.
Dependence of the result on the method of entering a position
Distribution of trade results for each of the entry methods. The bars in the chart are ordered from the worst overall result to the best.
The pie chart shows the number of trades for each of the entry options as a percentage of the whole.
When you hover, the name, percentage, and number of trades pop up. The other three sections are approximately the same as this one.
Money management.
In this section you can look at the profitability chart of the trading system when applying various approaches to money management: optimal f, martingale and anti-martingale, fixed percentage, and fixed ratio. I did not like how this section was made. The point is that only one currency pair can participate in the analysis at the same time, not the whole account.
Conclusion

Overall, MarketStat is quite an interesting and certainly useful service that will help improve trading results for traders who trade manually. The service contains a lot of useful statistical data unavailable in free analogues. Despite some shortcomings, such as not the most convenient statistics upload and some limitations in the analysis of money management methods, the advantages still clearly outweigh them.
P.S. work with the service is shown in more detail and more clearly in the video lesson at the beginning of this article.
Trial Free Plan
Respectfully, Dmitry aka Silentspec
TradeLikeaPro.ru