
Main Technical Analysis Patterns in Forex
 Exchange trading and, in particular, forex trading, attracts many beginner investors and speculators. Not everyone understands that to earn a stable and high income, you need, at a minimum, a clear trading plan and strategy. Moreover, automated trading systems and arrow indicators, while easy to master, do not always provide profitable signals. As a result, a beginner who trusts aggressive advertising and does not want to understand the intricacies of analysis on their own may end up in the red or even lose their deposit completely.
Graphical analysis is one of the oldest and still relevant types of analysis. The market is constantly changing, trading algorithms lose relevance, but the basic principles of price behavior remain unchanged. To draw the right conclusions when analyzing charts, you need to be able to correctly identify the main technical analysis patterns. They do not always have the ideal shape shown in templates, but by following the rules and gaining experience, even a novice trader can quickly learn to spot them in the chaos of price movement. In today's material, we will cover all the main technical analysis patterns in Forex.
Temporary losses and drawdowns are an integral part of the work of almost any trader, even an experienced one. However, the ability to move from loss to profit comes through studying the market and methods of analysis. One of the main types of analysis is technical analysis, based on identifying the most popular patterns and figures on the price chart. Analysis of the market based on figures is also called graphical analysis, since technical analysis itself also includes trading from levels, by indicators, and so on.
Main Technical Analysis Patterns

A detailed study of graphical patterns has revealed more than two hundred different figures and patterns. However, most of them are either too rare or too controversial and structurally complex to be used as a primary signal for opening trades. We will look at those patterns that are considered the most effective in terms of signal performance and are often found on Forex charts.
Technical analysis patterns are divided into two categories: reversal patterns and trend continuation patterns. Sometimes "uncertainty patterns" are singled out as a separate type, but they are useless as a source of signals, so there is no point in focusing on them.
Head and Shoulders

The "Head and Shoulders" pattern belongs to the reversal category. This pattern forms at the top of an uptrend. If you see it on the chart, you should expect a downward trend reversal with a fairly high probability (about 70%, according to averaged statistics from many studies).
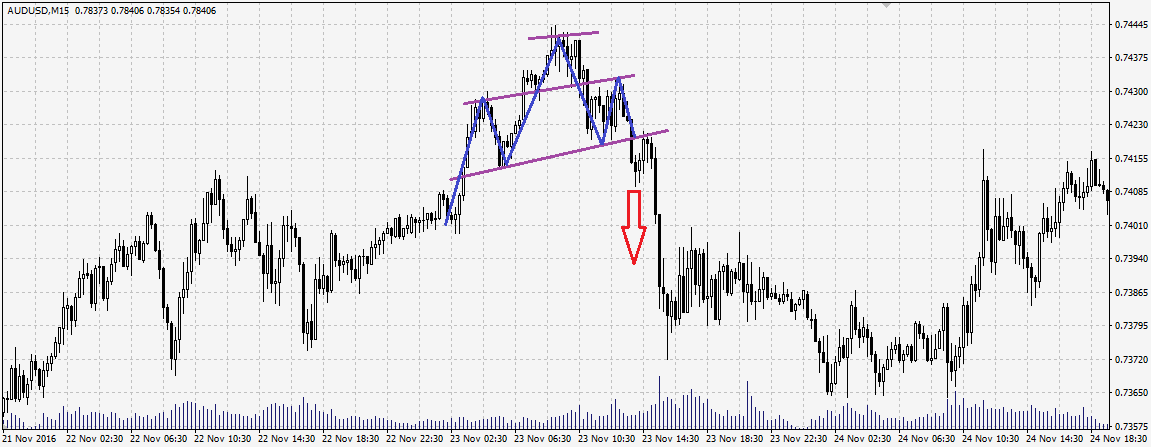
The pattern consists of three highs: the two outer ones are approximately the same height, while the middle one is the highest (two shoulders and a head). After the first high (shoulder) and the second (head) are formed, the price pulls back downward, forming a "neckline." This line becomes a reference point and support; once it is formed, you can conclude that the pattern has taken shape and expect a pullback downward.
The optimal way to trade the "Head and Shoulders" pattern is with pending orders. You need to wait until the pattern forms and place a Sell Stop order several points below the neckline, depending on the timeframe and the asset's volatility. Stop loss is set 10-15 points above the neckline (in case the breakout turns out to be false). Take profit can be set below the neckline at a distance equal to three times the height of the last shoulder (this is not a strict rule, just one possible option).
In addition to the standard "Head and Shoulders" pattern, there is also an "Inverted Head and Shoulders" pattern, which forms in a downtrend and is the mirror image of the standard one. It consists of three troughs: the two outer ones are approximately equal, while the middle one is the lowest. The trading rules are identical, except that you need to open a buy trade.
Double Top and Double Bottom

The "Double Top and Double Bottom" patterns are mechanically very similar to the "Head and Shoulders" and "Inverted Head and Shoulders" patterns. The only difference is that this pattern has two highs instead of three, and they should be approximately the same size.
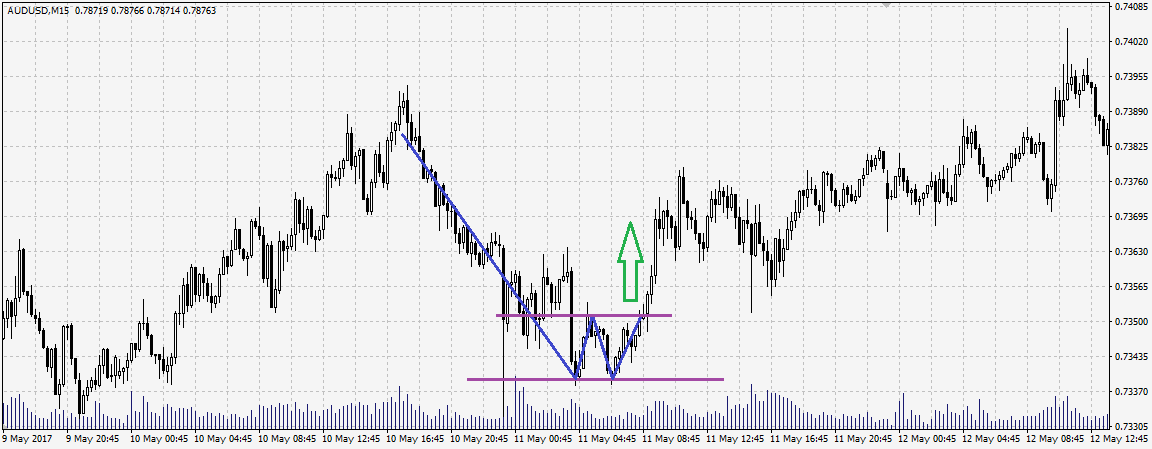
For example, the "Double Bottom" pattern forms after a downtrend, when the price reaches the lowest point, bounces upward, and then, with a final selling impulse, reaches the very bottom once again and bounces back. At the point of the first bounce, a resistance level is formed, similar to the neckline in the "Head and Shoulders" pattern. After the price reaches the bottom for the second time at the same point as the first time, the pattern is considered formed, and you can expect a breakout of the resistance line and an upward trend reversal.
The classic trading option in this situation is to place a Buy Stop pending order several points above the resistance line. The stop loss is set 10-15 points below this line (sometimes the stop can be placed several points below the bottom line, if money management allows it). Take profit can be set at a distance three times greater than the height of the pattern.
Just like the "Head and Shoulders" pattern, the "Double Bottom" has a mirror image pattern, the "Double Top." The rules for identifying and trading it mirror those of the "Double Bottom" and are almost identical to trading the "Head and Shoulders" pattern.
These paired patterns are the main reversal patterns in Forex and other financial markets.
Saucer
This pattern is one of the simplest, and even beginner traders will have little difficulty identifying it on the chart. It is characterized by a smooth change in price from a downward trend to an upward one, and vice versa in the case of an "Inverted Saucer."
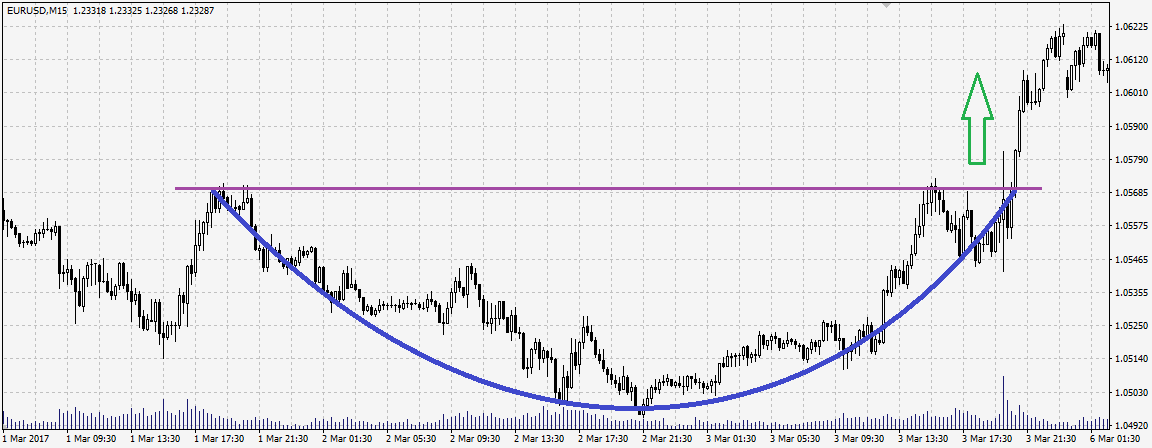
A classic saucer is a semi-ellipse in which the candles become shorter and shorter as they approach the lowest point, and the trend slows down. After overcoming the very bottom, gradually accelerating growth begins.
There are two main ways to trade the "Saucer": conservative and aggressive. The conservative approach prescribes waiting for the saucer to finish forming, when the upward trend reaches the point where the formation of the pattern had previously begun, and only then entering the market. However, the starting point may be indistinct, and in that case it is difficult to determine when the pattern has fully formed. The aggressive approach involves entering at market when the "bottom" point of the Saucer is clearly defined and the market turns upward. In this case, placing a short stop loss is mandatory.
The "Saucer" is a fairly rare pattern. Moreover, despite its simple shape, only a few traders manage to identify it at an early stage. Like most patterns, the Saucer can be regular or inverted; the second form is a mirror image, and the trading rules for it are the same, adjusted for the opposite trend direction, of course.
Flag and Pennant

Flag and pennant (as well as their inverted forms) are trend continuation patterns. Both patterns consist of two parts: the "pole" (one or several long candles) and the "flag" (many small candles forming a dense row).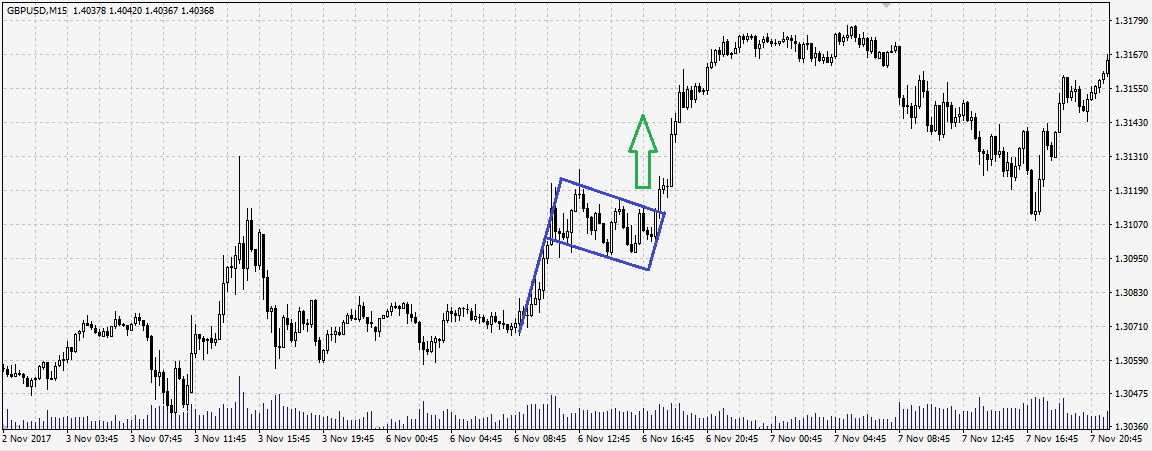
The difference between a flag and a pennant is that the flag has a rectangular "cloth," while the pennant's is triangular and gradually narrows.
After the pole of a flag or pennant is formed, the price begins to fluctuate in a flat, the boundaries of which are usually directed slightly against the trend (tilted slightly downward in a prevailing uptrend and upward in a downtrend). After both lines of the cloth, upper and lower, are formed, a breakout can be expected.
It is better to trade these patterns using pending orders.
For example, for an upward flag, as in the screenshot above, the optimal option would be to place a Buy Stop order several points above the resistance line (gradually lowering the order line as the cloth grows). The stop loss is set either below the lower edge of the cloth or 10-15 points away from the trade entry price. Take profit is equal to the height of the cloth multiplied by 3, or any other value within the current money management strategy.
Trading inverted pennants and flags follows the same principle, except that the trades are opened for selling.
Triangle

A triangle is neither a reversal pattern nor a trend continuation pattern. Nevertheless, this pattern gives a clear signal to enter the market. Its peculiarity is that the direction in which the trade should be opened, buy or sell, becomes clear only when the signal itself is received.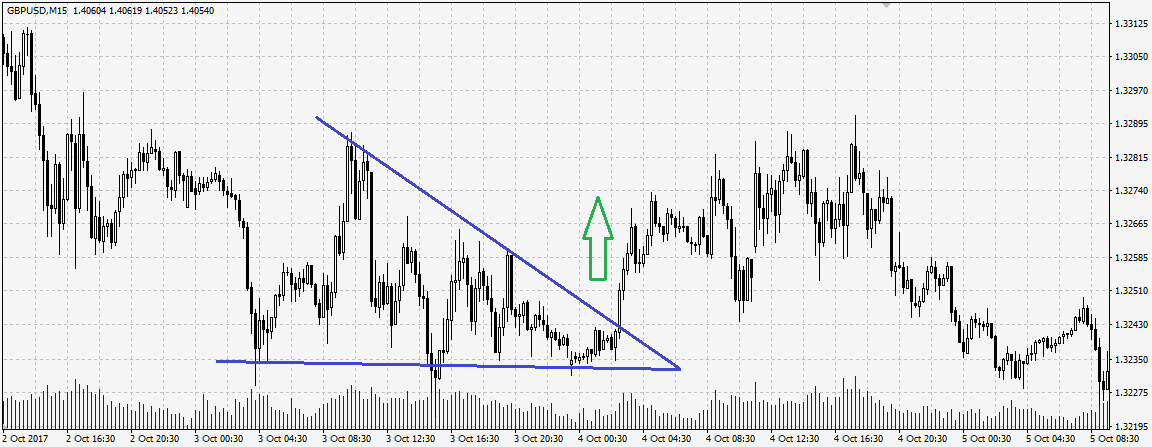
A triangle is formed when a trend weakens and the price, having entered a flat, gradually narrows its fluctuation range. The two main lines of the triangle are drawn along the extreme points of the candles and converge at one point. The signal to open a trade is the breakout of one of these lines. The advantage of a triangle is that once it forms, it will definitely give a signal, since sooner or later the price will leave the narrowing range. The drawback is that the breakout may turn out to be false more often than signals from other major patterns do, in about 40% of cases.
The optimal way to trade it is to place pending breakout orders at the levels of the triangle's support and resistance lines, in both directions, several points below support and above resistance. The stop loss is placed either tightly, at the same distance from the line as the order but in the opposite direction, or more loosely, at the level of the order for a trade in the opposite direction.
Sometimes a triangle can be mistaken for a pennant. If a line of one or more long candles formed before the triangle, this figure should be traded as a pennant, that is, signals should be taken only for trend continuation.
General Recommendations for Trading Technical Analysis Patterns

We have considered only those patterns that are regarded as the most canonical and reliable, and whose signals most often bring profit in trades. Nevertheless, there are other patterns as well: diamond, butterfly, expanding figure, and so on. However, they are more "exotic"; as a rule, they are harder to identify on the chart, and trades based on them are less often closed in profit.
At the moment, very few traders trade solely by technical analysis patterns, and even fewer earn stable profits from such trading. You need to know the patterns and be able to recognize them, but trading is much more effective if you also use other technical analysis tools: support and resistance levels, price channels, and sometimes various indicators. Technical analysis patterns should be taken into account when opening trades based on signals from your strategy built on other tools. If the trading system signal coincides with the pattern signal, it is highly likely to bring profit; if they contradict each other, it is better to refrain from trading.
It is also better to refrain from trading based on technical analysis during the release of important economic news or other events affecting the market. Technical analysis evaluates the market through the behavior of the crowd reflected on the chart. During important events, participants act as sharply and unpredictably as possible; accordingly, price movement also becomes unpredictable, and patterns do not work at such a moment. When the period of panic passes and the market calms down, you can start systematic trading again.
Best regards, Alexey Vergunov TradeLikeaPro.ru
