
MACD Indicator: Everything You Wanted to Know About the Classic Tool

Hello, fellow forex traders.
Let's face the truth - many of us are looking for "that very grail." Every time we download one indicator or another strategy, a small but real hope glimmers in us: "what if?" If you recall Coelho's "The Alchemist," wealth is often worth seeking right under your nose. In our case, right in the trading terminal.
Today we will talk about the classic MACD indicator: break down how it works, identify the main application tactics, including little-known ones, and try to understand the secret of this tool's longevity (after all, it is almost 40 years old).
Everyone knows that some indicators are trend indicators, intended, in fact, for working in a trend, while others are oscillators, which work best in a flat market. The indicator we will talk about today is the MACD trend oscillator. Its full name is the Moving Average Convergence/Divergence Trading Method, it is pronounced as "M A C D," and it has nothing in common with McDonald's.
Indicator Characteristics
Platform: any
Currency pairs: Any
Timeframe: any, preferably above H1
Trading time: around the clock
Indicator type: classic trend oscillator
Recommended brokers: Alpari, Exness, Instaforex
History of Origin

The MACD indicator shows us exactly what its name says - to what extent the moving averages on the chart have converged or diverged. This indicator was developed by the well-known New York trader Gerald Appel in 1979 for stock market analysis, and then, as often happens, migrated to other financial markets, including Forex. The main reason for the MACD indicator's popularity is that it really provides a lot of useful information about the market, while combining the properties of both a trend indicator and an oscillator. The creator of the indicator, Gerald Appel, is also the author of several books, such as "Winning Marker System: 83 ways to beat the market," "Stock market trading systems," "New directions in technical analysis," and others, and he also published his own newsletter, "Systems and Forecasts."
Calculation of the MACD Indicator

The MACD indicator uses as many as three moving averages in its calculations, although on the chart we see only two - the value of the long moving average is subtracted from the value of the shorter one, and then the difference is smoothed once again. Why so much smoothing? Why smooth anything at all? The answer is obvious - just look at price charts. Sometimes you can't see the forest for the trees, and especially when prices are jerky because of a large amount of news, it is difficult to trace the true trend, to understand where the price is really moving. Smoothing removes all these jerks and deceptive maneuvers, leaving only the general direction of prices. And the price paid for smoothing is lagging signals. In trend trading this is even good - all false moves and noise are filtered out, but in scalping, of course, it is unacceptable - by the time you are ready to enter, it will be time to exit. So, when constructing the MACD indicator, double smoothing is used, which guarantees that if MACD has turned downward, the trend is really changing.
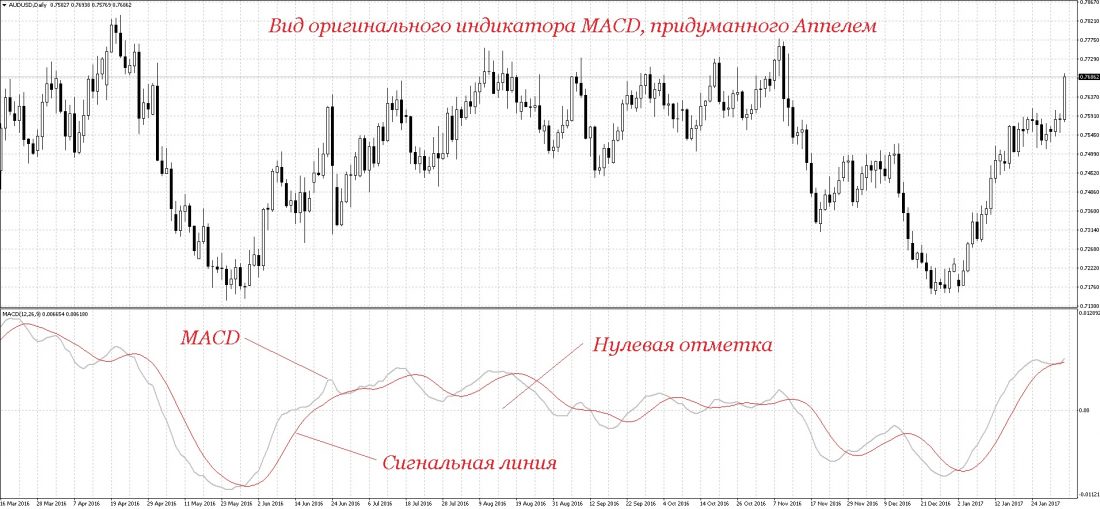
The MACD indicator is drawn in the terminal's "basement," like all oscillators. The original indicator proposed by the author looked like two moving averages whose crossover gave signals to act:
Later, one of the lines began to be displayed as a histogram (little bars or columns fluctuating around the zero line). It is this modern form of the MACD indicator that you see in the terminal:
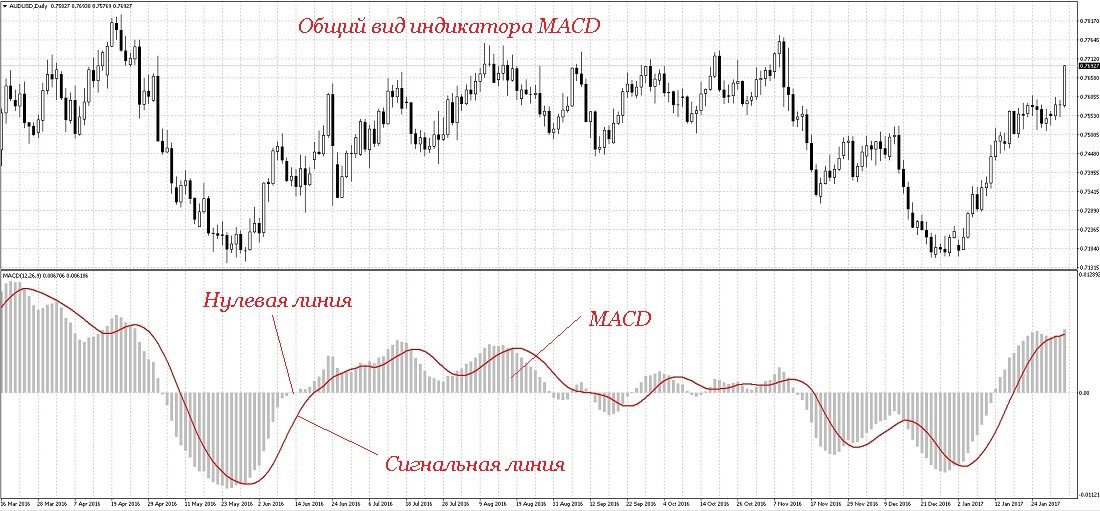
So, MACD simply calculates the difference between the fast and slow moving averages. When MACD is above zero, it indicates that the fast moving average is above the slow one. When it is below zero, the fast one is below the slow one. Accordingly, a rising MACD indicates a growing bullish trend, while a falling one indicates a bearish trend.
Now let's look at the MACD calculation formula. First of all, we need to prepare two exponential moving averages - a long one and a short one - and then find their difference:
MACD=EMA(CLOSE,PL)-EMA(CLOSE,PS), where
EMA - exponential moving average;
PL and PS - the long and short periods of the exponential moving average;
This is exactly the line that, in the modern version of the MACD indicator, you see as a histogram. It is called the fast MACD line, dating back to the time when it was still a line.
The next step is to calculate the signal line as a simple moving average of the difference between the two exponential moving averages calculated above:
Signal=SMA(MACD,Pa), where
SMA - simple moving average;
Pa - the period of the indicator's signal line.
And there you have the very red line on the chart. It is called the slow MACD line, or the signal line.
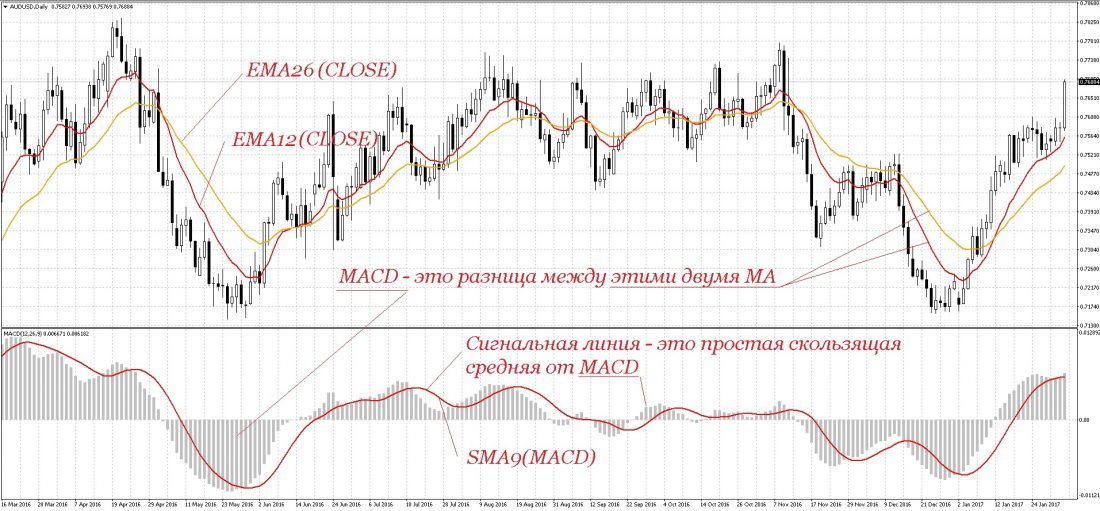
The so-called MACD histogram is also often mentioned. This is not the same thing as the MACD indicator itself described above. The histogram is the difference between the MACD value and the signal line, that is:
MACDHistogram = MACD - Signal:
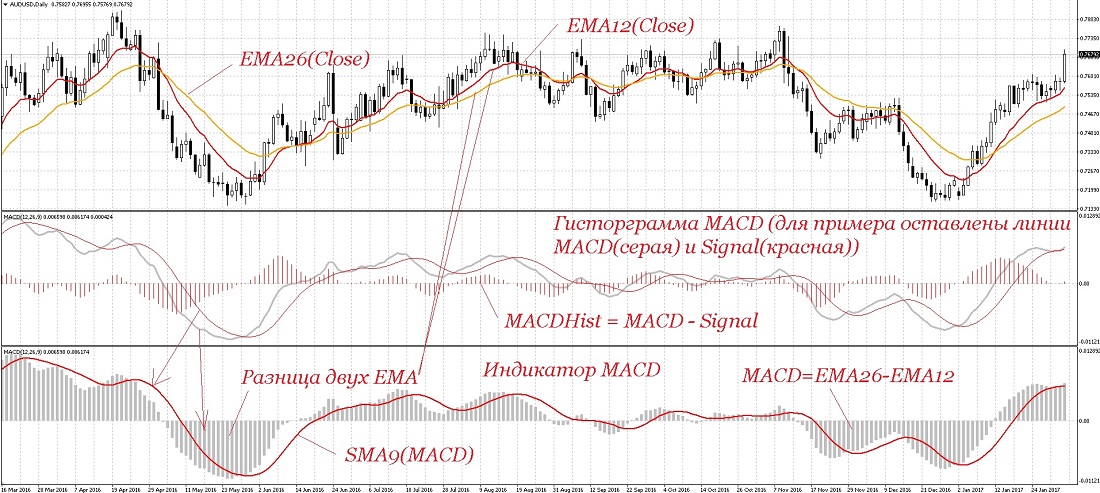
I have not come across the use of the MACD histogram itself for a long time, and you will not find it in the terminal either. But if you happen to encounter the MACD histogram somewhere in technical analysis literature, you will no longer confuse it with the MACD indicator.
Settings
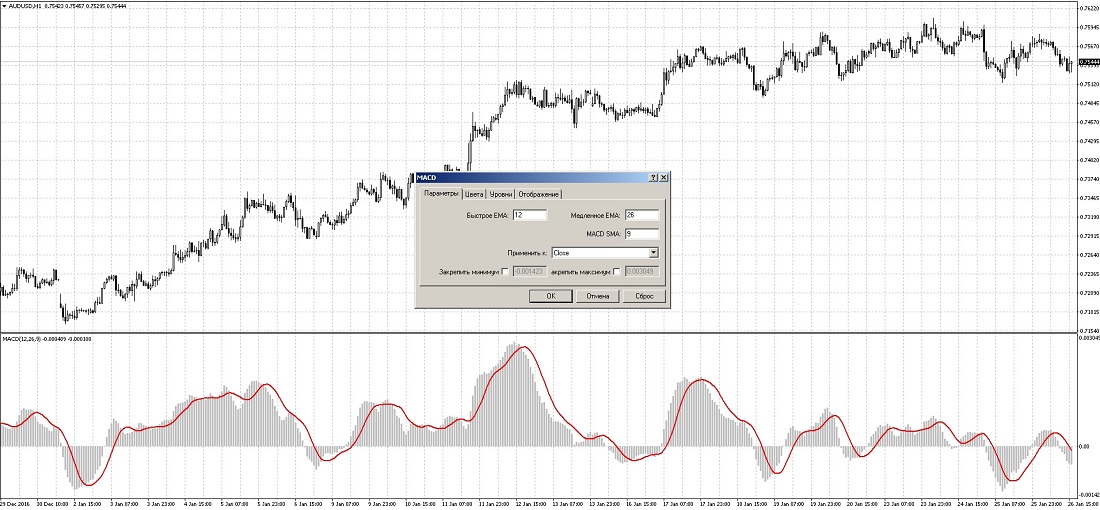
The indicator has four parameters: the period of the slow moving average, the period of the fast moving average, the period of the signal moving average, and the price used for calculation.
As a rule, the periods used are 12, 26, and 9, and the price for calculations is the candle close. These are exactly the periods (12 and 26) that Appel himself recommended for those looking to sell. For buyers, the author recommended using 8 and 17. But this concerned the stock market, and for other markets you can safely use the standard periods or choose your own.
How to Use It

The MACD indicator is most effective in markets with a wide range of fluctuations. Ideal trading with the indicator comes when there is a clear trend. At the same time, in a narrow range it will generate far fewer false signals than other trend indicators.
Crossovers
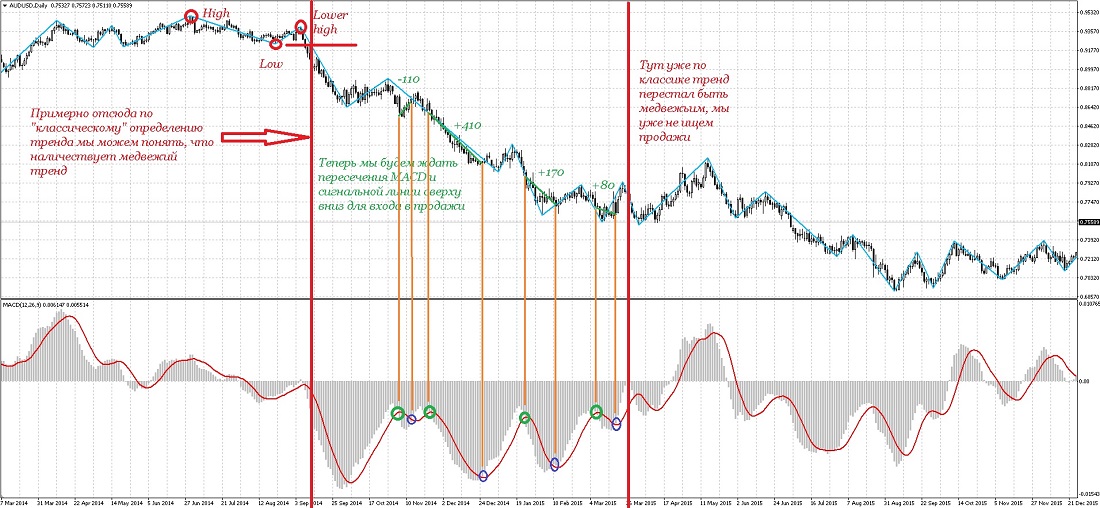
A moving average, as I already said, smooths out the impact of random price fluctuations. The difference between two moving averages smooths price even more strongly. As a result, this leads to the fact that MACD generates fewer false signals, but at the same time lags quite a bit. Nevertheless, MACD behaves much better in a narrow range than a simple crossover of two moving averages.
When using this type of signal, buy trades are taken when the MACD histogram crosses the signal line from bottom to top. For sells, everything is the opposite. This type of signal is taken when there is a good trend. For example, in a bearish trend, traders enter sells when the MACD indicator crosses the signal line from top to bottom, and the exit from the trade is carried out at the reverse crossover. That is, entry into a trade often occurs right at the end of a pullback against the trend, and the exit comes when there are signs of its beginning. The picture above shows an example of trading on the crossover of MACD and the signal line. The trend is determined by the classical rules - we have a local maximum and a local minimum. When a new local maximum appeared below the previous one, an opportunity for a trend change appeared. When the level of the previous minimum was broken, it was possible to assume the emergence of a new bearish trend and begin waiting for sell signals from the MACD indicator. Before the high-low order was broken (the new high eventually turned out higher than the previous one, which signals a possible change or end of the trend), we made 4 trades, three of which ended with a decent profit and one with a small loss.
Oscillator
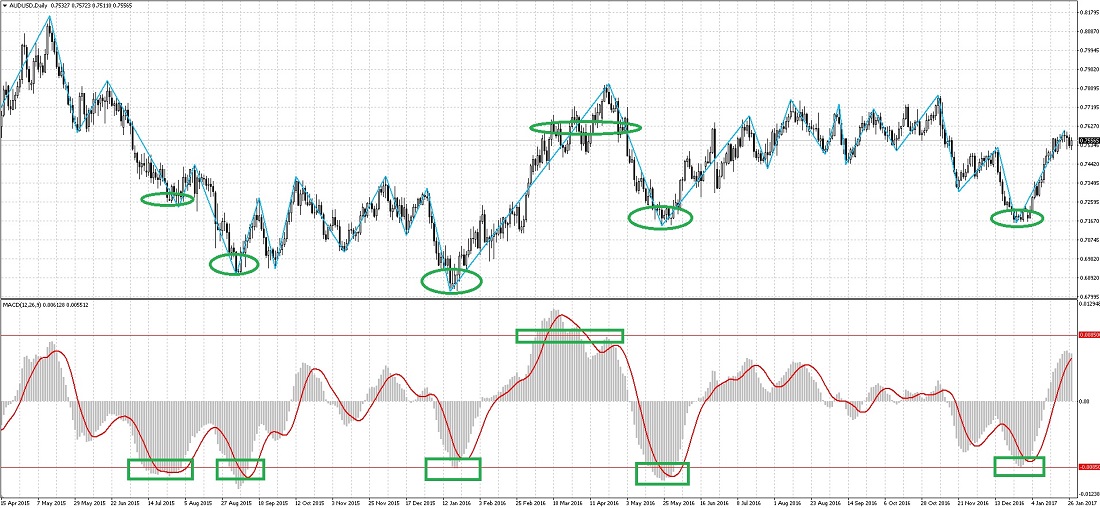
So what is the logic of this indicator? MACD is the difference between two moving averages, a fast one and a slow one. The fast moving average characterizes the short-term tendency, and the slow one the longer-term tendency. The greater the divergence between these moving averages (the farther above or below zero the MACD histogram is), the more bullish or bearish the market is. There is such a concept as reversion to the mean. So, price fluctuations always return to their average price. In the case of the MACD indicator, price fluctuations (slightly smoothed) are represented by the fast moving average, while the average price itself is the slow one. Accordingly, the fast average always returns to the slow one, and the difference between these moving averages always returns to zero. At the same time, the farther the averages diverge, the higher the histogram rises or the lower it falls, the greater the probability that convergence is about to begin, that is, the movement of the histogram will reverse toward zero.
Therefore, the next type of signal from this indicator is the appearance of maxima and minima, which are used in the same way as with other oscillators. The only point is that MACD does not have predetermined overbought and oversold levels. The analysis is performed visually. In the picture above, I visually determined the 0.0085 level and placed it on the chart. As you can see, crossing the overbought/oversold level in the opposite direction often serves as a reversal point for price, or at least as the beginning of a correction. This does not always work with great precision, as, for example, when working with the upper level in the picture, but nevertheless this signal is much more reliable than that of many other oscillators. And in combination with levels, or when trading with the trend, the accuracy increases many times over.
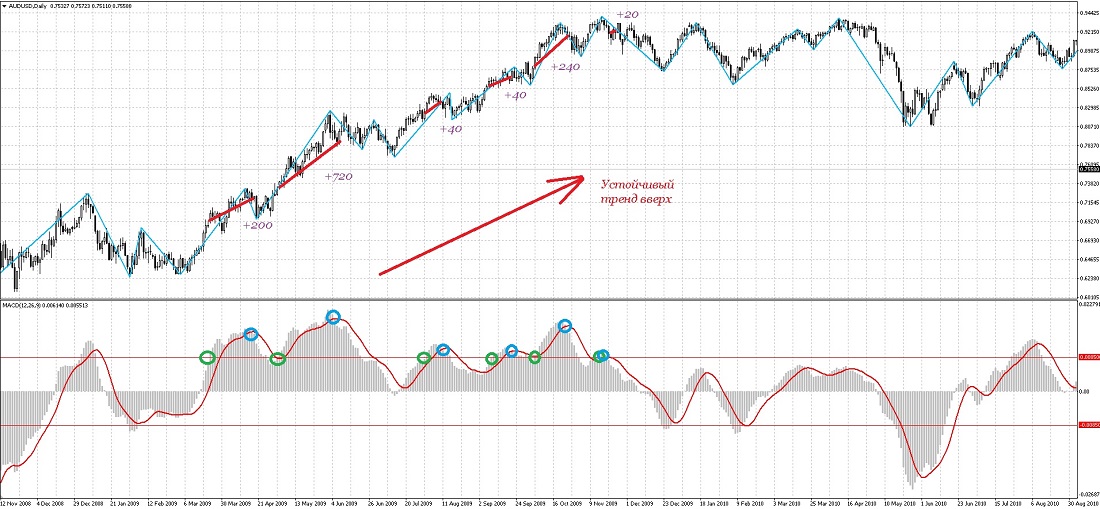
By the way, when there is a trend, you can use the following trick based on the lag of slow oscillators. I already talked about it in the article about the Stochastic Oscillator. The point is that after breaking the overbought/oversold level in the case of a trending move, price can continue moving in the same direction for a long time, while the oscillator keeps hanging beyond the levels. In the picture above, a good uptrend is clearly visible. Entry into a buy trade is carried out when the MACD indicator breaks a certain level, and the exit from the trade is made when the indicator simply crosses its signal line. The use of pending orders will make entries even more precise. The idea here is that by raising the level above the zero line, we simply filter out insignificant price spikes. Only truly strong moves break our level, and those are the ones we take.
Position Relative to the Zero Line
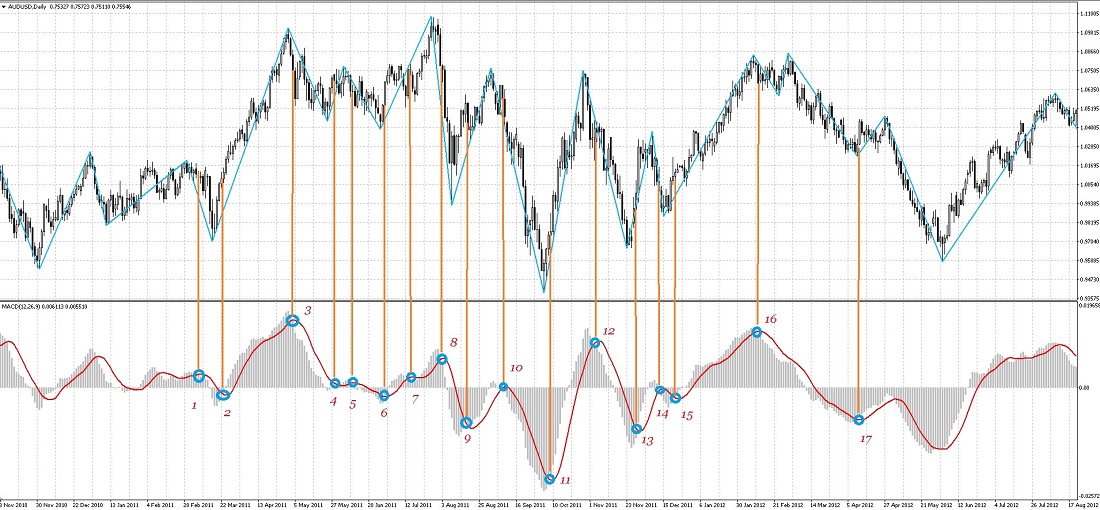
When there is a directional trend, it works very well to enter in its direction right at the peaks and troughs. But what if the direction of the trend is unclear, while the moves are very volatile and take place in a wide range? You just need to take into account the position of the indicator relative to the zero line. In the picture above, sell signals are taken when MACD and the signal line cross above the zero level, and buy signals are taken below it. That is, in essence, we combined the two approaches listed above - using MACD as an oscillator and using crossovers. If you take all signals in a row according to these rules, as in the picture above, then on such wide ranges you can earn a decent number of points. In the first trade, there were sells; in the second, the sells were closed and, since we found ourselves below the zero line, buys were opened. At the third point, the buys were closed and sells were opened again. Moreover, such uncomplicated trading would have brought us 16 trades, two of which would have closed roughly at breakeven, while the rest would have produced a profit of around 4500 old points.
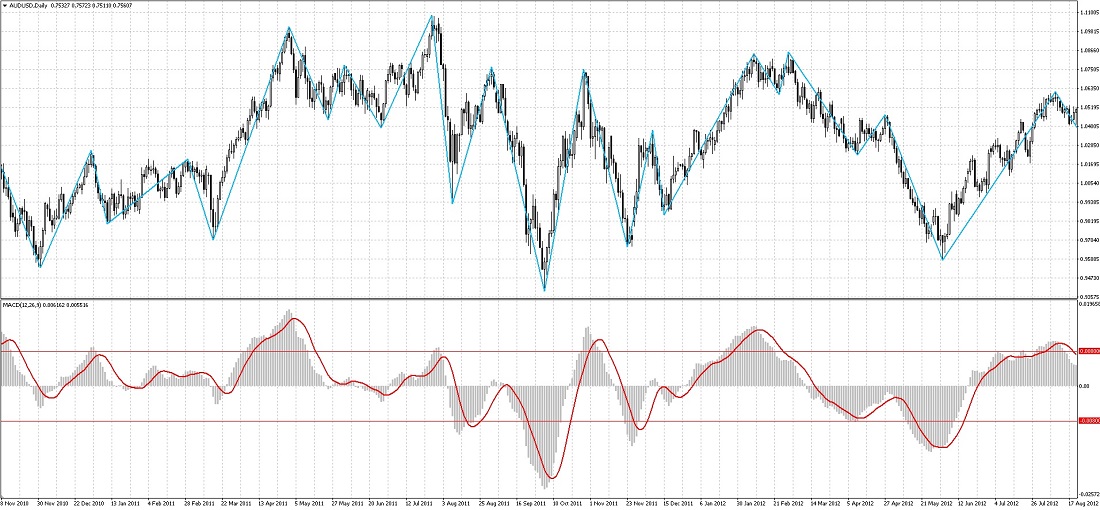
You can go even further and put a couple of levels on the MACD chart above and below zero to filter out insignificant fluctuations. In this case, you can take only those trades for which, when the signal appears, MACD had previously broken these levels. That is, the crossovers occurred above or below these levels or near them. In this case, we will use the oscillator properties of MACD even more fully.
In general, MACD can be used most effectively precisely in such conditions - when the market is not in a definite trend and at the same time the swing range is sufficiently large.
Divergences

As befits all oscillators, the strongest MACD signal is divergence. An article about the types of divergence and methods for identifying it has already been written on the blog, so we will not repeat ourselves. I will only say that divergence from the MACD indicator is the most accurate compared with other oscillators.
Determining the Further Short-Term Trend by the Histogram Bars
So, by the histogram bars you can determine the continuation of the current short-term trend and even build a simple trading system on this property of the indicator.
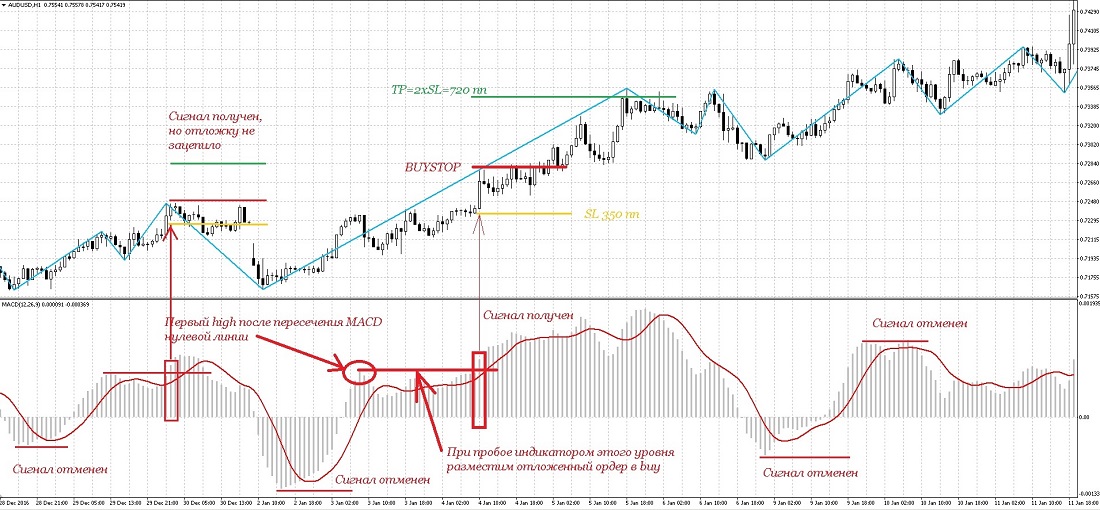
Very often, when a new peak appears immediately after the MACD indicator crosses the zero mark, another peak appears as well, a higher one. As a rule, after the first peak is broken, price continues moving or immediately reverses. If you place pending orders above the first candle on which the MACD indicator broke its previous maximum, you may end up with a quite profitable trading system.
Technical Analysis Patterns
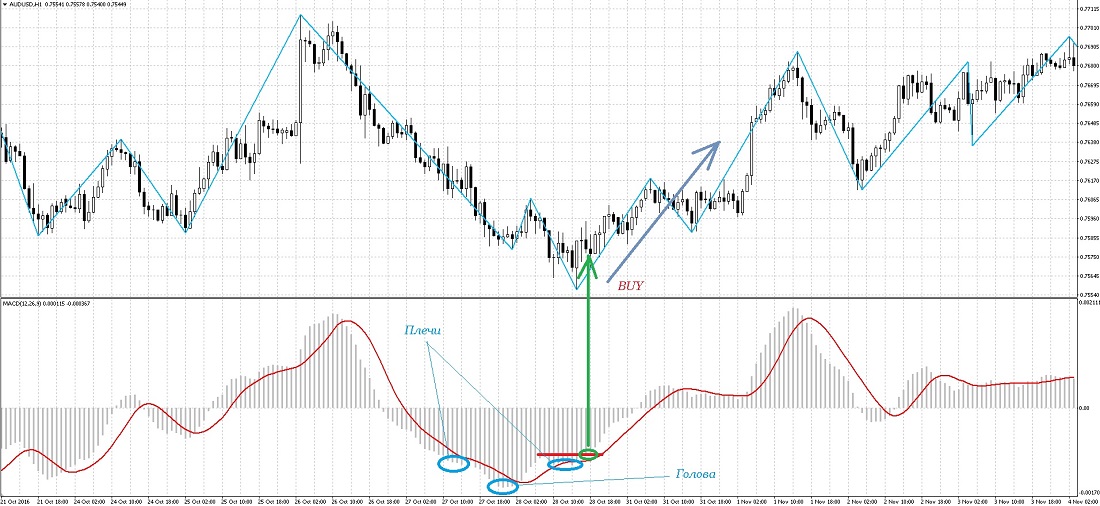
Upon close examination of the histogram drawn by the MACD indicator, you can notice that patterns also work out on it quite well.
In the picture above, it is clearly visible that when using the principle described in the previous point, you can also successfully trade classical patterns such as head and shoulders and the double bottom. The picture above shows a MACD indicator double bottom. When the right shoulder is broken, you can place a pending order (a buy order in this case) and enter at the very beginning of the new move.
Using It Together with Other Indicators

Using indicators together is always a good idea. Every indicator has its strengths and weaknesses. A computer will let you plot as many indicators on your price chart as you want. Try combining them. Oscillators work especially well in a choppy market environment and at important turning points, when the trend is losing momentum. During a strong upward trend in the market, oscillators can do more harm than good.
The signals generated by stochastic lines sometimes appear too often and are unreliable when stochastic alone is used. MACD crossovers are less frequent and more reliable (although usually slower). A way to increase the value of both indicators is to combine them. Why not, for example, use the trend-following characteristics of the MACD system as a stochastic filter? In other words, follow buy signals on stochastic crossovers only when the MACD lines have a positive projection.
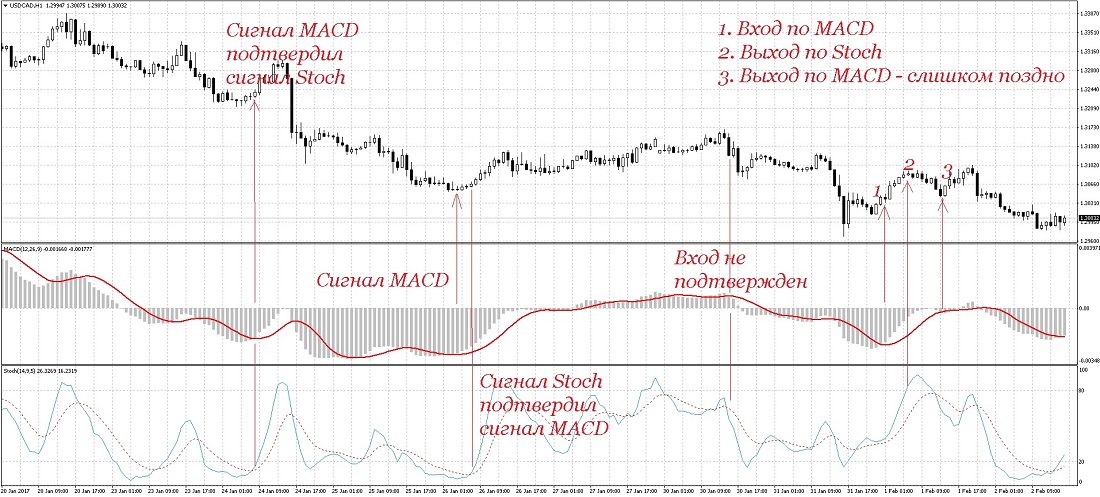
You can also use the weekly MACD histogram as a filter for daily stochastic signals. You would use buy signals on the daily stochastic chart to enter on the buy side only when the weekly MACD histogram has a positive value or is rising. In such a bullish environment, it is better for you to ignore short-term sell signals from the more sensitive stochastic system.
Advantages of MACD

One of MACD's main advantages is that it includes elements of both momentum and trend in one indicator. As a trend-following indicator, it will not give false information for too long. The use of moving averages ensures that the indicator will follow the movements of the market instrument. By using exponential moving averages instead of simple moving averages, it was possible to reduce the lag.
Divergences in MACD can be key factors in forecasting a trend change. Negative divergences signal that bullish momentum is weakening and that a trend change from bullish to bearish is possible. This can serve as a warning signal for traders to lock in part of the profit in long positions or for aggressive traders to consider opening short positions.
Disadvantages of MACD

One of MACD's advantages can also be a disadvantage. Moving averages, whether simple, exponential, or weighted, are lagging indicators. Even though MACD represents the difference between two moving averages, there can still be some delay in the indicator itself.
MACD is not particularly good at determining overbought and oversold levels. Although it is possible to determine levels that historically represent overbought and oversold conditions, MACD does not have any upper or lower limits restricting its movement. MACD can continue moving beyond historical extremes.
MACD calculates the absolute, not relative, difference between two moving averages. It is calculated by subtracting one moving average from another. If a market instrument rises in price, then the difference (both positive and negative) between the two moving averages will grow. Therefore, it is difficult to compare MACD levels over a long period of time, especially for instruments that have grown exponentially.
Conclusion

Because the MACD indicator has both the properties of a trend indicator and the properties of an oscillator, its use in trading can be very flexible. A huge number of trading systems use this remarkable indicator to generate signals. Nevertheless, like most indicators, using its signals for trading without additional filtering is extremely dangerous and can lead to blowing the account. This is another excellent tool in the trader's toolbox, and how to use it depends only on you. Use indicators wisely, analyze and weigh your decisions, and success will certainly always accompany you.
Forum thread (+more than 500 indicator mods)
Respectfully, Dmitry aka Silentspec TradeLikeaPro.ru