
Kimchi Premium and Other Secret Indicators of the Cryptocurrency Market

Hello, fellow traders, holders, and crypto enthusiasts!
The cryptocurrency market provides an excellent opportunity to multiply your own capital. According to observations by Holdcalc.com, almost 98% of Bitcoin sessions over its entire history ended the trading day in profit.
This is a fantastic result that no financial or commodity instrument can boast, however, according to the unspoken statistics of cryptocurrency exchanges, 90% of traders wiped out their accounts during the crypto winter, the 80% drop in Bitcoin throughout 2018.
In today's article, we will get acquainted with unconventional indicators for forecasting Bitcoin's price, see how effective and accurate they are, and whether they can complement (or replace) classical technical analysis.

Unlike the main cryptocurrency, altcoins and tokens lost more than 90% of their value, and many speculators kept most of their funds precisely in these digital assets because of the high growth potential of cryptocurrencies compared with Bitcoin during the 2017 rally.
Now the crypto winter is over, and the ten-year history of market trading in digital assets gives hope for the recovery of Bitcoin and altcoin prices and the achievement of new highs. Besides hope, investors and speculators would also benefit from indicators predicting:
As such indicators, one can use some market anomalies in cryptocurrencies discovered by analysts, as well as adaptations of technical analysis tools from stock indices and the Forex market to Bitcoin price and trading volume data.

At the end of 2017, analysts unexpectedly discovered a divergence in Bitcoin prices on South Korean cryptocurrency exchanges compared with other venues, for example in the USA, where Coinbase, the global leader by number of trader accounts, operated in the market.
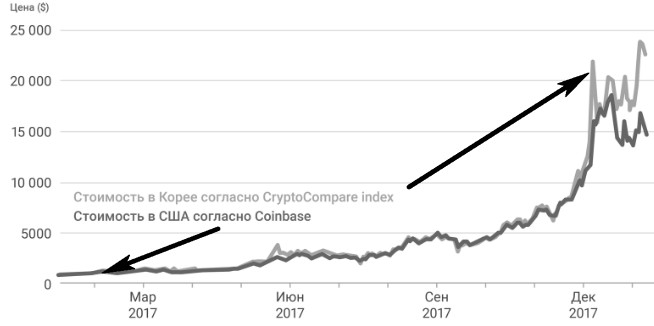
This persistent phenomenon, observed for three months in a row, was called the kimchi premium.
The divergence in Bitcoin's price was formed by a sequence of circumstances:
1. The expulsion of cryptocurrency exchanges and the ban on the circulation of digital currencies in the PRC;
2. The flourishing of crypto trading in South Korea, which took a 25% share of the global Bitcoin trading volume;
3. A campaign by the government of the Republic of Korea aimed at the "nationalization" of cryptocurrency exchanges.
By nationalization is meant the authorities' requirement that local venues conduct total account verification. Instead of checking documents provided by clients, the exchanges forced only clients served by South Korean banks to open accounts. This way the government guaranteed that accounts would pass verification according to all the rules (KYC and AML), but in fact closed the venues to foreign traders.
The resulting peculiar "internal market" gave rise to the kimchi premium, which "faded away" at the beginning of March 2018 and was forgotten.
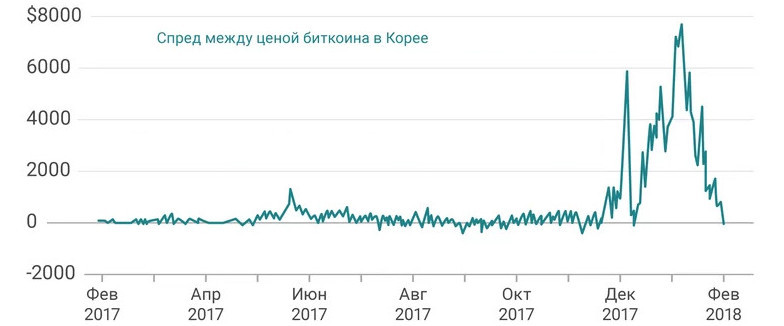
In June 2019, the kimchi premium recovered, which led experts to present this spread indicator as a sign of crypto winter. The largest divergence from the global average price, reaching a $1000 spread, was recorded on the Korean exchange Gopax.
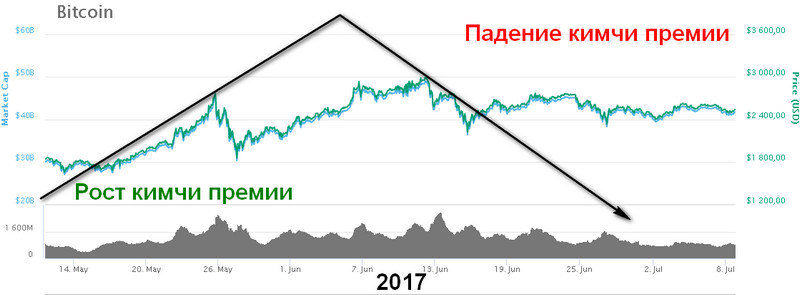
As can be seen from the chart above, this is not enough to establish a sustained rally in the Bitcoin market; last year during Bitcoin's sharp rise, the difference started from $2000 and grew steadily. The June situation exactly resembles the same case that arose two years earlier. The kimchi premium first appeared in May 2017 and immediately faded away.
A similar picture is being observed at the present moment: the price of Bitcoin equalized on global venues and Korean exchanges, after which the BTCUSD rate fell by 40%. In June 2017, after the kimchi premium dropped to zero, the cryptocurrency market also corrected by 50%.

The main problem with using this indicator is the absence of a ready-made graphic model. The trader will have to independently track the presence or absence of a difference in quotes for BTC on South Korean exchanges.
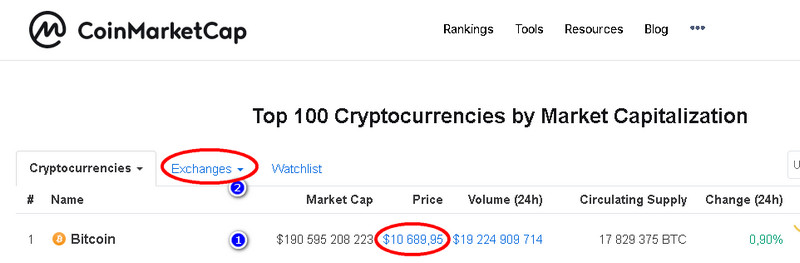
Use data from the analytical resource CoinMarketCap, where you can record and observe daily:
1. The average market value of BTC by opening the site's first page;
2. Find the price of the BTCKRW pair automatically converted into US dollars on the major Korean exchanges: Bithumb, Coinone, UPbit, Corbit.
Signals from the kimchi indicator are better evaluated in numeric spread values (thousands of US dollars) in order to make comparison with historical data possible. A growth threshold can be the excess over the $2000 level in the presence of a steady trend toward an increase in this indicator (five daily readings).
In this case, the trader should stop investing in the market, close part of the recently opened positions, and take measures to hedge the remaining part of Bitcoin.

Economics professor Nouriel Roubini, who became widely known for predicting the crisis of 2008 and for the nickname "Dr. Doom," is a consistent critic of the cryptocurrency market. In 2018, the scholar thoroughly studied the issuance of the USDT token and came to the conclusion that it was precisely the issuance of this digital asset that had been saving Bitcoin from a major collapse for half a year.
Many experts then reacted critically to Nouriel Roubini's statements, but the second half of last year fully proved the most influential economist according to Forbes right.
Tether USD is the world's first stablecoin, created by Bitfinex; the cryptocurrency exchange long concealed its authorship by opening the offshore company Tether Ltd and hiding its beneficiaries. The issued token was equated to the US dollar exchange rate, promising clients constant direct and reverse exchange.
It took place at the expense of accepted fiat currency, for the amount of which USDT issuance was launched. Its quantity could be checked on the blockchain, while the fiat US dollars were checked by an audit. The hard peg to the dollar made it possible to trade the token on other exchanges, which kept the cryptocurrency rate close to 1 to 1 with USD.
The proof is on the CoinmarketCap chart, a crypto statistics site that collects information from 20,000 venues. Starting from the spring of 2015, USDT maintained its peg to the US dollar.
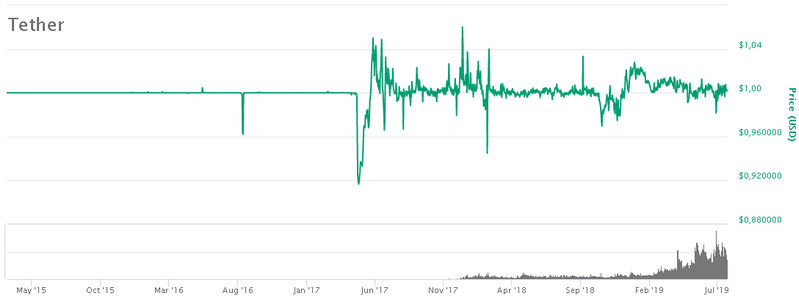
If you open the Tether USD capitalization chart, you can see how the continuous growth of token issuance was reflected in the fall of the cryptocurrency market; the "flood of cryptodollars" was able to stop panic selling and even organize bounces.
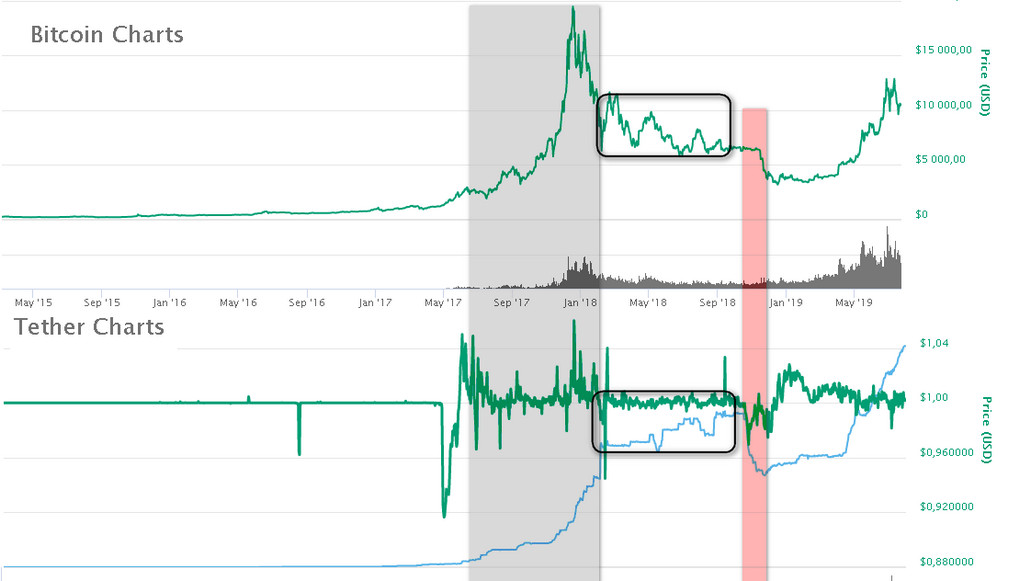
In the autumn, Tether Ltd and Bitfinex began having problems with the servicing bank, which forced them to sharply reduce capitalization by withdrawing fiat and destroying tokens. At the same time, the BTC rate collapsed to yearly lows, proving Roubini right.
Thanks to his observations, traders can track the issuance of USDT tokens, using the capitalization curve for a medium-term forecast, and the issuance fact for a short-term market entry.
In both cases, one should take into account the growth or decline in capitalization from $100 million; for medium-term tracking, a daily chart analysis will do. After issuance, USDT is distributed across exchanges within three days, after which the market follows its own trends.
Issuance does not guarantee mandatory medium-term growth, but within three sessions attempts to push the Bitcoin rate down will be bought up by market makers.
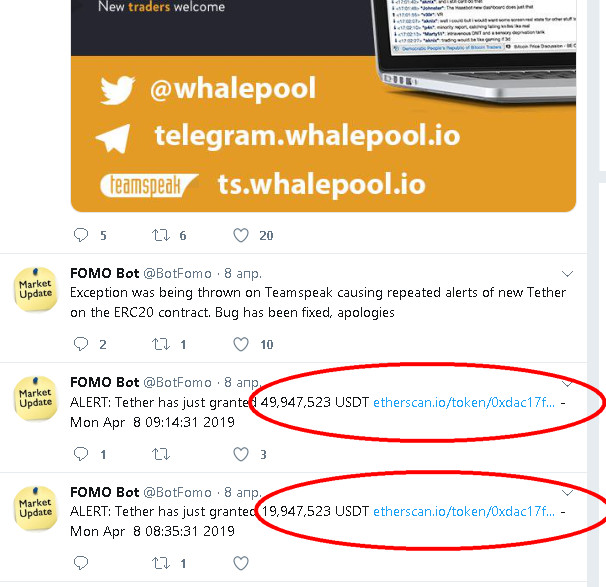
You can instantly track token issuance by constantly watching the blockchain and smart contract addresses. This is somewhat problematic, given Tether's expansion of the number of platforms and standards for issuing the stablecoin; the company now uses the Bitcoin, Ethereum and Tron blockchains.
So as not to sit in the block explorers of three platforms, use the Whalepool service, which sends important crypto statistics about large transfers in messengers via bots, including Tether issuance on any blockchain. The messages contain a link to learn in detail about the event that occurred.

Market statistics show that as the stock market rises, investors begin to feel greed. In an attempt to maximize profit, they neglect hedging and position protection.
In the stock market, stop-losses are not used directly, since traders open positions in options. The absence of stops leads to reduced volatility in their prices, which is accounted for with VIX, called the index of fear.
During a strong stock market rise, greed makes investors forget about fear (VIX takes low values) and stops. As a result, a deep correction turns into a panic sell-off. Stock indices face a crash, which works like a domino effect, sharply reducing the value of other assets.
Bitcoin, like a stock, is in demand among investors for holding in order to gain profit from the constant increase in value. It is believed that blockchain technology and broad decentralization make it possible to classify BTC as "digital gold," whose price will only rise over time.
Belief in a constant increase in the value of cryptocurrencies received a separate name, "to the moon" (the rate flying up to the Moon). It gives rise to the FOMO phobia of purchases caused by the fear of missing out on profit, which ensures high volatility and steady multi-day demand for Bitcoin.
Low volatility, determined by the relative readings of the VIX indicator, points to an upcoming correction. It is believed that at values of 40 and below, traders should fear a crash, which definitely comes after the indicator falls to the 20 mark.
As soon as the first serious losses arise, investors remember hedging, and the increased demand for options is reflected in readings above 60, signaling the market bottom.
The fear index for Bitcoin is called LXVX; it is calculated from cryptocurrency option prices by the institutional investor exchange Ledger X. There are no "accidental traders" on the venue, which indicates the reliability of the data, for which there is not yet a large archive of historical quotes.
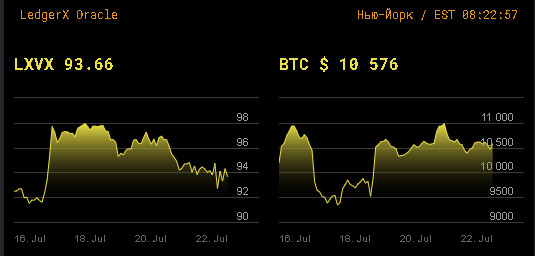
The current LXVX values are encouraging, showing that Bitcoin is at the very beginning of growth, but the crypto winter has not yet passed; investors are still excessively cautious, actively hedging the BTC coins they hold.
The past crypto winter took place at index values of 40-45; the recovery of the Bitcoin rate started when LXVX reached 75 points.

The Ledger X cryptocurrency exchange provides an opportunity to get another indicator for determining support and resistance levels of Bitcoin. These are conditional price zones where there is a high probability of a rate reversal.
If quotes are rising, pre-defined resistance levels serve for partial or full profit-taking. If the support zone is identified correctly, when prices fall you can try to make a purchase in hopes of a reversal into growth or a bounce, which will allow the trader to move the position to break-even by placing a pending order stop-loss at the entry price.
Resistance and support levels are determined by the largest Open Interest (OI), the number of option contracts opened at a certain Bitcoin price. Its values together with the number of options are recorded in a special table.
After the column of the current date (1) comes the designation of the option series with the contract expiration (burn/exercise) date (2). One should take the contracts of the nearest series; in the example under consideration, this is July 26.
The expiration period of contracts is the month during which the Open Interest data may change; their values are reflected in the 6th column of the table, on which we set a filter, sorting the number of contracts in descending order.
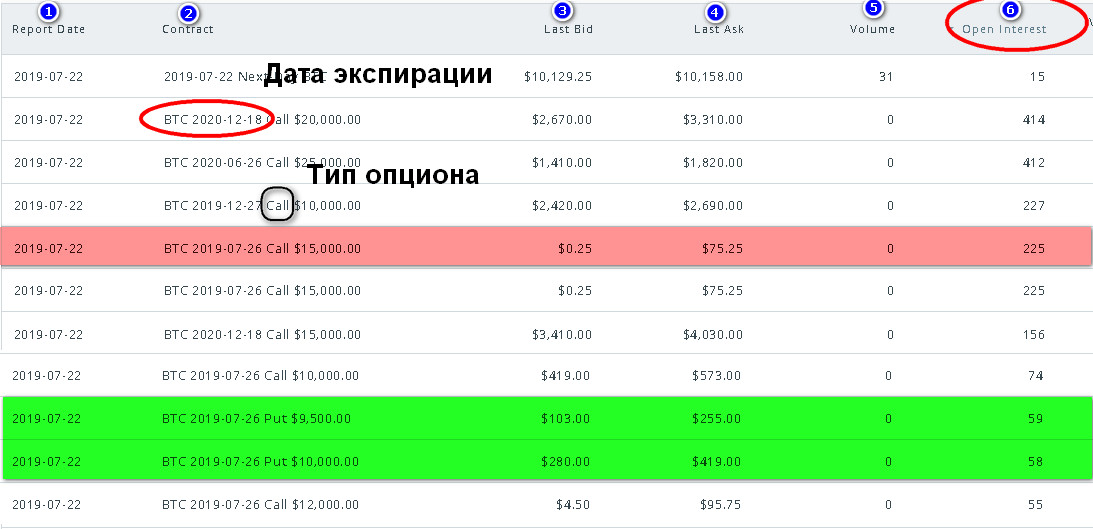
Bitcoin resistance levels are determined by Call-type contracts, support levels by Put contracts. As can be seen from the table, the nearest resistance was at $15000, and support during the decline in July was provided by the $9500 level.
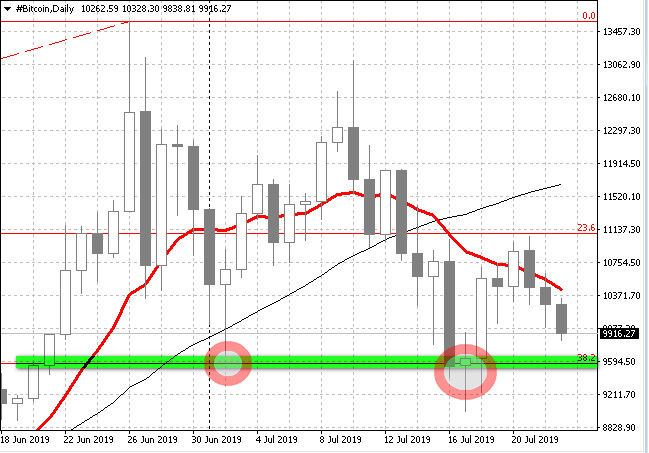
How truthful the readings are can be seen on the BTCUSD chart: in July, the quotes reversed precisely from this price zone. To clarify how far below support or above resistance the price can fall or rise, you need to add to or subtract from the OI price the current values of the Bid (3) or Ask (4) column.

The value of the described indicators lies in the fact that they do not use "abstract formulas"; their readings are based on real variables directly related to the cryptocurrency or Bitcoin market. This gives the trader the opportunity to receive timely, non-lagging signals, know in advance about a coming pump, and reliably determine the points where a panic sell may possibly stop.
Best regards, Alexey Vergunov
Tlap.io