
Introduction to Gann Methodology: Tools in MT4

Good afternoon, fellow forex traders! At the request of many, we are beginning a series of lessons devoted to Gann trading methodology.
William Gann was one of the most famous traders of the 20th century. His trading strategy provoked a wide response among his contemporaries. Gann gave the impression of possessing superhuman intellectual abilities. It would not be superfluous here to make a reservation regarding the key qualities without which there is no point in even setting out on the path of creative searching, the search for worthy and viable trading strategies. Gann repeatedly pointed out that the fundamental principle for a trader is perfectionism, an unwavering drive for self-improvement. Not to be satisfied with what has been achieved, always to go further, and, responding to the current demands of the market, to channel the course of one's personal trading potential.
Theory and Method of Gann
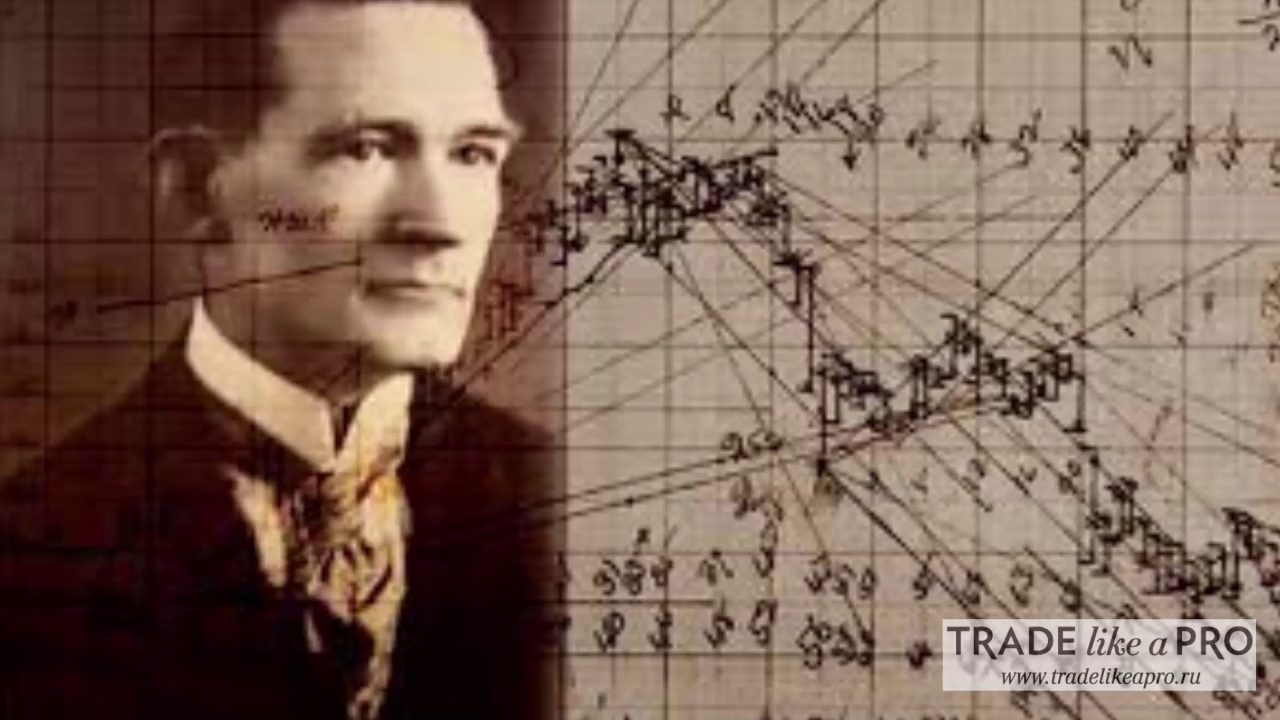
Gann was considered a religious man. He believed in the scientific value of the Bible as the greatest book ever written. He was also a 32nd-degree Mason of the Scottish Rite, to which his knowledge of ancient mathematics is attributed, although he was also known as an expert on ancient Greek and Egyptian cultures.
Gann's market forecasting strategies were based on methods used in geometry, astronomy, astrology, and ancient mathematics. Opinions on the value and significance of his works are sharply divided. Gann also wrote a number of books on stock exchange trading.
![Gann Lesson1 1080p[13-58-08]](https://tlap.io/strapi/uploads/2015/08/Gann-Urok1-1080p13-58-081.jpg)
Biography of William Delbert Gann
![Gann Lesson1 1080p[13-59-20]](https://tlap.io/strapi/uploads/2015/08/Gann-Urok1-1080p13-59-20.jpg)
William Delbert Gann was born on June 6, 1878, in the settlement of Lufkin, Texas.
His family was poor. Samuel, Susan and their eight children lived in a small house, and young William, in order to get to school, walked seven miles every day for three years. Gann never graduated from high school.
At the age of 13, Gann earned a living by selling cigars and newspapers on trains. In the course of his work, he heard many conversations about investments and listened to this information.
Gann wondered whether it was really possible to predict the future. Many of the conversations he overheard most likely revolved around forecasting the price of cotton. How possible was that?
In 1903, at the age of 25, Gann moved to New York and began working at a large brokerage firm on Wall Street. During the First World War, he and his family moved from Manhattan to Brooklyn. Gann predicted the abdication of Wilhelm Kaiser, which took place on November 9, 1918, and the end of the war.
Gann began by studying the basic principles of price patterns and the philosophy of how to accumulate wealth and preserve it. Having become successful, he wanted to know why and how markets and numbers repeat during certain time cycles. This led to further study of ancient geometry and astrology. These studies contributed to the fact that by the time of his death on June 18, 1955, Gann had accumulated more than 50 million dollars.
Gann became the only financial astrologer of his time. A quote from Commerce magazine dated January 15, 1921, states: "His calculations are based on scientific literature, figures, and astrology." It was reported that Gann used airplanes to forecast the harvest of agricultural crops, but this was extremely unlikely, since he knew in advance what the market was doing. This is proved in his book Tunnel Through the Air, where he forecasts the exact rise in the price of cotton on September 8, 1927, to 24.40 USD (p. 196), as well as in the book How to Make Profits in Commodities on p. 208, which speaks of forecasting the exact time and price. He also predicted that on October 3, 1931, the exchange would close because of panic selling, that on October 5 the market would reach bottom, and that on November 9, 1931, the market would trade briskly in the range from 85.51 to a high of 119.15, as forecast in Tunnel Through the Air on pp. 321-323. This book was published on May 9, 1927.
After his death, Gann became something of a legend in financial circles. His ability to make large financial profits (both in the market and in the Cuban lottery and at the races) gave him a reputation for an inexplicable foresight of market trends. Even now there is a rumor that he once bet on a certain number in the Cuban lottery, and on the day the results were announced he flew to Cuba in his own airplane, piloted by a young woman, to collect his winnings without waiting for the preliminary announcement of the results. As was said, he predicted the start of the First World War in 1914 and the resulting panic in the stock market. In March 1918, he predicted the end of the war and the Kaiser's abdication. He predicted positive shifts in business in 1921, and in November 1928 he forecast the end of the bull stock market on September 3, 1929. Often, during the 1920s and 1930s, the market showed no movement in terms of changes in cotton and wheat prices. In 1935, of 98 trades made by him in cotton, grain, and rubber, 83 were profitable. His percentage of profitable trades usually exceeded 90%. Speculators and traders were interested in stories of this kind: how was he able to achieve such amazing success?
Gann wrote many books on trading in which he shed a little light on his secret, but upon close study of his works the real mystery escapes us. Instead, Gann himself mentions a mystical source of his methods. In one of his books, The Magic Word, Gann promises "health, happiness, and prosperity through the application of the magic word, Jehovah." He subjects the reader to a change in his life path, leading him through the most mystical sections of the Bible, often repeating to himself and asserting that in some sense (which he never reveals), Jehovah (whom he calls the "Lost Word") is the key factor directing us toward the good things in life.
Numerous hints in Gann's writings inform the perceptive reader of his involvement in Freemasonry. The mention of Jehovah as the Lost Word in the above-cited work, for example, is an indication of his relation to the title of Royal Arch Masons. Gann was a member of the Masonic lodges Commonwealth-Stella Lodge No. 409, Free & Accepted Masons, New York City. Nevertheless, his Masonic career is not the key to his astonishing success on Wall Street. He became a member of Freemasonry on December 15, 1922, and was "raised" to the degree of Master Mason on March 27, 1923. And in 1939 Gann "laid down his office," that is, he left the Masonic community. As Gann himself reported, his "greatest discovery" was made in New York in 1908. Whatever his secret may have been, he discovered it long before he was a member of the Masonic community.
From all of the above, you may have understood that Gann was a very odious and unconventional personality.
Within the framework of the entire course, we will study such tools as:
- Gann line;
- Gann fan;
- Gann grid;
- Gann angles;
- square of nine;
- trading by Gann swing methods;
- price and time forecasting.
Today's video lesson is entirely devoted to an overview of Gann tools, specifically: the Gann line, angles, and fan.
These tools are available in Metatrader 4 under the path: Insert -> Gann -> angles fan line.
Gann Line
![Gann Lesson1 1080p[14-46-10]](https://tlap.io/strapi/uploads/2015/08/Gann-Urok1-1080p14-46-103.jpg)
First of all, we will consider a tool called the "Gann Line," also known as "one to one" or "1x1," implying the corresponding transformation of price relative to a unit of time. The tool allows you to draw a line at a 45° angle.
Gann called such a line a long-term ascending or descending trend line. Accordingly, prices above an ascending line indicate that the market is in a bullish trend. And conversely, if prices are positioned below a descending line, this is a bearish market. The crossing of the lines indicates a break in the main trend. If prices during an uptrend fall to such a line, then time and price reach equilibrium. All further crossings, in turn, signal a violation of this equilibrium.
![Gann Lesson1 1080p[14-46-10]](https://tlap.io/strapi/uploads/2015/08/Gann-Urok1-1080p14-46-104.jpg)
In order to build a Gann Line, it is necessary to define two points.
Gann Fan
Next, let us consider a tool called the Gann Fan. The lines of the Gann Fan are drawn at various angles from an important base or peak on the price chart. Gann considered the 1x1 trend line the most important. The position of the price curve above this line is a sign of a bullish market, and below it, of a bearish one. Gann believed that the 1x1 ray is a powerful support line in an uptrend, and regarded a break of this line as an important reversal signal. Gann identified the following nine main angles, among which the 1x1 angle is the most important:
- 1x8 — 82.5 degrees;
- 1x4 — 75 degrees;
- 1x3 — 71.25 degrees;
- 1x2 — 63.75 degrees;
- 1x1 — 45 degrees;
- 2x1 — 26.25 degrees;
- 3x1 — 18.75 degrees;
- 4x1 — 15 degrees;
- 8x1 — 7.5 degrees.
![Gann Lesson1 1080p[14-46-10]](https://tlap.io/strapi/uploads/2015/08/Gann-Urok1-1080p14-46-105.jpg)
For the considered ratios of price increase and time to have the corresponding angles of inclination in degrees, the X and Y axes must have identical scales. This means that a unit interval on the X axis, that is, an hour, day, week, or month, must correspond to a unit interval on the Y axis. The simplest way to calibrate the chart is to check the angle of the 1x1 ray: it should be 45 degrees.
Gann noted that each of the above-mentioned rays can serve as support or resistance depending on the direction of the price trend. For example, in an uptrend the 1x1 ray is usually the most important support line. A drop in prices below the 1x1 line indicates a trend reversal. According to Gann, prices should then fall to the next trend line, in this case the 2x1 ray. In other words, if one of the rays of the Gann Fan is broken, price consolidation near the next ray should be expected.
Gann Grid

Now let us move on to our final tool called the "Gann Grid."
The Gann Grid consists of trends drawn at a 45-degree angle, that is, Gann Lines. According to Gann's concept, the forty-five-degree line represents a long-term trend line either ascending or descending. As long as prices are above a rising line, the market maintains a bullish direction. If prices stay below a descending line, the market is characterized as bearish. Crossing a Gann Line usually signals a break in the main trend. When prices during an uptrend fall to this line, time and price become fully balanced. Further crossings of Gann Lines indicate a disruption of this balance and a possible change in trend.
![Gann Lesson1 1080p[14-46-10]](https://tlap.io/strapi/uploads/2015/08/Gann-Urok1-1080p14-46-106.jpg)
To build a Gann Grid, it is necessary to specify two points that determine the cell sizes. The Gann Grid provides reference points for places of price consolidation.
And in Conclusion
Today we studied the basic tools of Gann trading methodology. Do not worry, we will examine each tool in more detail later. In future lessons, we will study more complex trading strategies and deepen our knowledge within the framework of Gann trading.
Respectfully, Alexey Vergunov
TradeLikeaPro.ru