
Indicators for Fundamental Analysis of EURUSD

Hello, fellow Forex traders!
Many of us "steer clear" of fundamental indicators and their analysis because of the market's unpredictable reaction to the published values of a country's economic indicators.
But there are several understandable and accessible indicators for fundamental analysis that are ideal for the EURUSD pair and allow you to understand in advance what sentiment prevails in the market. Without reading dreary analysis from economists.

For example, traders may "illogically" sell the national currency when inflation rises, signaling economic growth, assuming that the Central Bank will raise the rate. When this happens, the national currency will be bought contrary to fundamental, "textbook" theory if there was a steady downward trend during the month before the rate committee meeting.
The same situation arises when other fundamental indicators are released, which makes this type of analysis subjective, unlike technical indicators, which give a clear signal in specific values or at the crossing of overbought/oversold levels.
The impact of U.S. GDP on the EURUSD exchange rate and the DXY (USDX) dollar index

The U.S. economy ranks first in the world by size, so the value of national GDP directly affects the international Forex market. Investors pay attention to the dynamics of gross income: the current percentage growth or decline of this indicator relative to last year.
The government statistics bureau of the United States releases quarterly GDP values. A move of the indicator into negative territory can lead to a strong fall in EURUSD, and a recession (a decline for two months in a row) to a full-scale economic crisis. The end of 2008 and the middle of 2014 clearly demonstrate this fact.
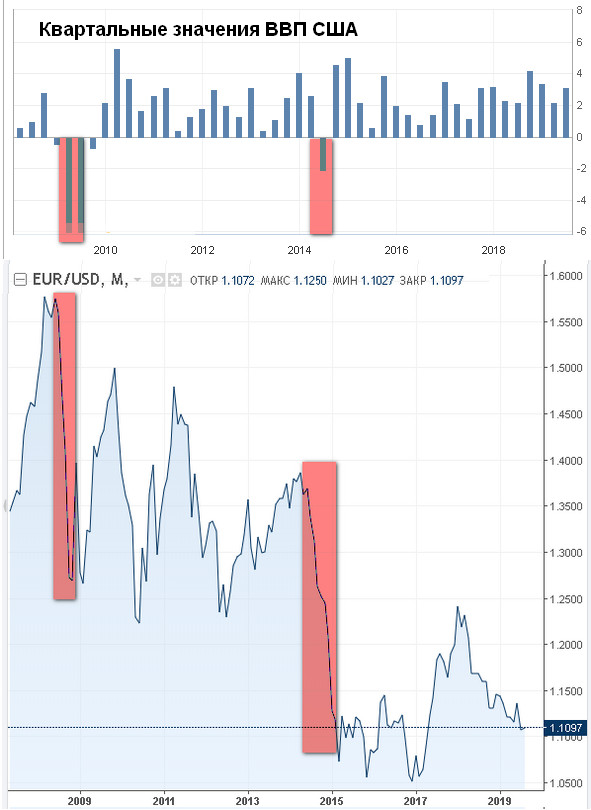
An economic downturn in the U.S. forces investors to "save" capital in American government bonds, which leads to sharp demand for dollars. Weak indicators also become a reason for downward trends in the EURUSD pair.
Despite the unambiguous impact of GDP on the exchange rate, it is not convenient to use the quarterly values of the indicator, since the data are published monthly but constantly revised, the final version arrives with a great delay and has already been priced in by insiders in the quotes.
Strategy for forecasting long-term EURUSD trends

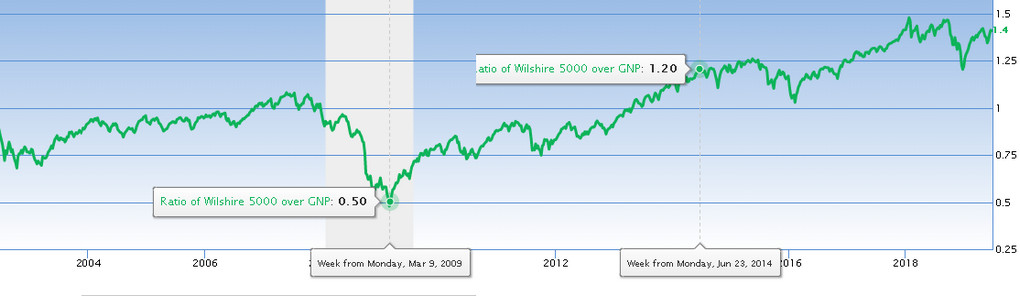
For long-term forecasting of the EURUSD rate, the Buffett indicator is suitable: the ratio of stock market capitalization to national GDP, expressed as a percentage. The calculation formula is quite simple: the numerator contains the total value of 5000 U.S. stock market shares divided by the nominal U.S. GDP expressed in dollars.
Capitalization is reflected in the Wilshire 5000 Total Market Full Cap index; at the moment it is about $30 billion, while GDP is published by the FED, whose latest April data showed gross income of a little more than $21 billion.
Warren Buffett Index = (Wilshire 5000 Total Market Full Cap/ U.S. GDP)*100% = (29938/21338)*100 = 140,33%
Despite the lagging values of the indicator and the infrequent data updates (once a quarter), it is used as an oscillator of global reversals for the EURUSD currency pair:
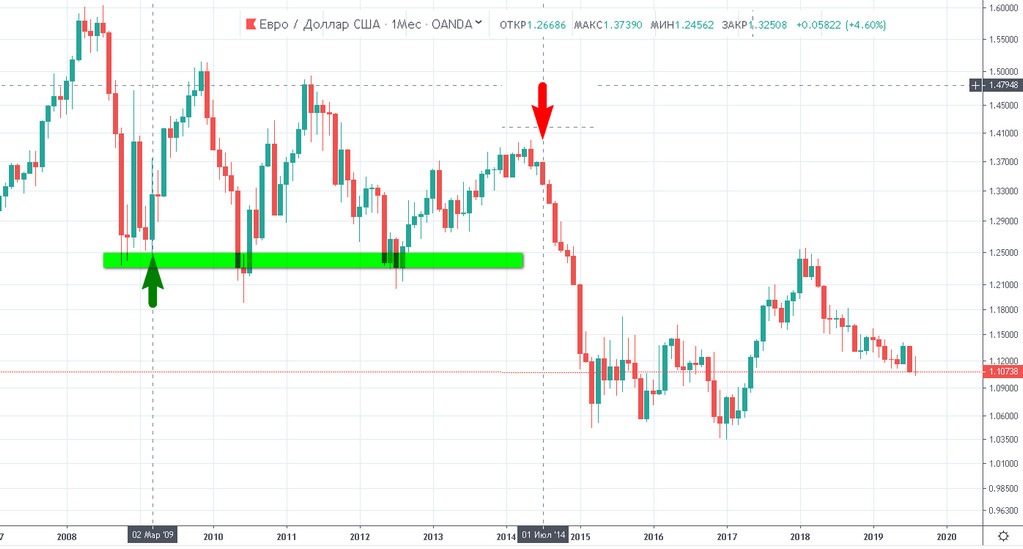
As can be seen from the chart shown below, the Buffett index predicted a global long reversal in the EURUSD pair based on the March 2009 figures and a long-term short starting from the winter of 2014.
If you transfer the signal to the EURUSD chart, it turns out that the oscillator accurately indicated the long-term support that held for four years and the global reversal of 2014. Given the persistent overbought state of the wilshire 5000 gdp ratio, one can assume the possible achievement of euro-dollar parity.
When using Buffett's formula for national stock markets and currencies, the trader will have to determine overbought and oversold levels in each individual case. Given the global influence of the dollar and euro on the rest of Forex currencies and the extremely small number of signals, such an adaptation makes no sense.
Using Buffett's formula for national stock markets and currenciestraderyou will have to determine the levels of overbought and oversold in each individual case. Considering the global influence of the dollar and euro on other Forex currencies and the extremely small number of signals, such an adaptation does not make sense.
Interest rates

This parameter determines the cost of loans to commercial banks issued by the Central Bank, the interest on corporate and consumer loans, and coupon payments on government debt. Loans are investments by global business directly into companies or into securities, while sovereign bonds are instruments for protecting corporate profits from inflation.
Both factors make interest rates the most important instrument for influencing the exchange rate of national currencies on the Forex market. Taking into account the specifics of trading currency pairs, traders track the interest differential, that is, the difference between Central Bank rates. Applied to the EURUSD instrument, this will be the ratio between the cost of credit from the ECB and from the U.S. Fed.
Both factors make interest rates the most important tool for influencing the exchange rate of national currencies in the Forex market. Taking into account the specifics of trading currency pairs,tradersThey monitor the interest differential, that is, the difference in the discount rates of Central Banks. In relation to the EURUSD instrument, this will be the ratio of the cost of a loan from the ECB and fromFedUSA.
The Fed is the pillar of the Forex market

In addition to legislative acts, USD is involved in 85% of settlements under international contracts, more than 20 countries of the world use it instead of their national currency, and more than 65% of the world's Central Banks' gold and foreign exchange reserves are denominated in it.
The results of 10 votes during the year by the 12 bankers of the Federal Reserve Banks who make up the FOMC open market committee determine short-term changes in exchange rates and lay the groundwork for medium-term movements of global investments, as well as demand for loans in one currency or another.
The results of 10 votes during the year by the 12 bankers of the Federal Reserve Banks who make up the FOMC determine short-term changes in exchange rates and lay down medium-term movements in global investment, as well as the demand for loans in a particular currency.
Problems of “direct use” of the Fed and ECB policy rate decisions

This phenomenon determines the anti-cyclical policy of Central Banks, which are obliged to take all measures to reverse the trend, slow down or stimulate the pace of economic development depending on the current phase of the economy.
In fact, the Fed and the ECB take a countertrend position, which nullifies regulatory efforts: traders play off the lowering or raising of the rate, later returning to trading with the trend that runs counter to the regulator's efforts.
Markets reverse when many negative or positive fundamental indicators and political reasons coincide. All attempts by a novice trader to build a medium-term strategy solely on the principle of "rates up, we buy; down, we sell" will turn into losses.
The same will happen with the tactic of news trading: market participants can often forecast the size of the rate with a high degree of probability before the Central Bank meeting, which leads to the premature formation of speculative positions. Confirmation of forecasts is a reason for taking profit, and this forces the exchange rate to move in the opposite direction, not matching the theory.
The same will happen with tactics.trading on news, trading participants can often predict the rate size before the Central Bank meeting with a high degree of probability, which leads to the early formation of speculative positions. Confirmation of forecasts is a reason for fixationprofits, and this causes the exchange rate to go in the opposite direction, which does not coincide with theory.
How to take into account the fundamental change in Fed and ECB rates when forecasting the EURUSD rate

Bonds differ in maturity, and analysts use ten-year bonds, "cleansed" of the influence of current inflation, when drawing up a forecast. Treasury charts are built on the size of annual coupon income in the short period, which depends on jumps in the consumer price index.
The figure shown below clearly demonstrates the difference in the volatility of the yields on two-year bonds (the red curve) and ten-year bonds (the blue curve).
The monetary policy of the European Central Bank is taken into account in a similar way. Analysts rely in forecasts on Germany's 10-year bunds in order to forecast the EURUSD pair rate.
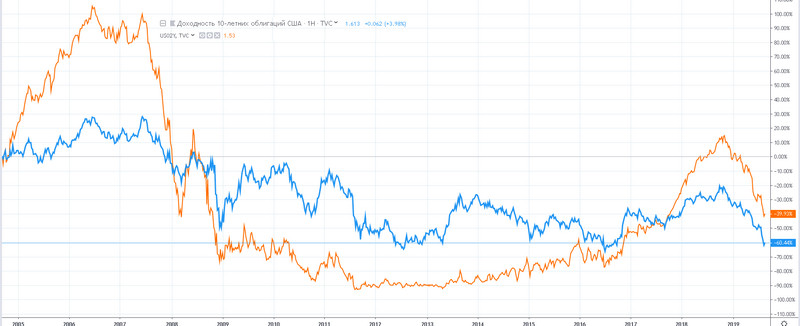
This approach explains why a rise in Fed rates often leads to an increase in the dollar rate, although textbooks on fundamental analysis always say the opposite. It is profitable for investors to invest funds in American bonds, as it is for speculators who receive excess capital in the form of fixed profit in the stock market. The Fed's hawkish policy is a signal of overheating, predicting a fall in securities prices.
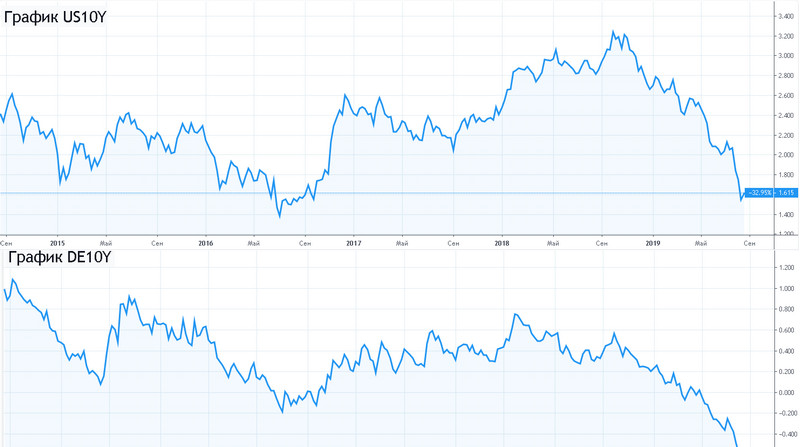
A constant reduction in the interest rate narrows the spread between treasuries and bunds, causing capital to flow into European bonds. As already noted above, the ECB and Fed regulators act to prevent crisis by raising rates in advance, but investors with bond positions react to policy changes even earlier, which makes it possible to use the spread as a leading indicator.
The tactic of divergences, described in detail in an article on our website, will help account for the leading factor. By creating a custom indicator in TraidingView that automatically subtracts DE10Y from US10Y, a trader can open a short position on EURUSD when the rate makes a maximum at the minimum spread difference, and vice versa: a minimum in rates when the rate soars will become a signal of a future decline in the currency pair.
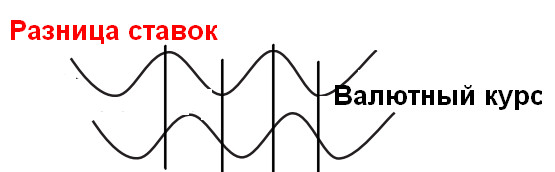
Tactics will help you take into account the lead factordivergences, described in detail inarticleon our website. By creating a custom indicator in the programTraidingView, which automatically subtracts DE10Y from US10Y,tradercan open a short position on EURUSD when the rate maximum is made at the minimum rate difference, and vice versa - the minimum rate when the rate rises will be a signal of a future decline in the currency pair.
Strategy for medium-term forecast of dollar index trends in the Forex market

The resulting system can be used to forecast medium-term trends. A divergence between the curves by +2% from the minimum values is taken as a signal of growth in the USDX dollar index. Convergence by 2% from the maximum point of the current delta is a signal of a trend change to downward.
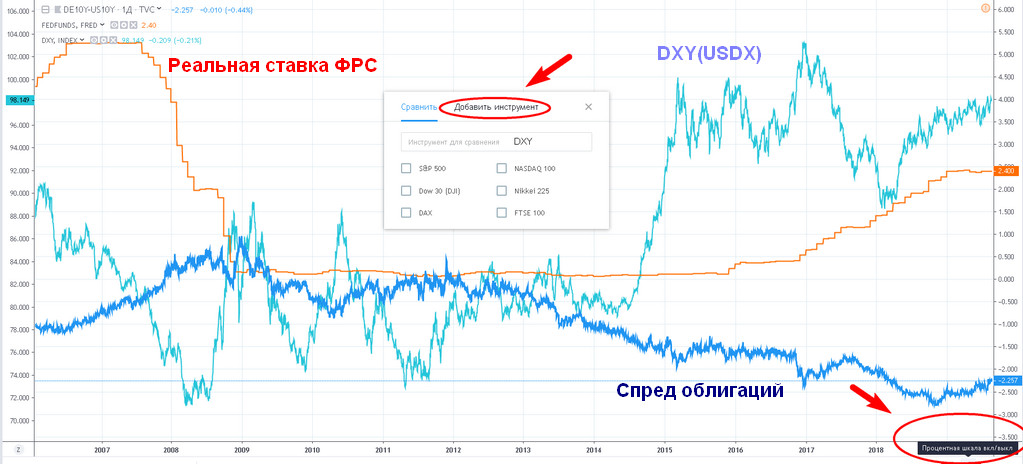
The dollar index is a non-tradable asset, but forecasting its movements allows you to trade an entire basket of major currencies at once, diversifying trading.
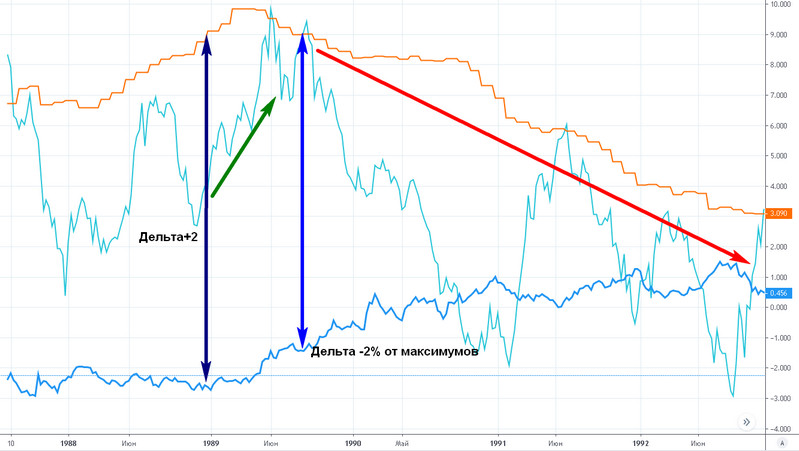
Periods of parallel movement of the bond yield spread and the Fed rate, when fluctuations fall within the range of +/- 1%, cause wideflatquotes.
GDP and the interest rate are the two main parameters of fundamental analysis. The first determines the real and relative dynamics of a state's economy, causing a response in the form of an adjustment to the second parameter.
Conclusion

Applying the spread scale of European (German) bond rates and treasuries makes it possible to arbitrage-wise assess the Fed's actions, which do not always agree with current fundamental indicators.
It makes sense to combine the two described trading systems into one: this will allow the trader to accurately determine the direction of the long-term trend, earning on the reliably predictable stability of strong global support and resistance levels. Medium-term trends allow you to find points of dollar strengthening and reinforcement within a large move.
Respectfully, Alexey Vergunov
Tlap.io
Best regards, Alexey Vergunov
Tlap.io
