
How to Use the U.S. Dollar Index in Forex Trading?
 Hello everyone!
Surely many of you have heard what an index is. It is an instrument that makes it possible to get a complete picture of the state of the economy in a certain industry, country, or even group of countries. There are quite a lot of different indices for the stock market, for example, the Dow Jones Industrial Average DJIA, the NASDAQ Composite, Russell 2000, S&P 500, Wilshire 5000, and so on. Among Russian ones, you may come across the MICEX and RTS indices.
Today we will talk in detail about the U.S. Dollar Index (most often denoted as DXY or USDX), which is widely used in Forex, and we will also look at its practical application in the currency market, and I will share one interesting indicator with you.
What Is the Dollar Index

The U.S. Dollar Index is a measure of the strength of the American currency, whose movement is watched by many market commentators and analysts. It includes a basket of foreign currencies whose value is compared with the value of the dollar. Everything is quite simple: the dollar index shows how the dollar feels relative to other world currencies, namely the euro, the yen, the pound, the Canadian dollar, the Swedish krona, and the Swiss franc. DXY is a convenient index that is used as a simple method for determining the strength and weakness of the U.S. dollar. But its widespread use masks the fact that it does not reflect the value of the dollar against a fairly large basket of other world currencies.
How the Dollar Index Is Calculated

The dollar index is a geometrically weighted index of the major trading partners of the United States listed above. The structure of the dollar index is heavily skewed toward the euro and European countries that have not yet joined the common European market. The weighted components of the dollar index are: euro (57.5%), Japanese yen (13.6%), British pound sterling (11.9%), Canadian dollar (9.1%), Swedish krona (4.2%), and Swiss franc (3.6%). Because of this composition, the DXY is also called an "anti-European" index.
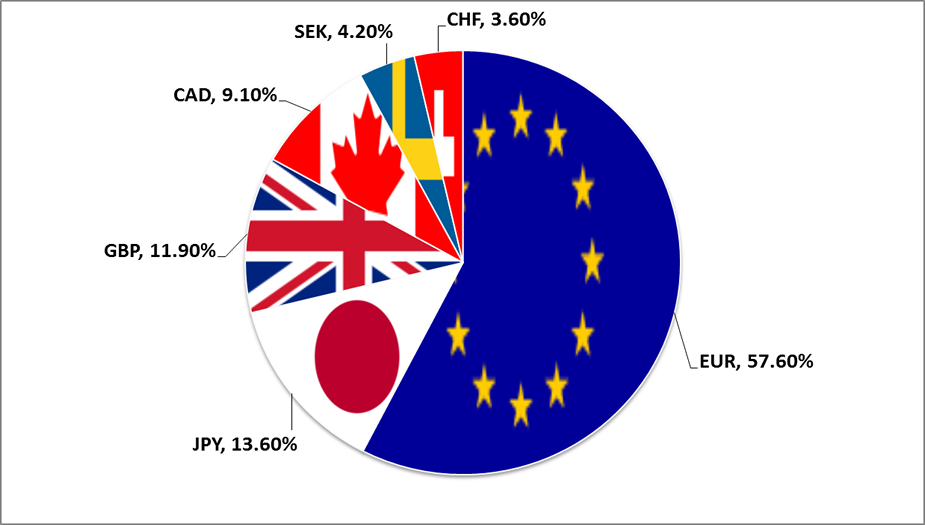
So, how many countries are included in the index? If you think there are six, you are greatly mistaken. In fact, there are many more. The thing is that the euro is the official currency in 19 Eurozone countries: Austria, Belgium, Germany, Greece, Ireland, Spain, Italy, Cyprus, Latvia, Lithuania, Luxembourg, Malta, the Netherlands, Portugal, Slovakia, Slovenia, Finland, France, and Estonia. The euro is also the national currency of 9 more states, 7 of which are located in Europe. However, unlike the Eurozone members, these countries cannot influence the monetary policy of the European Central Bank or send their representatives to its governing bodies. These countries are not taken into account in the dollar index. Add 5 more countries to this, Japan, the United Kingdom, Canada, Sweden, and Switzerland, and you get nearly the entire civilized world. Yes, China is missing, but the yuan is a specific currency, it never became a global reserve currency, and it is treated in a special way. The countries included in the index are not equal in their economic capabilities, so each of them is assigned only its own share in the index, which becomes clearer when looking at the index calculation formula:
The first coefficient in the formula brings the index value to 100 on the starting date, March 1973, when the major currencies began to be freely quoted against one another.
Disadvantages of the Dollar Index

Because the dollar index is heavily skewed toward European currencies, it significantly understates the share of the Canadian dollar, which is a major partner of the United States. In addition, this index completely ignores the currencies of the Asia-Pacific region, including Korea, Australia, Taiwan, and, more importantly, China. But even if someone tried to include the Chinese yuan in the calculation of the dollar index, it would be very difficult and not entirely correct, because China pegged the value of its currency to the U.S. dollar.
Despite some shortcomings, the DXY index serves as a reliable indicator of the strength and weakness of the U.S. dollar and can be used as such, if you remember that it may be distorted during significant fluctuations of the single European currency.
History of the Dollar Index

The dollar index (DXY) was created by JP Morgan in 1973 and since that time has been updated only once, when Europe introduced the single European currency, the euro.
The base value of the USDX index was set at 100.00. For example, a level of 107.50 means that the value of the dollar has risen by 7.5 percent relative to the base value. March 1973 was chosen as the base period because from that time the largest trading countries introduced floating exchange rates. This agreement was reached at the Smithsonian Institution conference in Washington. The Smithsonian Agreement replaced the failed policy of fixed exchange rates established about 25 years earlier at Bretton Woods.
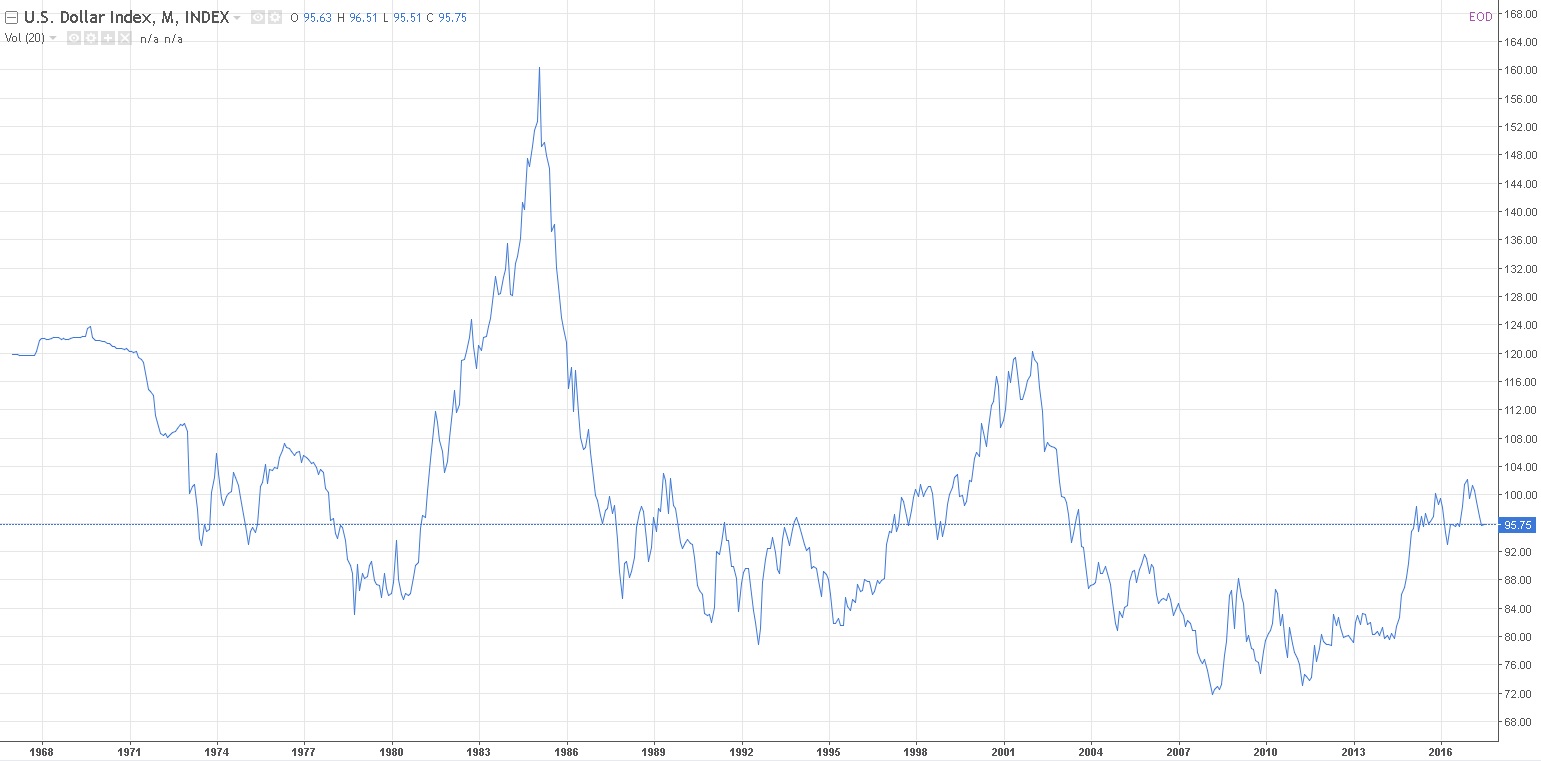
Since 1973, the index has traded as high as around 160.00, and on March 13, 2008, a new low of 71.99 was set. The index is updated 24 hours a day, 7 days a week. Just as the Dow Jones Index (DJI) is the main indicator of the U.S. stock market, the USDX index gives a general idea of the international value of the U.S. dollar.
Here is what its chart looks like:
Trade-Weighted Dollar Index

If the dollar index is so inaccurate, why does everyone pay so much attention to it? Although there are more accurate ways to assess the U.S. dollar, absolute accuracy is not always important for an indicator. Many traders and financial companies surely have their own indicators that they use to track the value of the dollar, but for comparison it is always very convenient to use a common index. Most of the time, the dollar index is also closely correlated with the trade-weighted index (TWDI, Trade-Weighted Dollar Index) used by the U.S. Federal Reserve.
It was created to reflect more accurately the value of the dollar relative to other national currencies, taking into account the competitiveness of American goods and services. The relative strength or weakness of the U.S. dollar's movement reflects enormous flows of money. A 10% rise in the U.S. dollar index is equivalent to a nominal decline in the value of global wealth by more than 1 trillion dollars. A move of this scale does not happen in a vacuum, and the relative weakness of the dollar index reflects the corresponding weakness of the trade-weighted index.
The index is fairly recent; it appeared in 1998. It already contains many more currencies, including the yuan and even the ruble, and their share as of July 2017 looks like this:
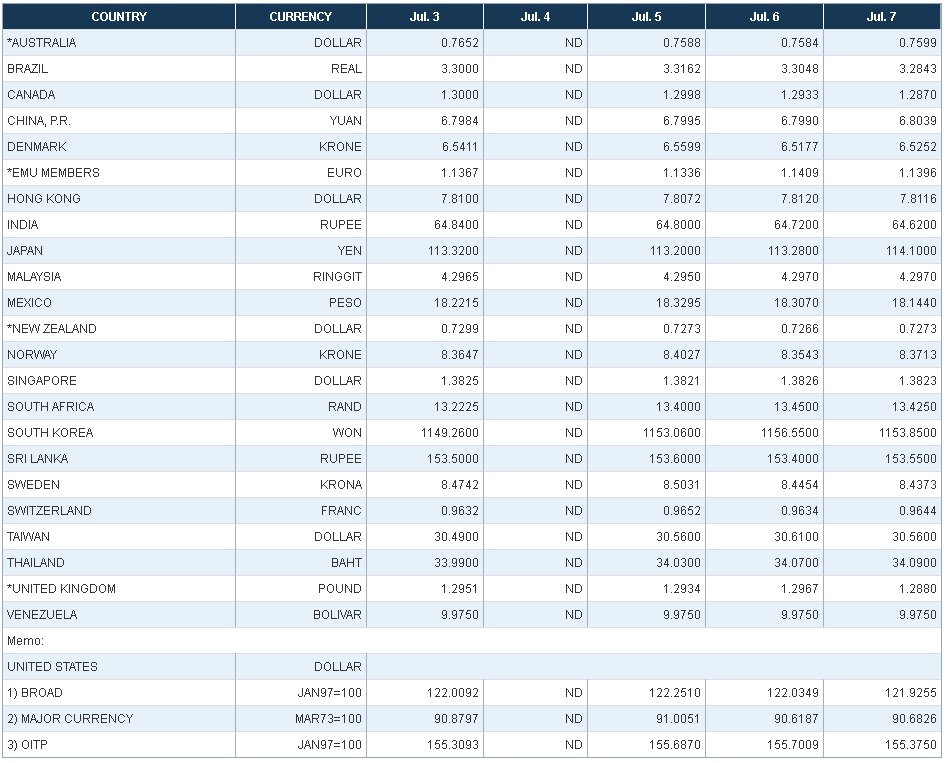 You can always get more recent data on the Federal Reserve website
By the way, you can also get historical quotes there for the D1 period of the dollar against the major world currencies all the way back to 1971.
In general, if you take a quick look at the TWDI chart, it is almost indistinguishable from DXY:
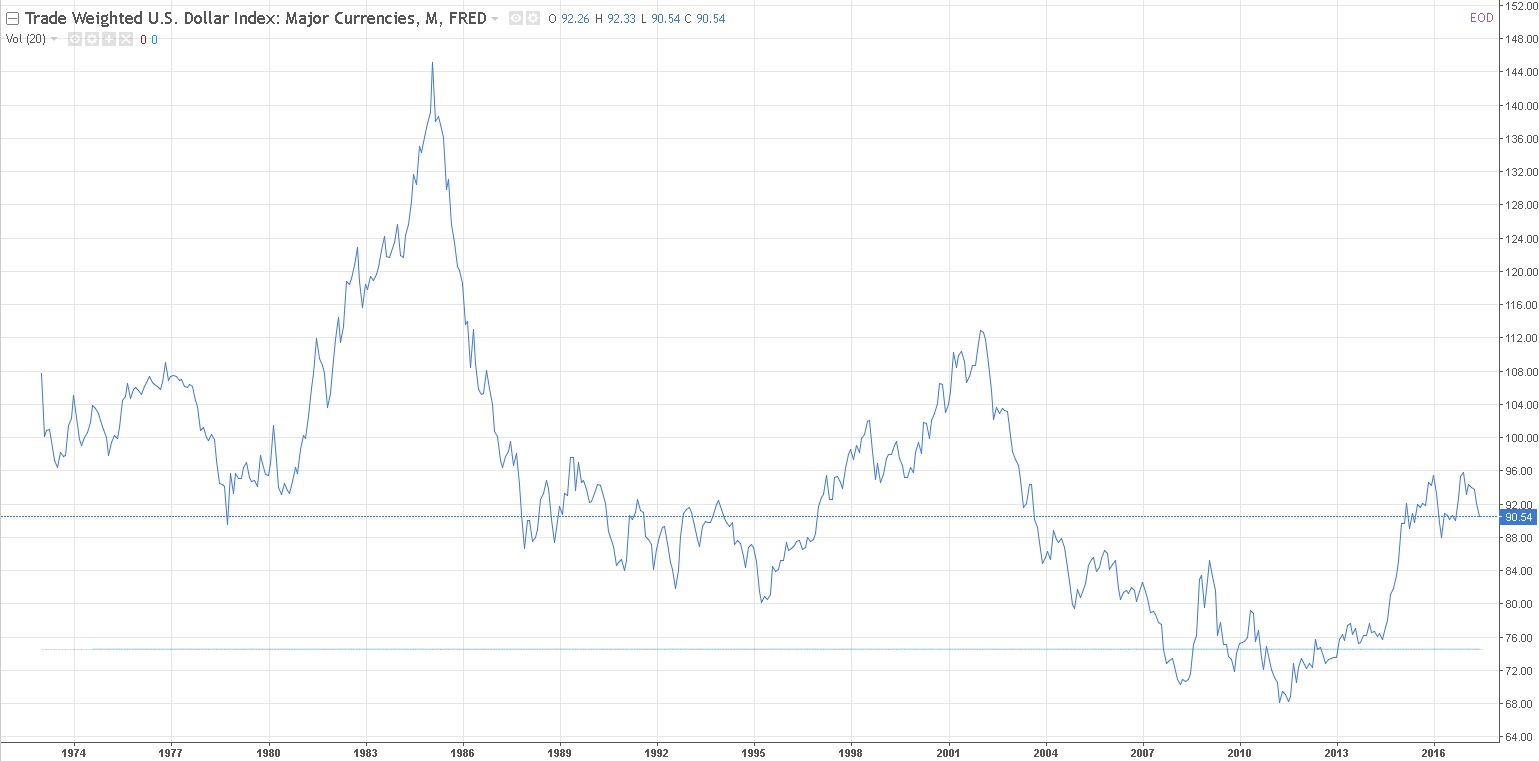 Nevertheless, on closer inspection the differences are clearly visible. The main difference between the two dollar indices is that their baskets include a different number of currencies. In the case of the Fed index, it represents many more countries, and far from all of them are industrial and financial leaders - there are quite a few developing ones. So the Fed's TWDI index is a more global reflection of the dollar's value against world currencies. At the same time, the currency weights are based on trade balance data, which is updated annually.
The Dollar Smile Theory

The dollar is a very interesting currency: it can strengthen in both bad and good economic conditions. As a result, one of the employees of Morgan Stanley once came up with a fundamental theory that makes it possible to explain this phenomenon. It was Stephen Jen, an economist and currency analyst. His theory is called the "dollar smile theory." The essence of the theory is that the U.S. dollar, in all its variety, always adheres to only three scenarios.
 The first part of the smile implies a situation where investors seek a "safe haven" for their funds held in dollars and yen. Since investors believe that the global economy is slowing down, they are in no hurry to buy risky assets and prefer to invest in less risky dollar-denominated ones, even if the U.S. economy is not showing any special success.
The second scenario is when the dollar falls sharply, updating minimum values. This is the lower part of the smile, which indicates that the U.S. economy is weak, just as its national currency is weak. In this scenario, interest rates are often reduced, which can also affect the cheapening of the dollar. As a result, the market gets rid of the dollar, and the smile becomes wider.

And thus we move on to the third scenario. The dollar is once again loved and respected thanks to economic growth in the U.S. Optimism is growing, traders begin buying dollar assets, U.S. GDP is rising, and an increase in key rates is expected.
A vivid example of this theory is the 2007 crisis. In 2008, at the very peak of the economic crisis, the dollar suddenly began to strengthen sharply - investors were fleeing the global fire into a strong currency, triggering the first scenario. Then, in March 2009, investors switched to higher-yielding currencies, and the dollar showed an impressive decline. That was the second scenario, after which the third was launched - a new rise of the dollar, which lasted until the summer of 2010, after which the cycle repeated.
This theory is only a particular example of how the economies of any countries have a cyclical nature. And now it is time for us to discuss the specific application of the dollar index in trading.
Historical Data and Forecasts

Since the start of 2017, the dollar index has fallen from 103.26 points to 95.72 points, a drop of 7.54 points.
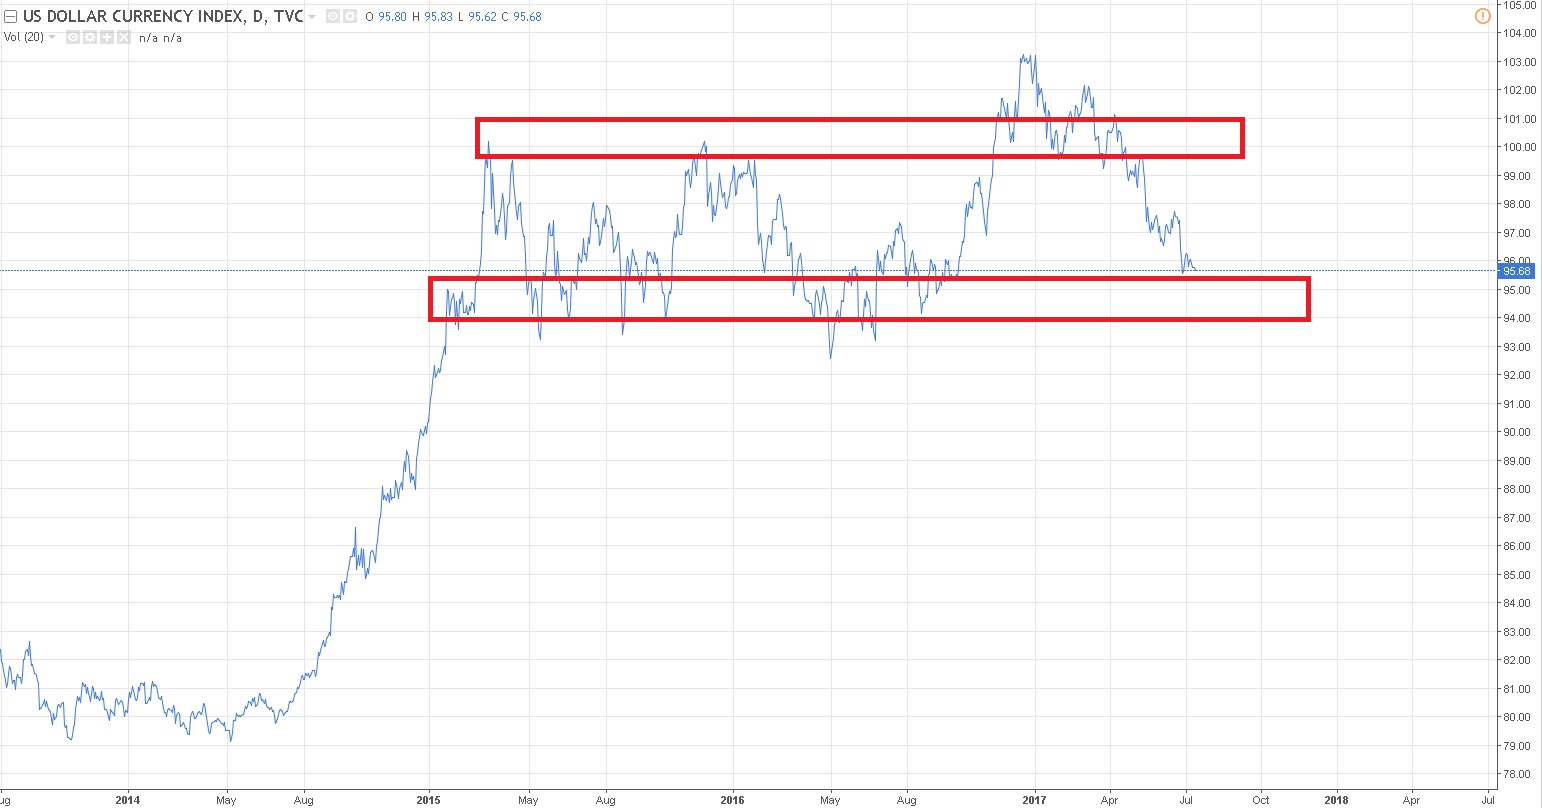 As can be seen on the D1 chart of the DXY index, it is now at the lower boundary of the channel it has been in since 2015. At the same time, at the beginning of 2017 an upward breakout of the channel was attempted, but it was unsuccessful. I assume that further behavior will be approximately as follows:
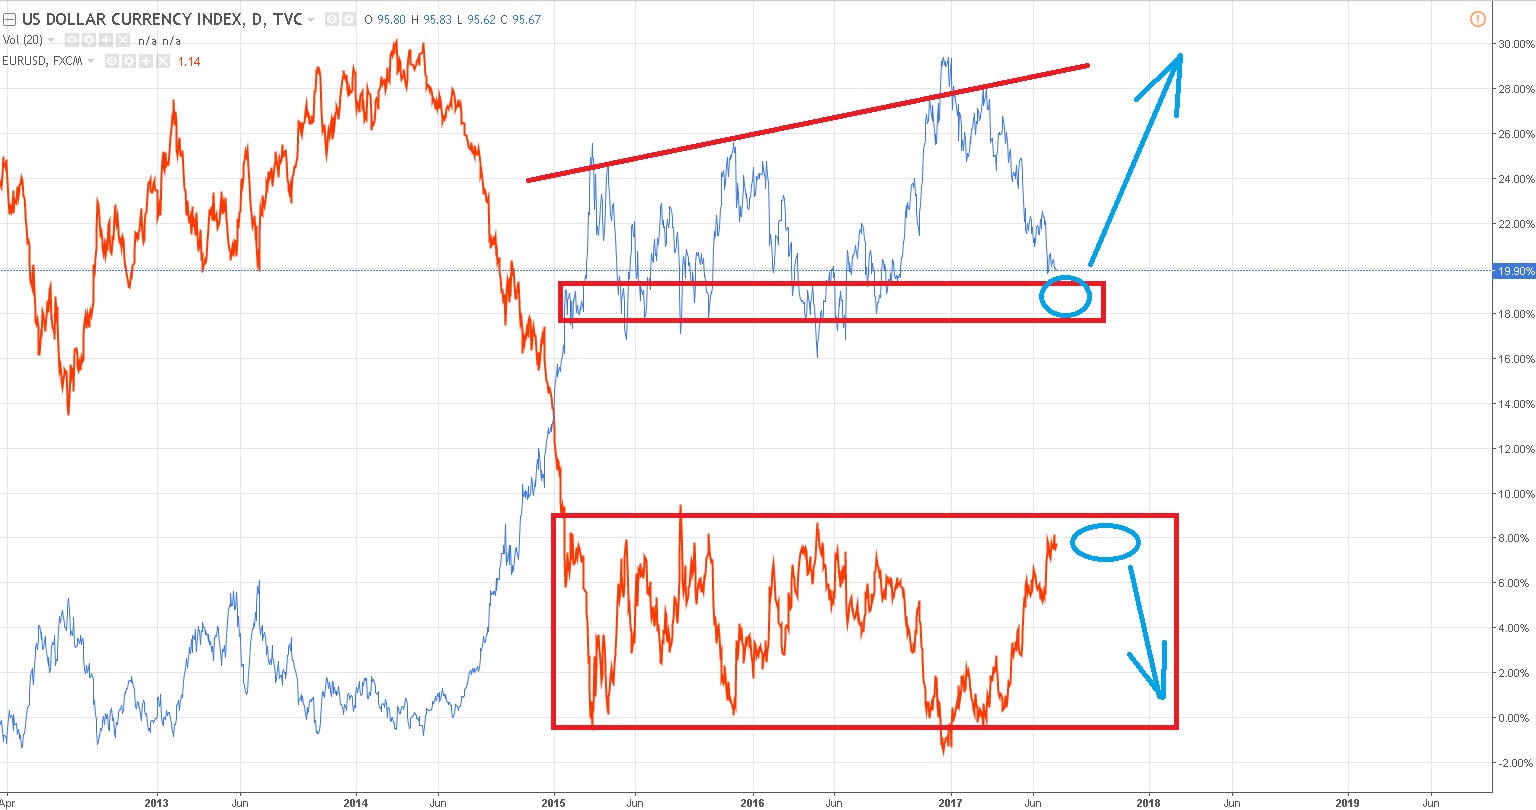 Apparently, quite soon we can expect the dollar to strengthen at least to the upper boundary of the channel, and possibly to break through it. Unless, of course, the lower boundary is broken. In any case, we are very close to a key point, the passage of which will serve as an excellent clue for further actions.
That rapid growth of the index, which traces its beginning back to the middle of 2014, has clearly taken a long-term pause, but a new serious trend is only a matter of time. And at the present moment, when we are located right at the key point, this question becomes very relevant, because it is precisely in the coming months, weeks, and perhaps even days, that one can catch quite accurately the moment when this very long-term trend is born.
But, of course, serious long-term traders never rely on technical analysis alone. It serves only as the trigger for making a trade - it is important to pull it at the right moment. Nevertheless, the direction in which to shoot is most often determined precisely by fundamental analysis. And a number of fundamental prerequisites also speak in favor of my forecast:
- First, it is the begun cycle of Fed rate hikes in the U.S. against the prolonged soft monetary policies of the ECB and the Bank of Japan;
- Second, it is the potential negative effect (for the pound) from the United Kingdom's exit from the European Union.
Previously, a strong dollar had a negative effect on commodity assets, so the resumption of a negative impact on oil or, for example, copper quotes - with the growth of the U.S. dollar - should not be ruled out. The intrigue of the year can be called the dynamics of U.S. Treasury bonds: whether the decline in the papers will continue or not.
Now that we have identified the main macroeconomic drivers confirming our forecast, for the sake of completeness let us also look at the monthly chart of the index:
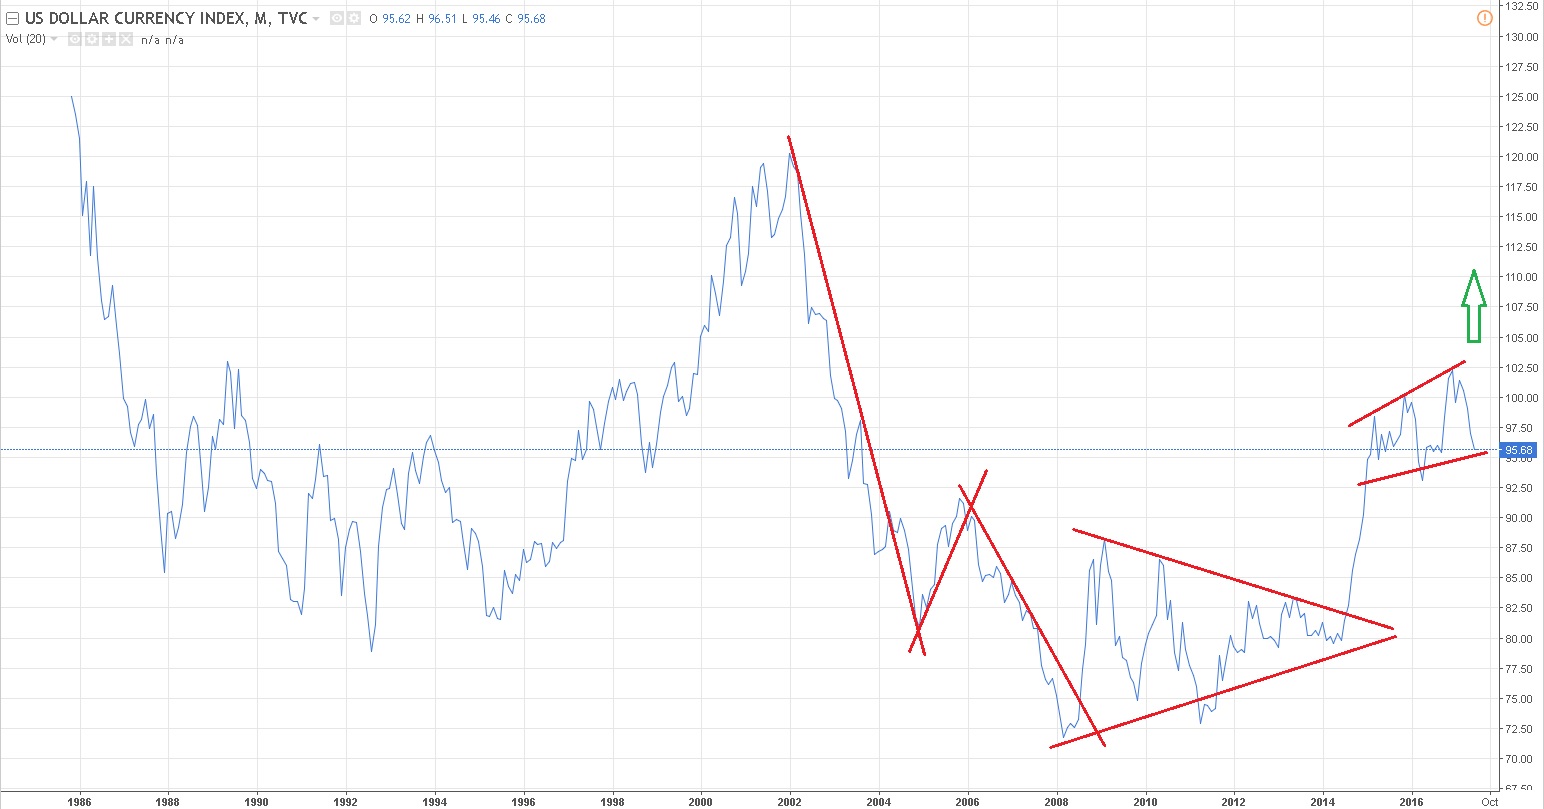 In my view, the downtrend that lasted since 2002 ended after an upward breakout of the triangle in the second half of 2014. From that moment, we observed a strong uptrend, which was replaced by a sideways consolidation range, upon a breakout of the upper boundary of which the uptrend will most likely continue.
Application in Trading

It is difficult to say why JP Morgan created this index and why it became so popular. A very strange thing is that this index cannot be traded. There is no market on which you could buy the dollar index. The only instruments that take DXY movement into account are futures and options on this index, which are traded on the InterContinental Exchange.
It is not difficult to open the dollar index chart. Most often in a trading terminal it is designated as DXY or as USDX. As was said above, you can see index updates on the same schedule as currency rate updates, that is, 24 hours a day from Monday to Friday.
The dollar index can be used to analyze currency pairs of the forex market, just as stock market investors use stock indices as a base contract to determine the overall direction of the trend in the market. If you trade currency pairs whose quotes include the USD currency, then the dollar index will give an idea of the relative strength of the dollar regarding currency pairs such as EURUSD, GBPUSD, USDCHF, and so on, and in case of uncertainty in the forecast it will give a clearer picture of the market. One can safely say that USDX has a correlation with the above-mentioned currency pairs, and a trader can use this indicator as an additional indicator when analyzing the market. In the figure below, using the tradingview service, I displayed the correlation between the dollar index and the main currency pairs included in the index.
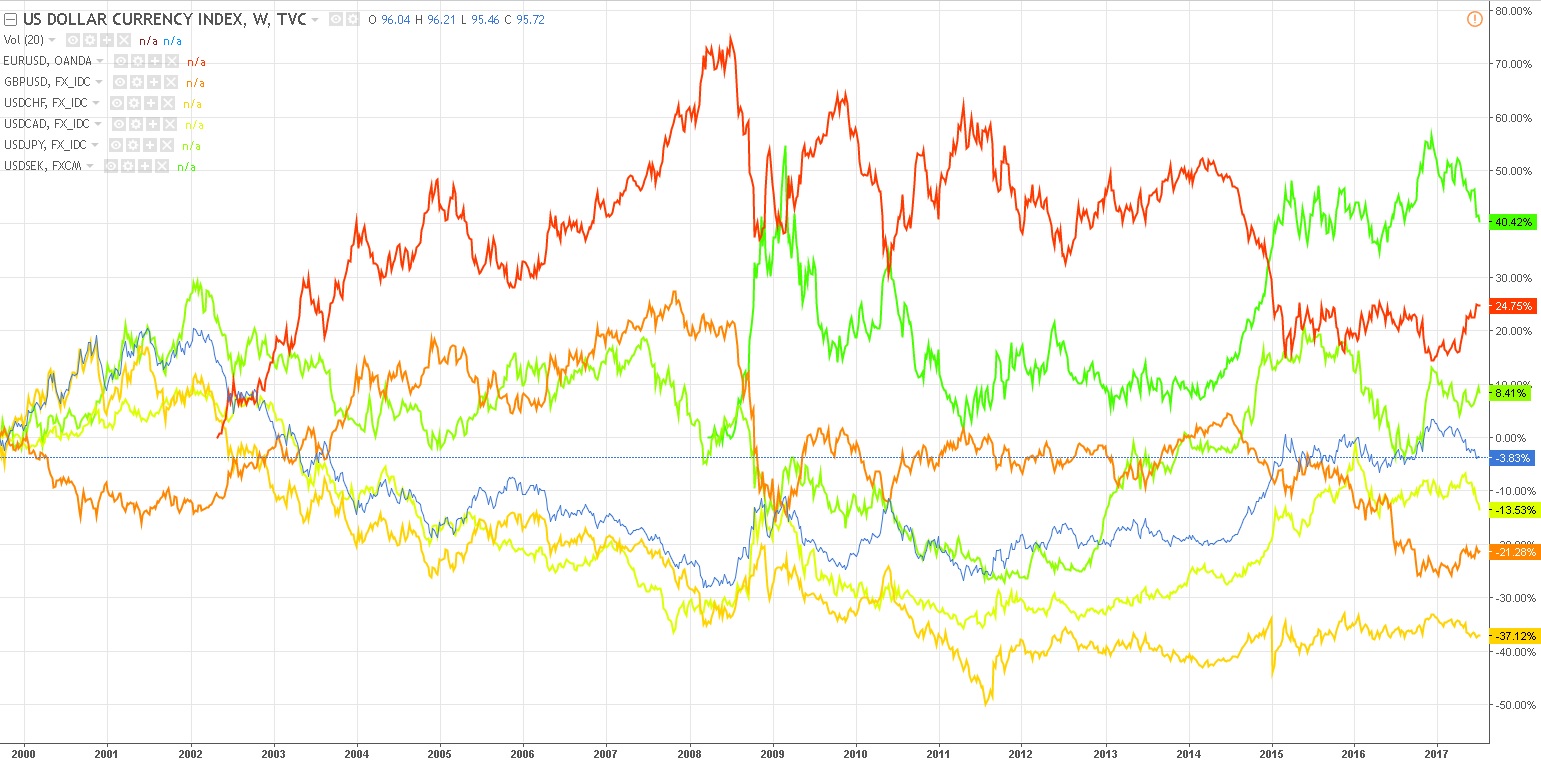 As can be seen from the chart, the correlation is indeed quite high.
You can watch the dollar index in a separate terminal window or in a browser on the site, but for convenience an indicator was created that shows the USDX chart under the selected currency pair chart. You can find/download this indicator at the end of the article.
Many constantly monitor DXY not only for coincidence with the same EURUSD, but also for divergence from it, since such a divergence can be considered a divergence.
If DXY shows increased volatility, it will be reflected in the other currencies of the index; a breakout of a support/resistance level on one chart corresponds to a breakout on the others.

Do not forget where exactly the dollar is located in your currency pair; it can be either the base or the quoted currency.
If DXY strengthens and moves upward (which means the dollar is strengthening), then the EURUSD chart will move downward. Conversely, for the USDCHF pair, a strengthening dollar means the chart moves upward. If the dollar is the base currency (the first in the currency pair), then the dollar index and the currency pair will move in the same direction. If the dollar is the quoted currency, then the index and the currency chart will move in different directions. Quite often, movement in the index anticipates movement in the major currency pairs. To test this hypothesis, I wrote a small auxiliary bot that is based precisely on this pattern. If, for example, the candle on the index is bearish, then on the EURUSD pair it should be bullish. If this is not the case, then we have a divergence and we will open a buy on EURUSD. We will close the position in two days. We will also use the simplest trailing stop and will not forget to set stop loss and take profit levels. Let us see what came out of this idea.
The EURUSD pair showed an excellent result until 2012, but at the moment such a strategy brings losses:
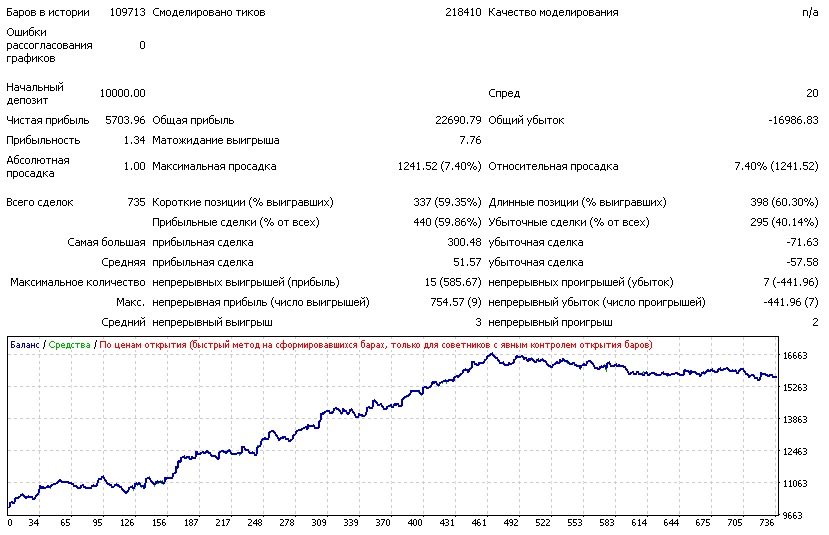 Perhaps the basic strategy needs to be modified, with new rules introduced to achieve a better result. Nevertheless, for a full six years, from 2006 to 2012, the strategy produced very good results, so I think not all is lost and, with proper study, it is still possible to profit from it.
USDCHF performs worse, but we still have profit:
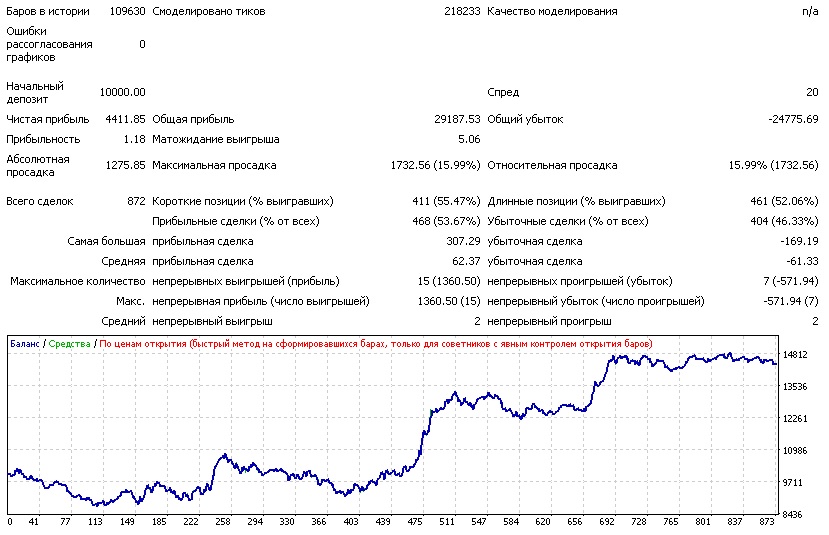 GBPUSD also behaves quite well:
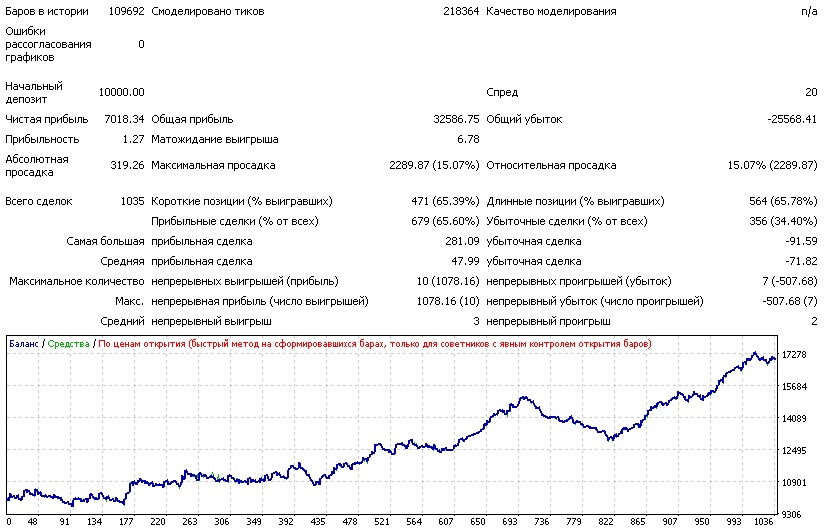 But USDCAD is not very suitable for such a strategy:
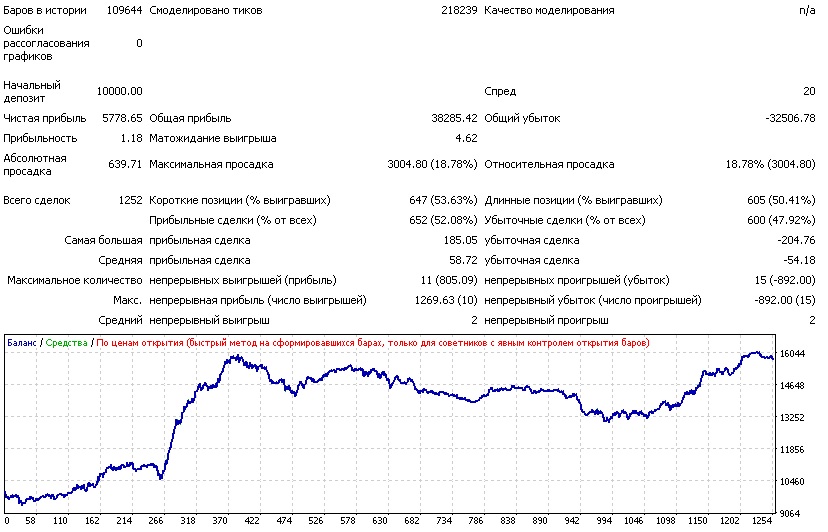 USDJPY also produces a fairly decent chart:
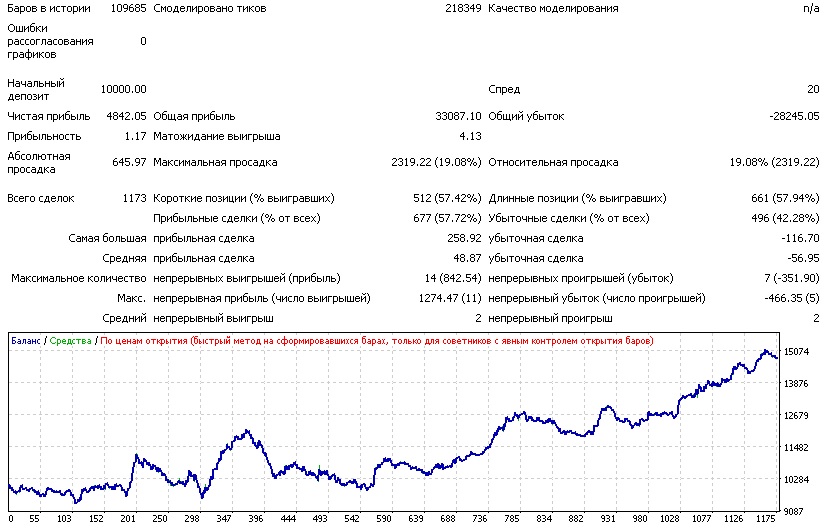 For the AUDUSD pair, the profit is not great, but it is stable:
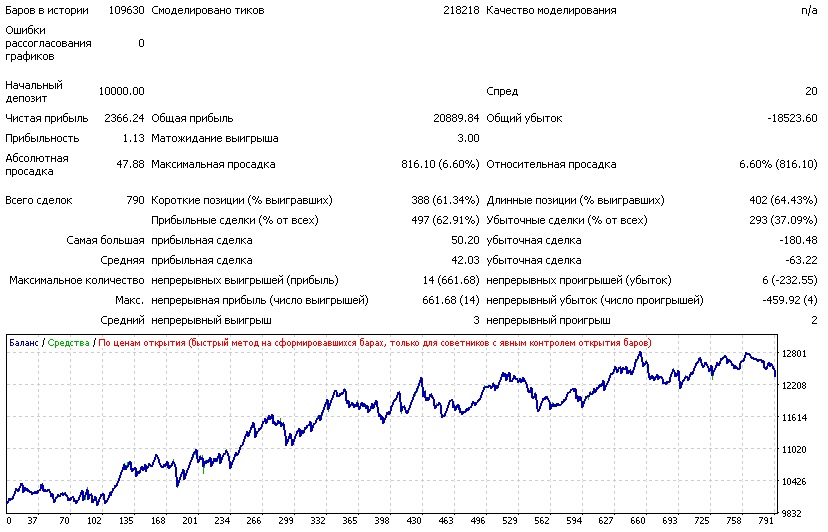 And if you trade all these pairs together, it turns out not so bad:
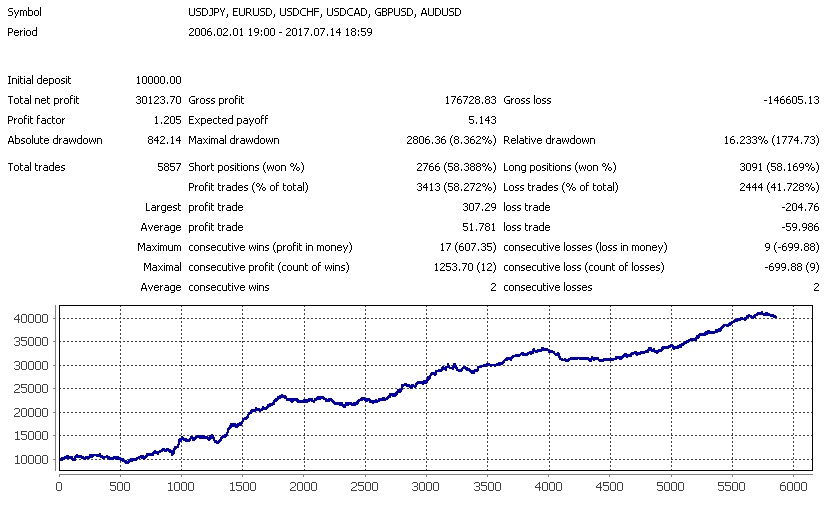 And with the application of money management with 3% risk per trade:
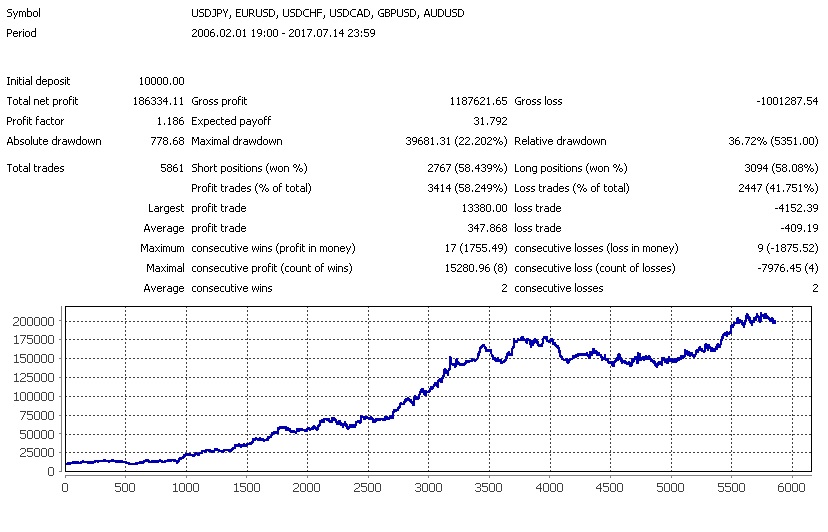 In principle, with some refinement, it is quite possible to work with such a strategy.
By the way, the dollar index also correlates excellently with oil prices:
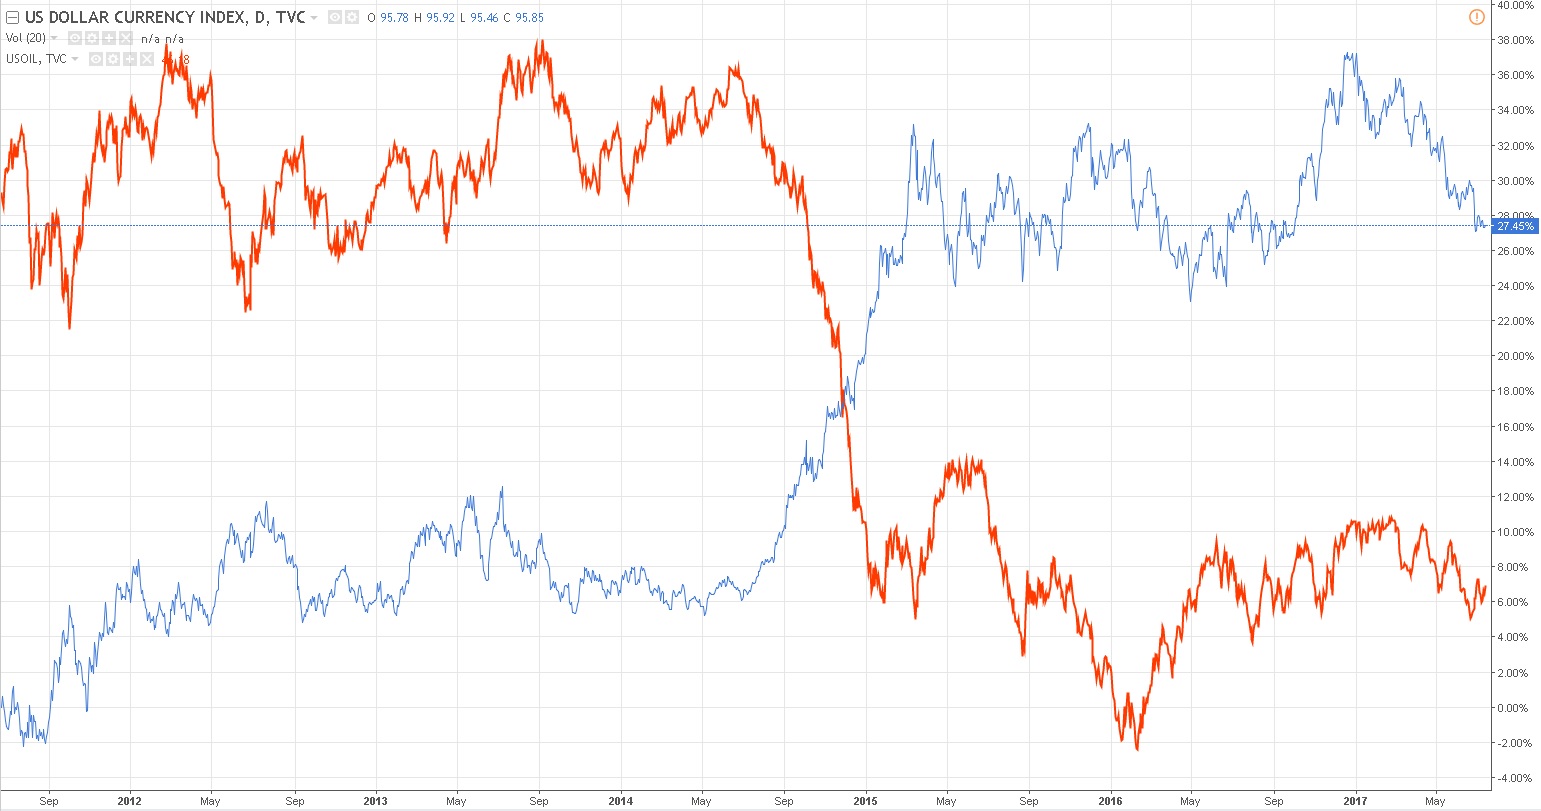 This is related to the fact that the largest consumers of oil are hedgers against dollar inflation. Hence the inverse correlation of these instruments.
Since the dollar index reflects the value of a basket of currencies relative to the dollar, it gives a clearer idea of the strength or weakness of the dollar than when you look at a single currency pair like EURUSD. Many experienced traders turn to the U.S. dollar index before trading a currency pair with the dollar, and to avoid trading against the trend of the index.
Conclusion

The dollar index is a macroeconomic indicator. It is used to assess the global state of the American currency on higher timeframes. It is used either as a supplement to fundamental analysis or to search for discrepancies between the index and EURUSD on D1 and above. By studying inflation and U.S. economic indicators, the index will allow you to add another variable to the equation and will make it possible to assess the global prospects of the American currency. That is why it is a frequent guest on the screens of professional currency traders and analysts.
The dollar index is affected by general factors that influence currencies, such as fiscal and monetary factors, interest rates, inflation, and foreign trade. That is why analysis of the dollar index can serve as an excellent foundation for the development of your own long-term trading strategy.
Download the U.S. Dollar Index Indicator
 With respect, Dmitry aka Silentspec
TradeLikeaPro.ru
With respect, Dmitry aka Silentspec
TradeLikeaPro.ru