
How to Use Horizontal Volumes in Forex

Hello, ladies and gentlemen of Forex trading! After a short break, we continue the topic of using volumes in trading.
And today we will talk about the so-called Horizontal Volumes, which help us understand which price levels are most interesting to large players. This is an auxiliary tool that can be combined with many strategies.
Market Profile, or your pointer if you are lost

The idea of the market profile dates back to 1980. It was developed by Peter Steidlmayer together with the Chicago Mercantile Exchange.
Traders who use the market profile can gain a deeper understanding of the market, which in turn leads to a more detailed understanding of price movements in the market, both in a specific period and in general as a whole.
So, what is a market profile? It is a value area that represents a zone of some equilibrium, where there is an equal number of buyers and sellers.
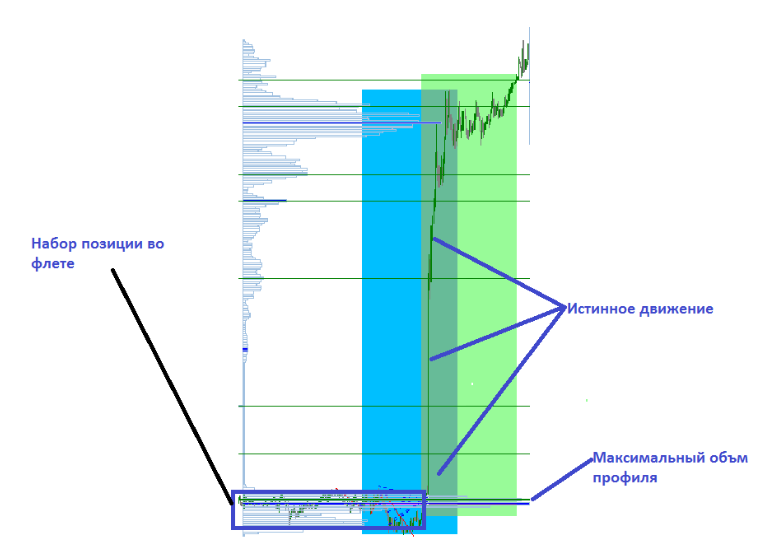
The normal distribution curve shows us that price changes in the market occur in the form of a bell-shaped line. And, in turn, the position of price relative to this curve is the information we need. In simple terms, the market profile is the horizontal volumes traded at each price, and the size of the line shows us what volume was traded at that price. That is, price starts some kind of movement, but for its movement it needs fuel, and that fuel is mainly ordinary traders (the so-called "crowd"), you and me, and small organizations with little capital. A large player must accumulate a position, and therefore will move the price through a certain level in order to build a position there, because they cannot instantly press the "Buy" button and get a position of a thousand lots. There simply will not be enough liquidity, and the purchase will stretch across a wide price range, which in the end will lead to the fact that they earn nothing. Therefore, the positions of such players are usually accumulated in a flat market (when price moves within a certain price range and does not leave it). Both buyers and sellers are lured there. And after the required volume is accumulated, the true movement occurs.
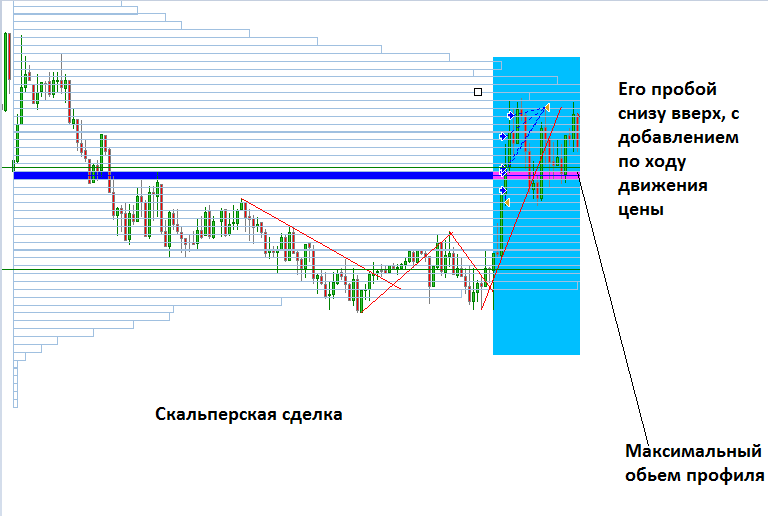
In the picture it looks approximately like this:
One more example:
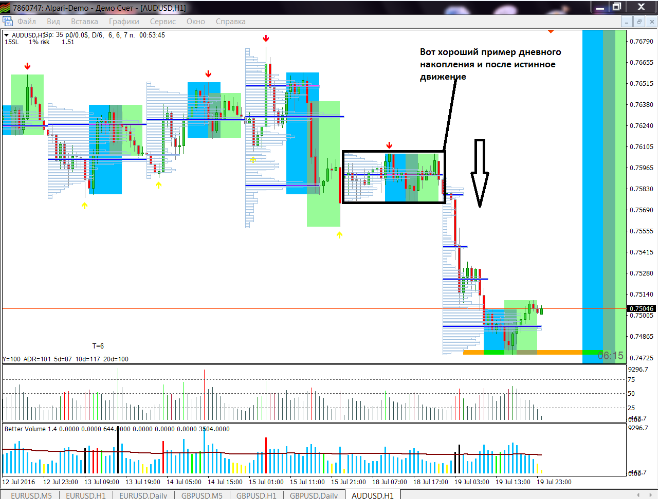
As we can see, the maximum volume is marked by the indicator (you can download it at the end of the post), and volumes that are smaller than the main one are also marked, but they are still large for this range.
Differences Between Horizontal Volumes and the TPO Market Profile
The market profile is very similar to the TPO profile, but they carry different meanings. If Volume Profile is the gradation of volumes at each price, then TPO (time, price, opportunities), in simple terms, is the place where price spent the most time. On an exchange terminal, it looks like this:
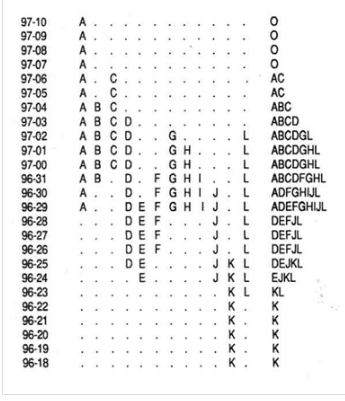
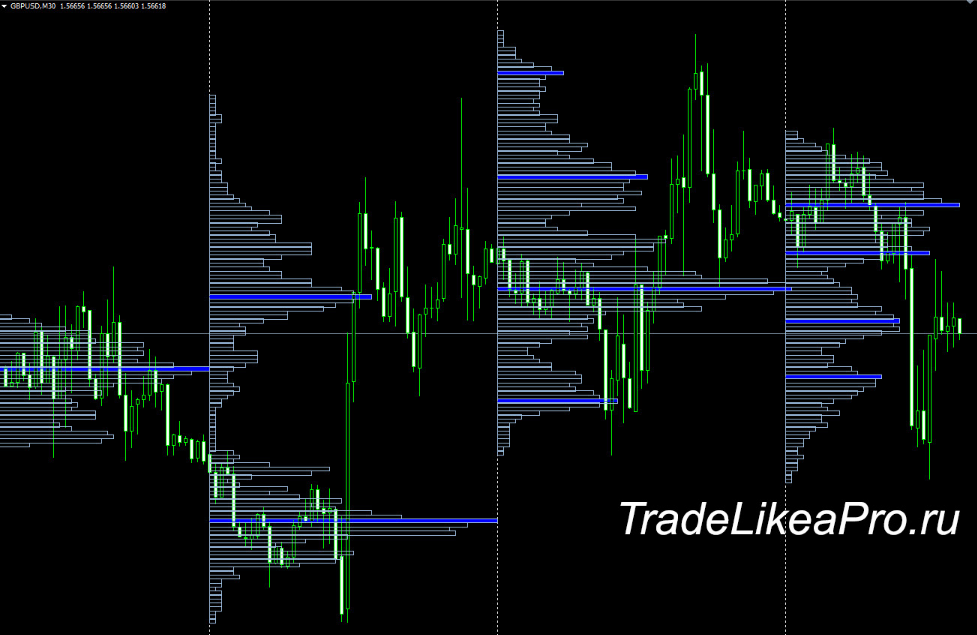
Every 30 minutes in this profile is marked with a new letter. If some price range was traded during that half hour, it is marked with the corresponding letter, and this letter is placed on the chart at the level of that price range. Where the price stayed the longest, there will be the most letters. Based on this, we can determine the price range that was most interesting to market participants, that is, where 70% of the daily volume was traded. And the application is the same as with the market profile: whichever direction price exits the accumulation, that is the direction in which we consider trades. In MT4 it looks almost the same as the market profile:
Practical Application

How can this knowledge be useful to us? Simply put: whichever direction the breakout from the profile occurs in, that is the direction in which a position should be opened. But as we all know, there is no Holy Grail, so the market profile should be used as a directional filter for entries. In the example, it looks like this: if price is above the profile and you are considering a scalping trade, you need to look for buys. If it is below it, then accordingly, sells.
In the daily profile there is such a concept as POC - point of control. This is the absolute maximum daily volume traded at a certain price. (Screenshot of the 6E euro futures in the SB_Pro terminal)
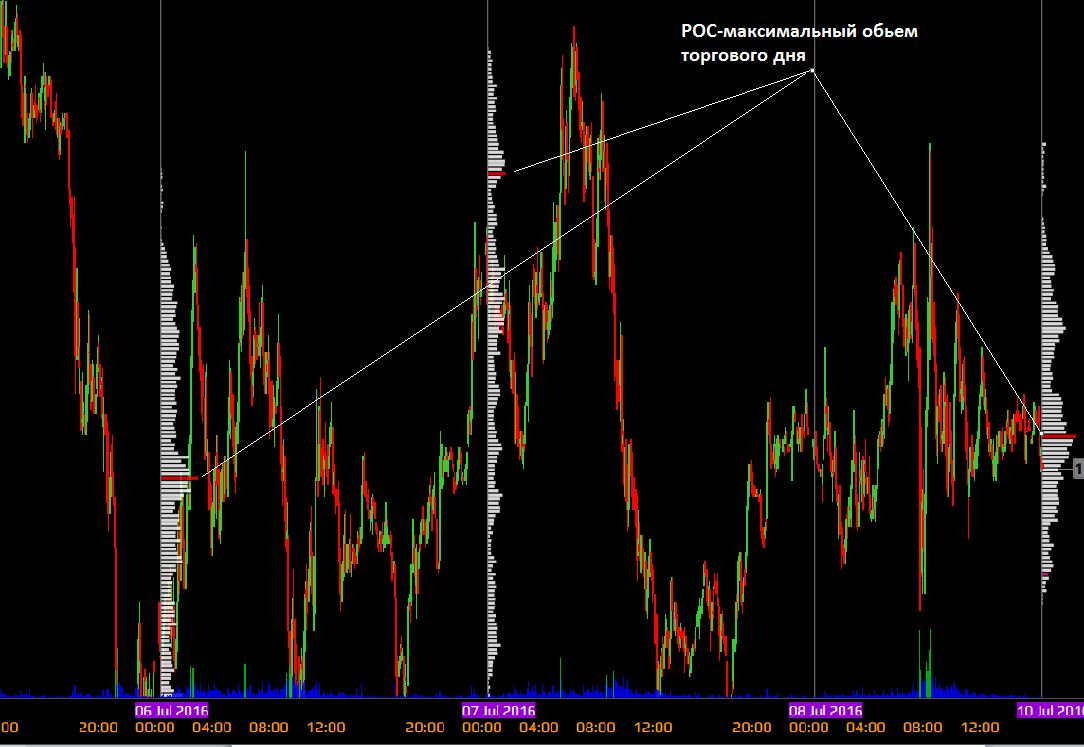
What is good about the profile for scalpers and intraday traders? You trade every day, and every day, except for force majeure, you try to close the position. Therefore, each new day begins for you with a clean slate. In view of this, the algorithm of your actions is as follows: you look at the maximum volume of yesterday's day and look at the price reaction to it. If the price moved down from it, then we mentally keep sales in mind and look at the formation of today's profile. As well as at today's price reaction from it. If the price formed a new profile and exited it downward, we continue selling. If upward, we buy, but not beyond yesterday's maximum profile volume.
Where can you get the profile? For MT4, a set of volume and profile indicators is here.
You can also look at the futures profile. It can be viewed
NinjaTrader 7 (free) http://ninjatrader.com/ru/FreeLiveData
SB_Pro (free) http://www.sb-professional.com/#!blank-2/qsrk2 recently quotes started coming with a 20-minute delay.
as well as cluster delta on the website http://clusterdelta.com/volume#getvolume
What should you do if you are not a scalper, but want, so to speak, to load up for at least a week? You take a larger time period and form a profile on the chart for each day, and on the side - the overall accumulation for at least two or three days. Next you look at where the price is now in relation to the overall accumulation. After that you make a decision about entering a trade. It will not be possible to trade a very large long-term horizon. Because within a half-year movement there may be accumulations for both buy and sell and their distribution in that same movement.
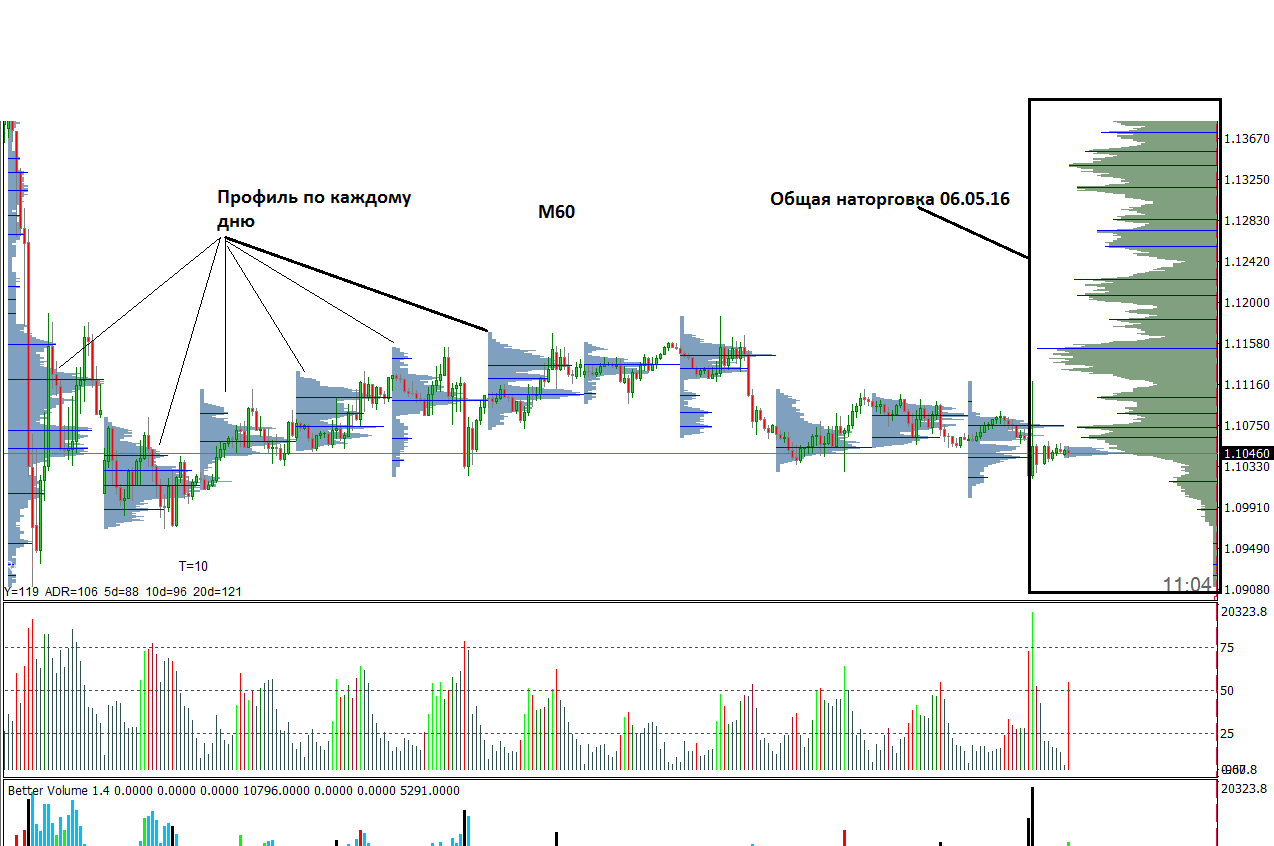
A trend is not always present in the market, and according to textbook truths 70% of the market is in a flat, and here the market profile comes to our aid. With it we can trade both the trend and the flat.
Examples for Flat trading:
We determine the boundaries of the volume micro-channel and trade its boundaries. The advantage of this type of trading is that there will be a very short stop, which will provide a good risk/reward ratio.
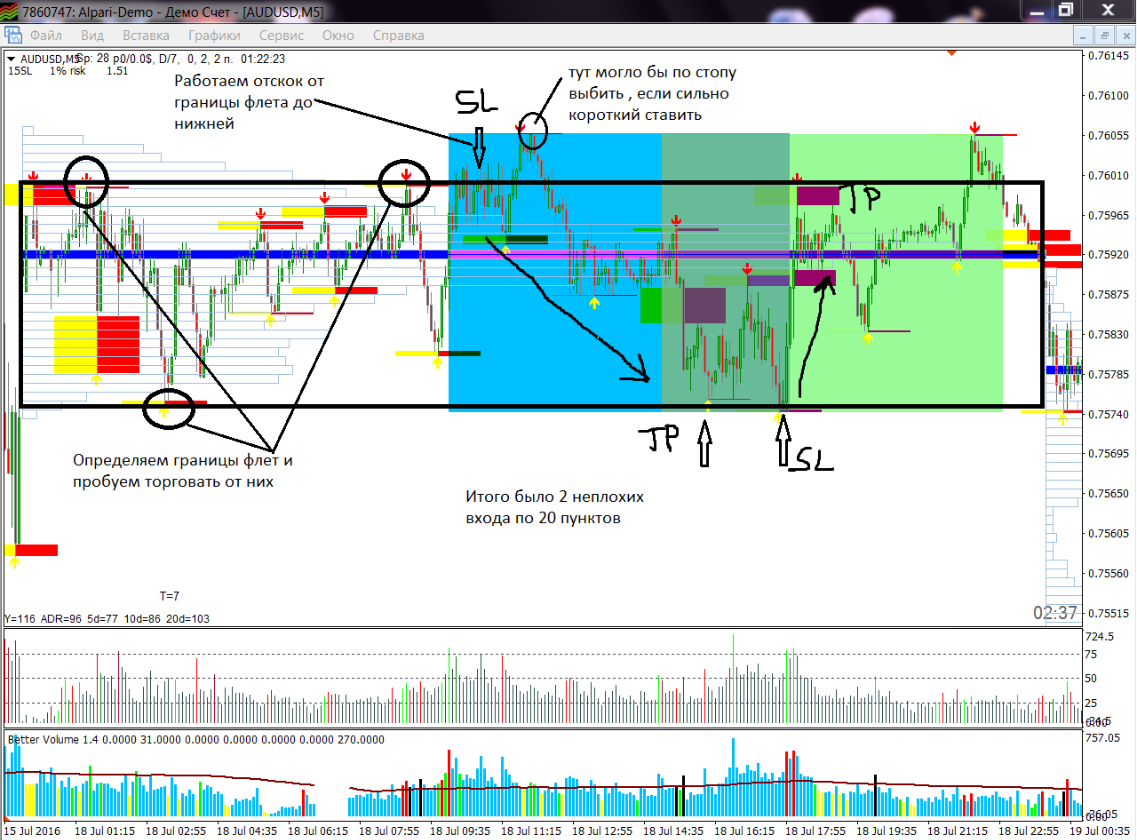
Exit from the flat:
We determine the boundaries of the volume micro-channel, as soon as the price exits it, on confirmation of the exit we enter a trade. There are pluses here-you can catch a good trending movement of 90 points in one day (as in the screenshot)
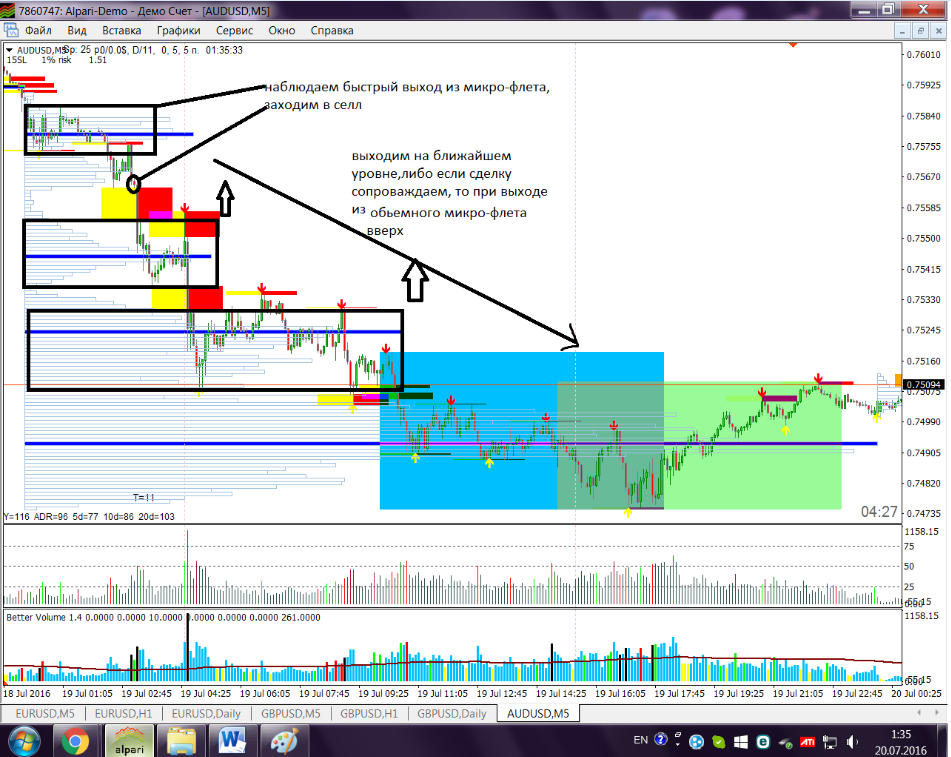
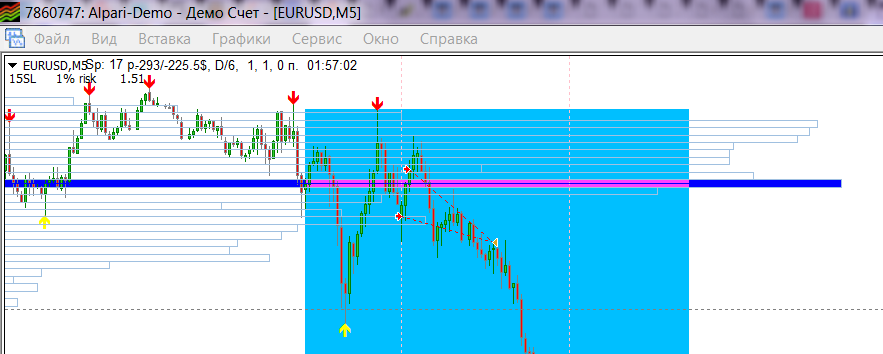
Euro scalper exit from the profile, M5 chart:
Conclusion

Horizontal volumes can serve as quite a good aid in determining the main movement of the day. However, one should not forget that this is not a separate strategy, but an auxiliary tool.
Download volume indicators for MT4
Respectfully, Alexander Volkov
TLAP.io