
How to Use Fibonacci Clusters in Forex
 Good afternoon, friends!
Far from everyone considers tools based on the Fibonacci sequence applicable to trading in financial markets. Perhaps such an extreme is caused by the actions of traders from the opposite camp, who are obsessed with Fibonacci and use them in trading thoughtlessly. As a result, two opinions are formed: either I do not recognize the Fibonacci sequence as a phenomenon at all, or I limit myself to Fibonacci grids alone and nothing else.
Today we will look at a simple and effective way to use Fibonacci levels that does not require ambiguous interpretations. Thanks to its simplicity, even a beginner will be able to fully master this method. We will talk about Fibonacci clusters, what they are, and how to use them in trading.
Building a Cluster

So, before continuing, we will have to accept one fact. Still, from time to time, the price does bounce from some Fibonacci levels, and the frequency of such bounces from some levels is higher than from the others.
As a tool, we will use the standard Fibonacci grid (extension). For example, in a "correct", or rather harmonious, trend movement, the correction quite often ends at the 61.8% mark of the previous movement.
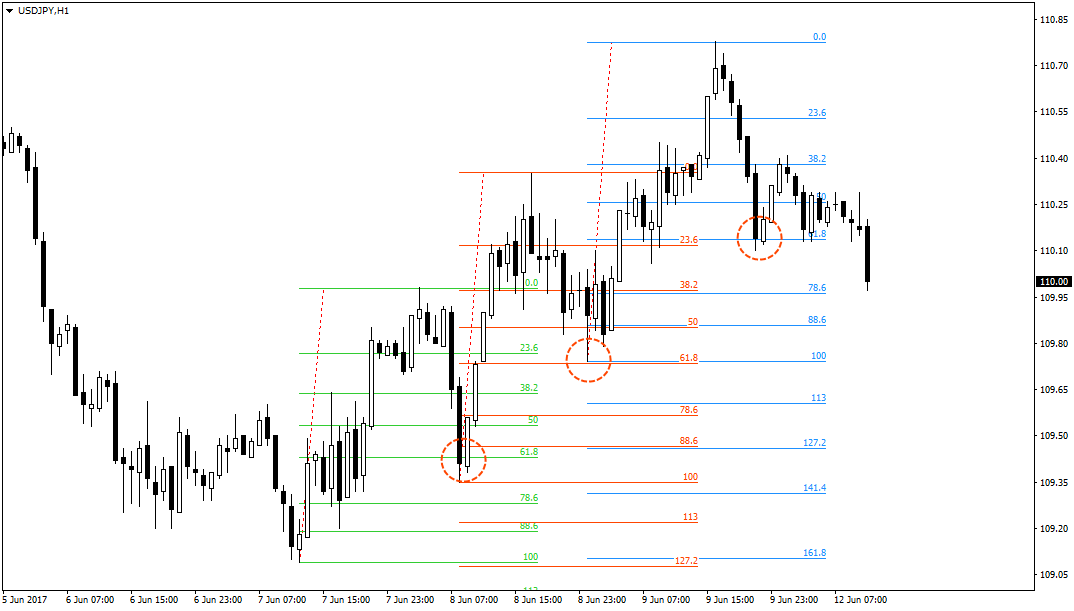 Of course, you cannot be sure that the price will bounce exactly from the 61.8% level. Often the bounce happens at 38.2%, 50%, or 78.6%. This is the main problem with Fibonacci tools: we do not know from which exact level the bounce will occur.
This is where Fibonacci clusters help us out. In essence, a cluster is a group of Fibonacci lines located at a relatively close distance from each other. By drawing Fibonacci lines relative to different market extremes, we sum up the assessment of all traders. Thus, a concentration of lines in one place will mean the most likely location of a key level or, better said, a key zone.
For a better understanding of Fibonacci clusters, it is enough to build them manually just once. So, first you need to mark all intermediate trend movements. The simplest option is to use ZigZag with a relatively large step. ZigZag with the standard parameters will do; the main thing is that the indicator marks only the most noticeable movements.
Next, we draw the Fibonacci extension along all ZigZag legs within the visibility of one chart. You can draw more, but the price usually goes too far for that to have any significant value for the forecast.
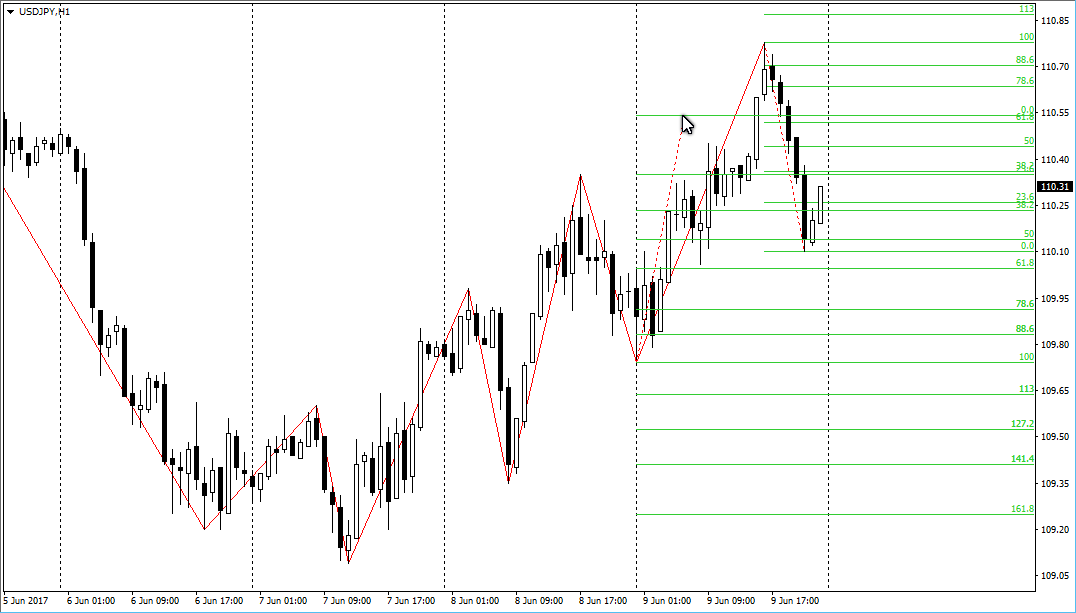 Our task comes down to identifying zones where the price can form a new extreme point, that is, bounce. As a rule, these are zones with the greatest concentration of different Fibonacci levels, here marked with a dotted line.
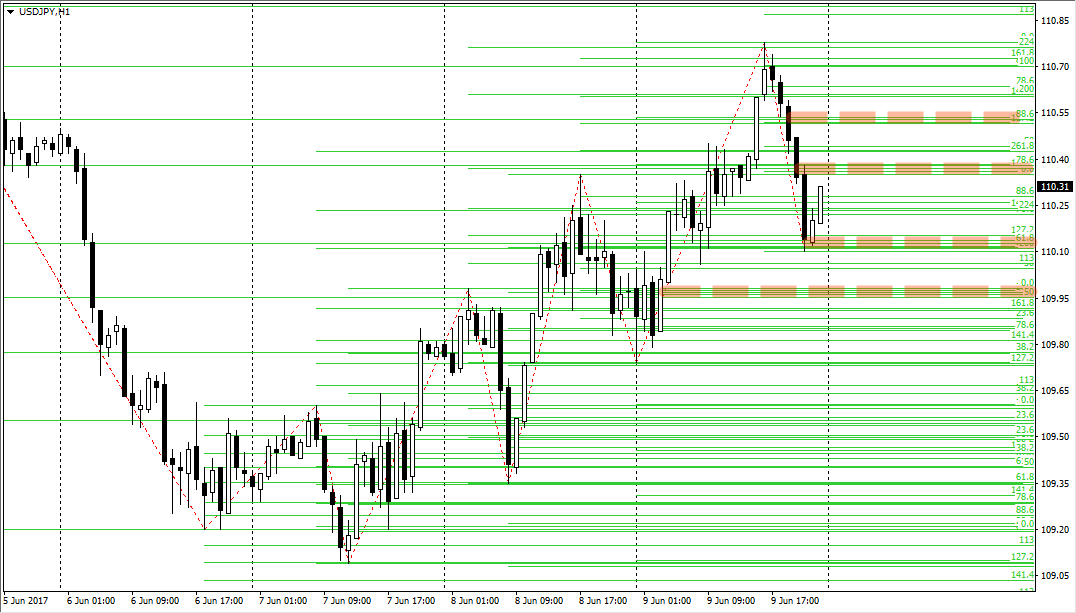 Clusters differ in degree of strength. The greater the concentration of nearby levels, the stronger the resistance or support zone. That is, in essence, everything is simple: the thicker the lines, the more likely a bounce from them is.
Auxiliary Indicator

In fact, there is no need to build anything manually; this task is handled by the FibCluster indicator, which works on a similar principle. To install it, simply move the indicator file into the indicators folder of your terminal and restart the program.
The indicator displays horizontal lines of different thickness on the chart. The thicker the line, the greater the concentration of levels within a certain zone.
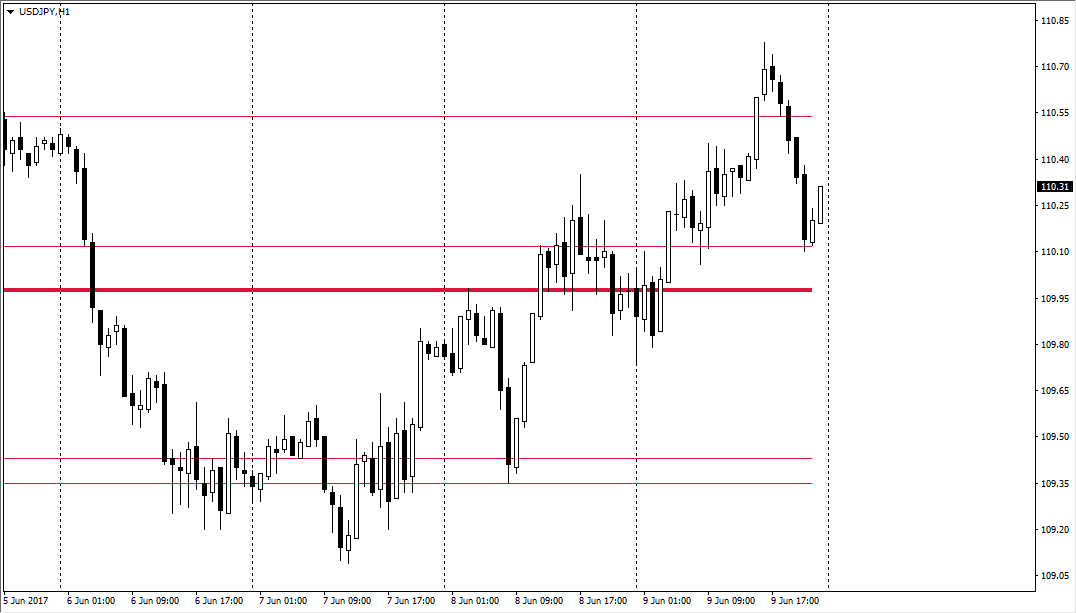 Among the settings, we have the parameters of the ATR indicator and the Factor parameter, which is a multiplier of the indicator values.
ATR, as is known, is a measure of volatility. We need to know the current volatility in order to understand which levels at what distance from each other should be considered a cluster. In other words, ATR is responsible for the cluster size, and the Factor parameter is a simple multiplier. Accordingly, the higher the multiplier value, the more clusters will be displayed on the chart.
Application in Trading

Trading levels is easiest when there is a clear one-directional movement. This way we will know where the price is most likely to head, and we will be able to enter the "flow" at the most favorable offer.
So, first we determine the direction of the main trend. In this case, an uptrend is obvious.
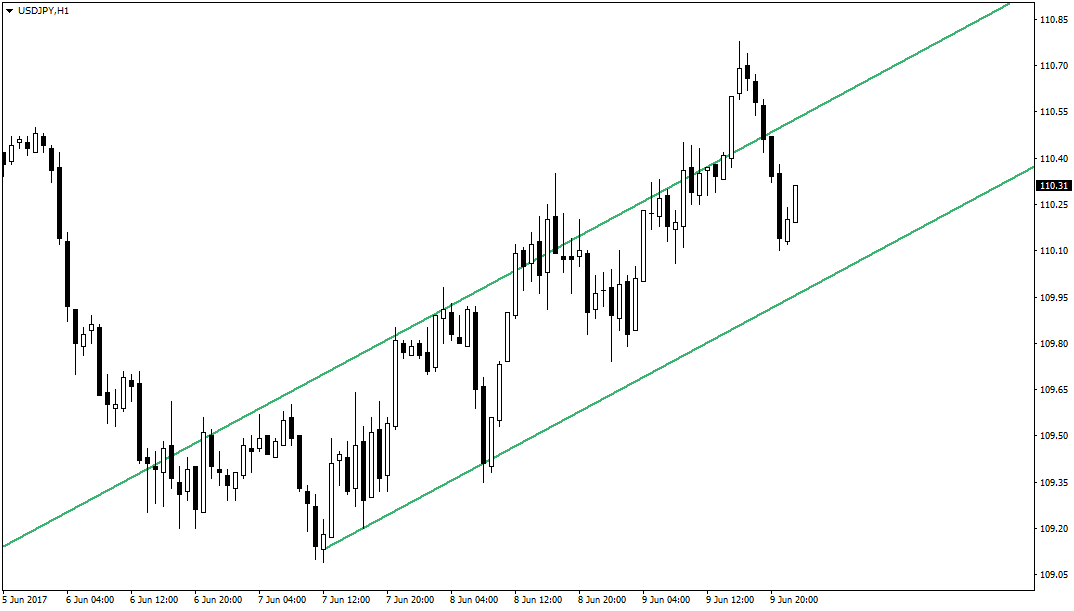 Next, we install the FibCluster indicator on the chart. Our task is to find the nearest strong support level and place a pending order to buy slightly above it. That is, we assume that the correction will end near this level and the price will then continue its upward movement.
Stop loss is placed slightly below the next Fibonacci cluster. This way we protect ourselves in case of an incorrect forecast. The take profit is set equal to the stop.
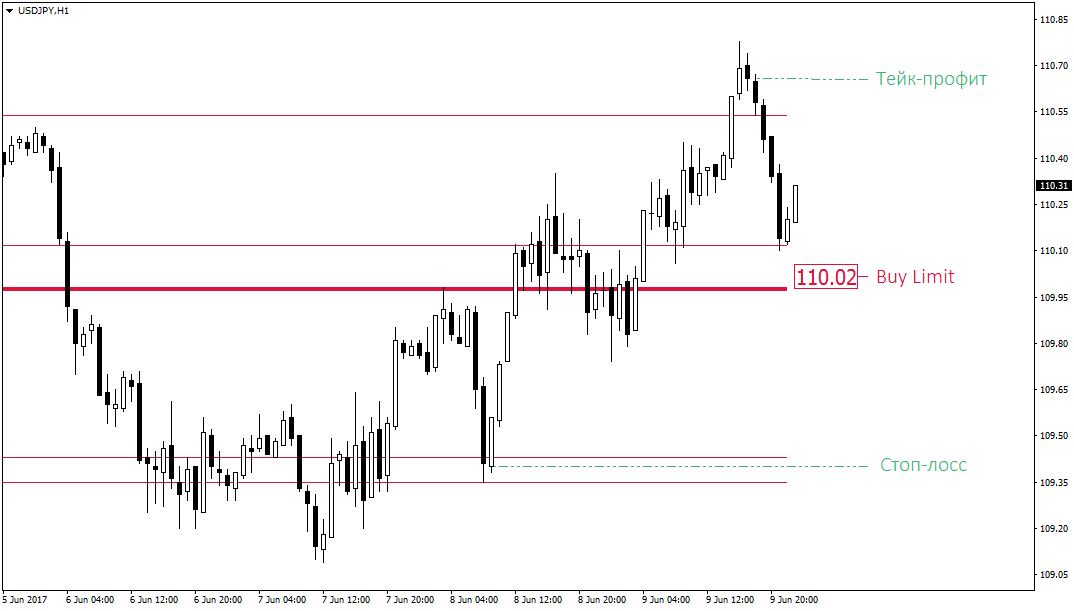 There are situations when a single supercluster forms on the chart. In that case, if the price is above the cluster zone, we place a buy order slightly above the strongest level. Stop loss is placed beyond the supercluster, after breaking which the price will almost certainly not return. The take profit equals the stop.
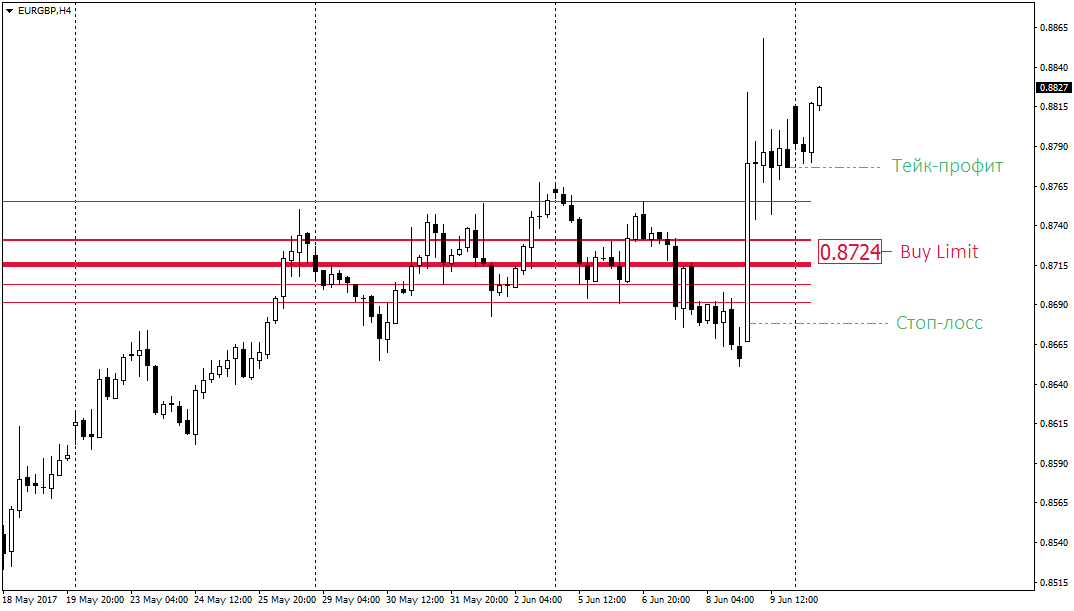 If the indicator shows clusters equal in strength, with lines of the same thickness, we simply choose the level closest to the current price for the target. In this case, the price is below the level, so we place a pending order to sell slightly below the level. We place the stop loss beyond the assumed no-return zone of the price, and the take profit equals the stop.
Conclusion

Clusters are a simple and effective way to use Fibonacci extensions in trading. The main advantage of this method is that you do not have to know at all which exact Fibonacci level the price should bounce from - the clusters speak for themselves. At the same time, clusters can mark entire resistance and support zones, zones of uncertainty within which it is better to refrain from trading.
Download the Fibonacci Clusters Indicator
 Sincerely, Alexey Vergunov
TradeLikeaPro.ru
Sincerely, Alexey Vergunov
TradeLikeaPro.ru
