
How to Use the Commodity Channel Index in Forex?
 Hello everyone!
Today we will get acquainted with another wonderful classic indicator - the Commodity Channel Index (CCI). It measures the deviation of an instrument's price from its average statistical price. High index values indicate that the price is unusually high compared to the average, while low values indicate that it is too low. In other words, CCI is, as you have probably already guessed, a classic oscillator.
The indicator was developed by Donald Lambert in the 1980s for use in commodity markets. It was originally introduced by the author in the book "Commodity Channel Index: Tools for Trading Cyclical Trends." Soon after its appearance, CCI became very popular and is now a common tool traders use to recognize cyclical trends not only in commodity markets, but also in stock and currency markets. In this article, we will look at what exactly CCI calculates and how it can be applied to improve trading efficiency.
Indicator Characteristics
Platform: any
Currency pairs: Any
Timeframe: any from H1 and above
Trading time: around the clock
Indicator type: oscillator
Recommended brokers: Alpari, Exness, RoboForex
Description of the CCI Indicator
Like most oscillators, CCI was designed to determine overbought and oversold levels. The CCI indicator does this by measuring the relationship between price and the Moving Average, or, to be more precise, the normal deviations from that Moving Average. In other words, CCI measures the deviation of an instrument's price from its average statistical price.
High index values indicate that the price is unusually high compared to the average, while low ones indicate that it is too low. This indicator looks like a line fluctuating roughly between +300 and -300. Unlike many others, this indicator has no limits, so its readings can sometimes go beyond these conventional boundaries of 300 points. In the MetaTrader4 terminal, CCI is located in a separate window below the price chart (in the so-called "basement"). The settings are simple - the period and the price used in the calculations. The purpose of the indicator is to determine the moment of a trend reversal. The oscillator line moves from 0 to +100 in a bullish trend and from 0 to -100 in a bearish trend.
Calculation

The Commodity Channel Index is similar to the measurement of mean deviation in statistics. Moreover, it is essentially standard deviation. Here is the full formula of the indicator:
It is assumed that most random CCI values fall within the range from +100% to -100%. Movements that go beyond +100 are considered non-random and create trading opportunities. If you follow my ExcelTrader course or have studied statistics on your own, then you understand perfectly well that the CCI indicator is essentially a normal distribution of standard deviations from our average price, which is represented by a simple moving average. It is just that this information is presented not as a distribution histogram, but as a line in the chart basement reflecting all specific values. At the same time, the sigma here can be taken as 100%. Then we can say that the range of +-1 sigma or +-100% will include about 68,2% of all CCI readings, from +100 to +200 or from -100 to -200 - 27,2%, in the range from +200 to +300 or from -200 to -300 - 4,2%, and the probability that you will encounter a CCI value above +300 or below -300 will be 0,1% on each side. Based on this, suitable levels can be selected, but usually the values +-100 are used.
Of course, to plot CCI on a chart in the MT4 terminal, you do not have to know all of this. But for a more complete understanding of what a particular indicator actually shows, it is necessary to understand how it is calculated. I am not urging you to memorize formulas, I advise you to understand the very principle of calculation. If you understand the indicator, how it is calculated, and what parameters it takes into account, then, first, you will be able to use it more effectively by understanding its weak and strong sides, and second, you will be able to trust it more, which is also very important.
Settings

One of the preliminarily required parameters for calculating CCI is the time interval, which plays a key role in improving CCI accuracy. Since it tries to predict the cycle using Moving Averages, the more accurately the Moving Average period (for price averaging) is matched to the cycle, the more accurate the calculations will be. This is true for most oscillators. Therefore, although most traders use the default parameters for calculating CCI, a more accurate time interval reduces the number of false signals.
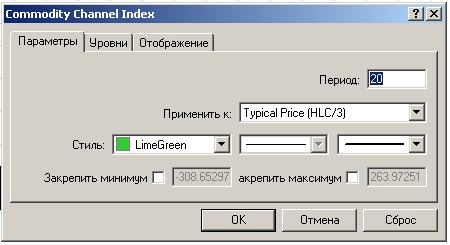 Here are four simple steps to determine the optimal interval for the calculation (for the daily scale):
- Open the instrument's daily chart;
- Determine the location of two highs or two lows on the chart;
- Take into account the time interval between those two highs or lows (the cycle length);
- Divide this time interval by three to obtain the optimal time interval for use in the calculation (1/3 of the cycle).
The timeframe for this indicator is best used no lower than H1; on smaller timeframes, the indicator gives many false signals. It works best in a sideways trend (not to be confused with a flat), while in a pronounced trend, counter-trend signals should be considered false or warning signals. Many traders say that CCI gives its best signals specifically on the EURUSD pair. I will not claim that, but if you decide to use this indicator in trading, I think it is worth starting your research with this pair. And as always, here is another banality that many people for some reason often forget: the indicator <insert absolutely any name here, in this case CCI> should by no means be used alone. I do not mean you should not trade it in a group with comrades, but that it should be used together with other signals and other indicators.
Application of the CCI Indicator

There are several basic ways to use CCI to generate an entry signal. Let us go through them.
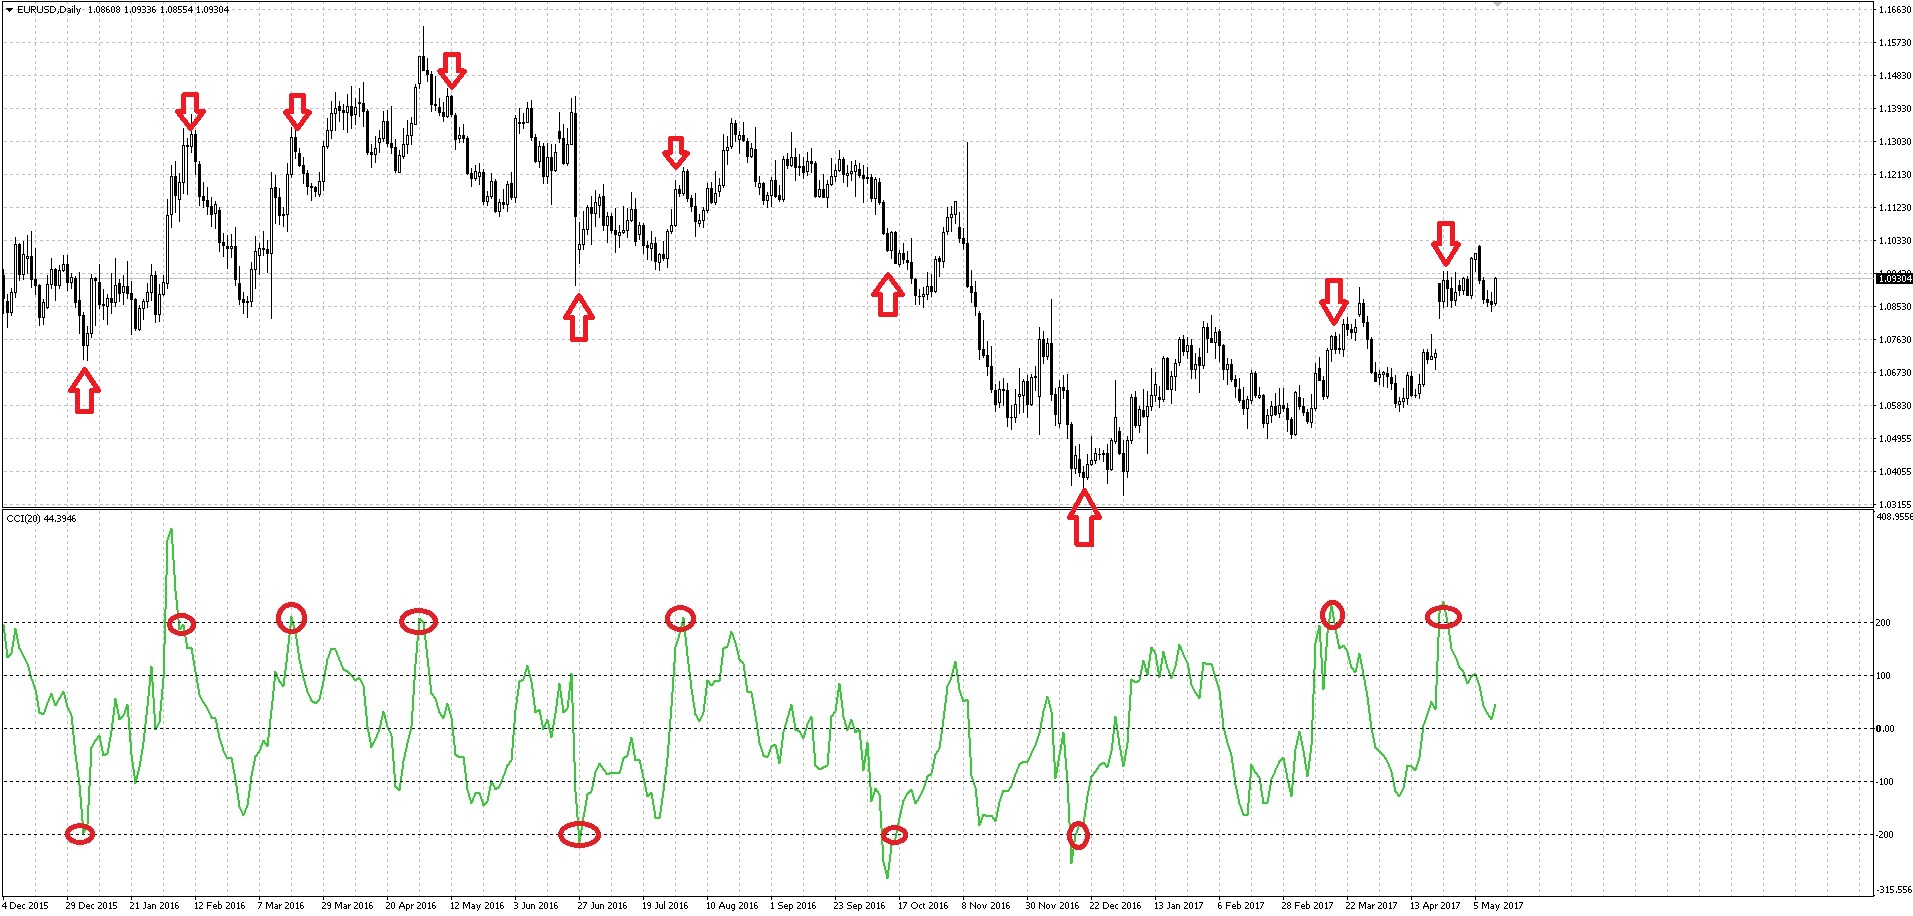
The first option is entering when the signal lines are crossed. For example, for a buy when the indicator crosses the -100 level moving from bottom to top, and for the start of selling - the crossing of +100 when moving from top to bottom.
 The second option - trading at the zero mark. In this case, when the CCI indicator crosses the zero mark moving from bottom to top, one should begin aggressive buying, and when the zero mark is crossed moving from top to bottom, one should actively sell. Thus, the trader gets a fairly early signal of the beginning of a new trend. But at the same time, it is highly desirable that the price first visited beyond the boundaries of the signal lines. That is, having received a buy signal when the price crosses the -100 level from bottom to top, we wait for the crossing of level 0 and only after that enter a buy. Or, for example, we try to catch the reversal of a new trend by entering the market when the -100 level is crossed with a reduced lot and a short stop. After receiving a series of small losses, we finally catch the trend and add on (increase the position) when the zero line is crossed, receiving additional confirmation of our correctness from this event.
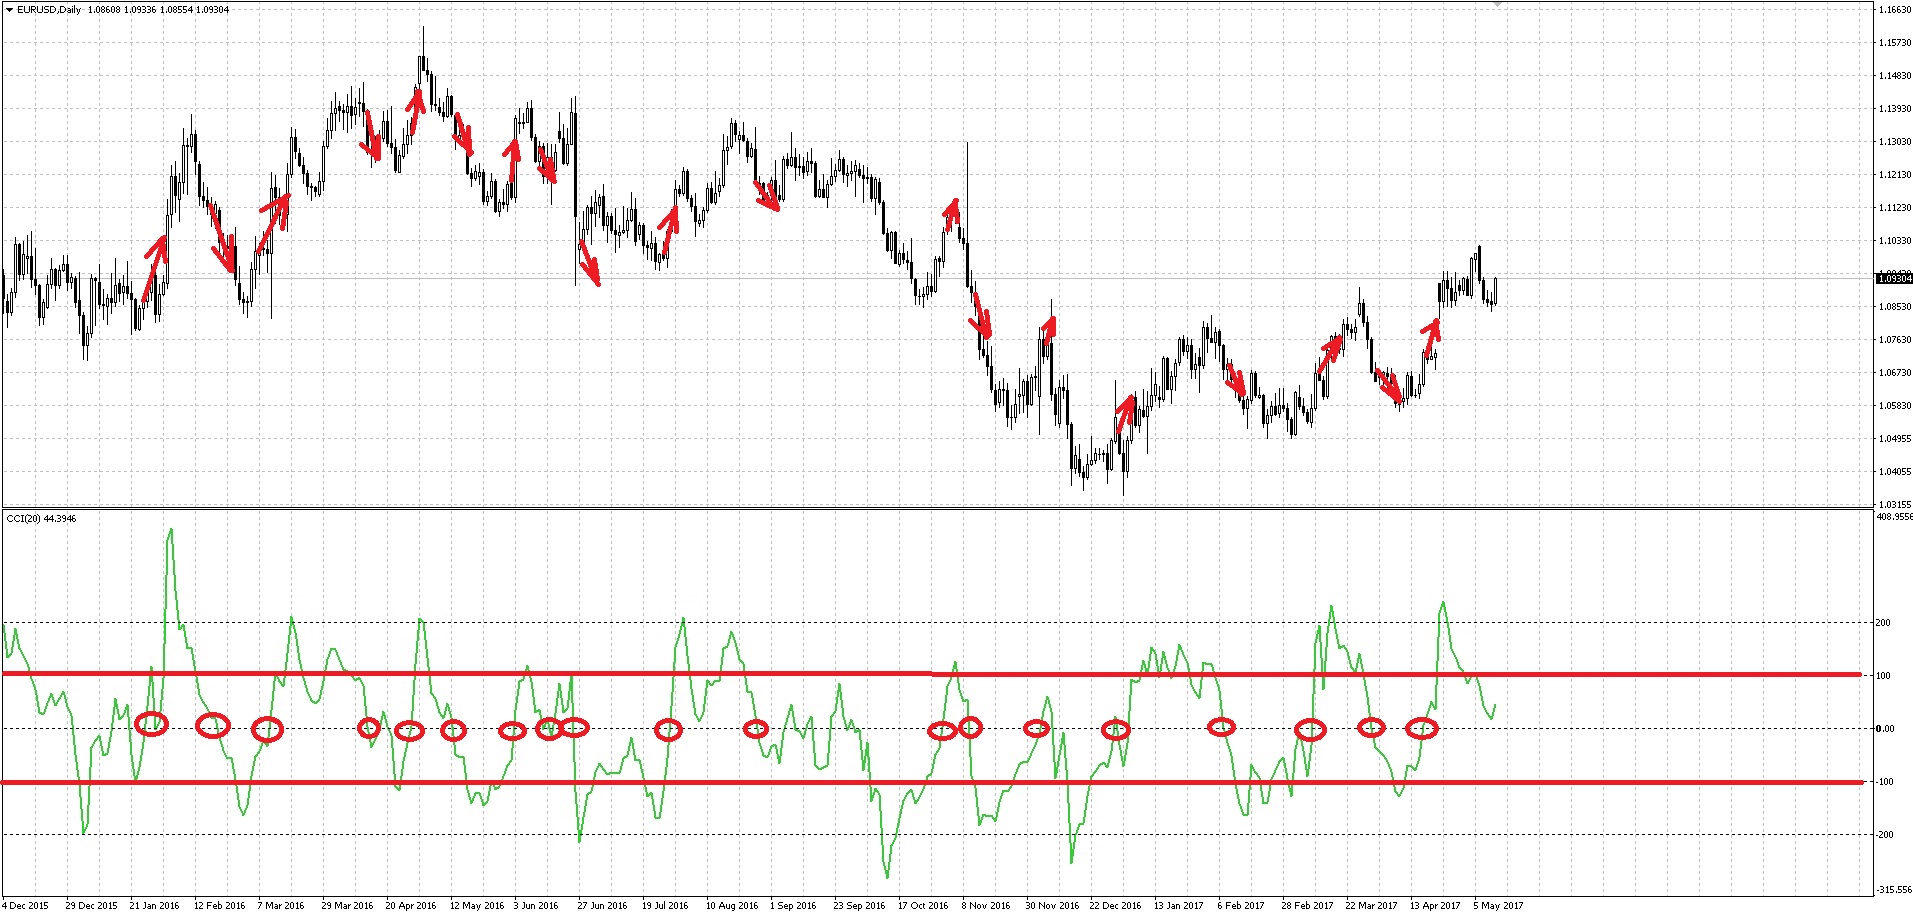 In other words, in both of the above cases, the indicator is used to identify oversold and overbought zones.
The third option is working with divergences. As with any other oscillator, working with divergences is applicable to CCI. We will not dwell on this because an entire article was devoted to this topic. For those who have not read it, I advise you to familiarize yourself with this information via the link.
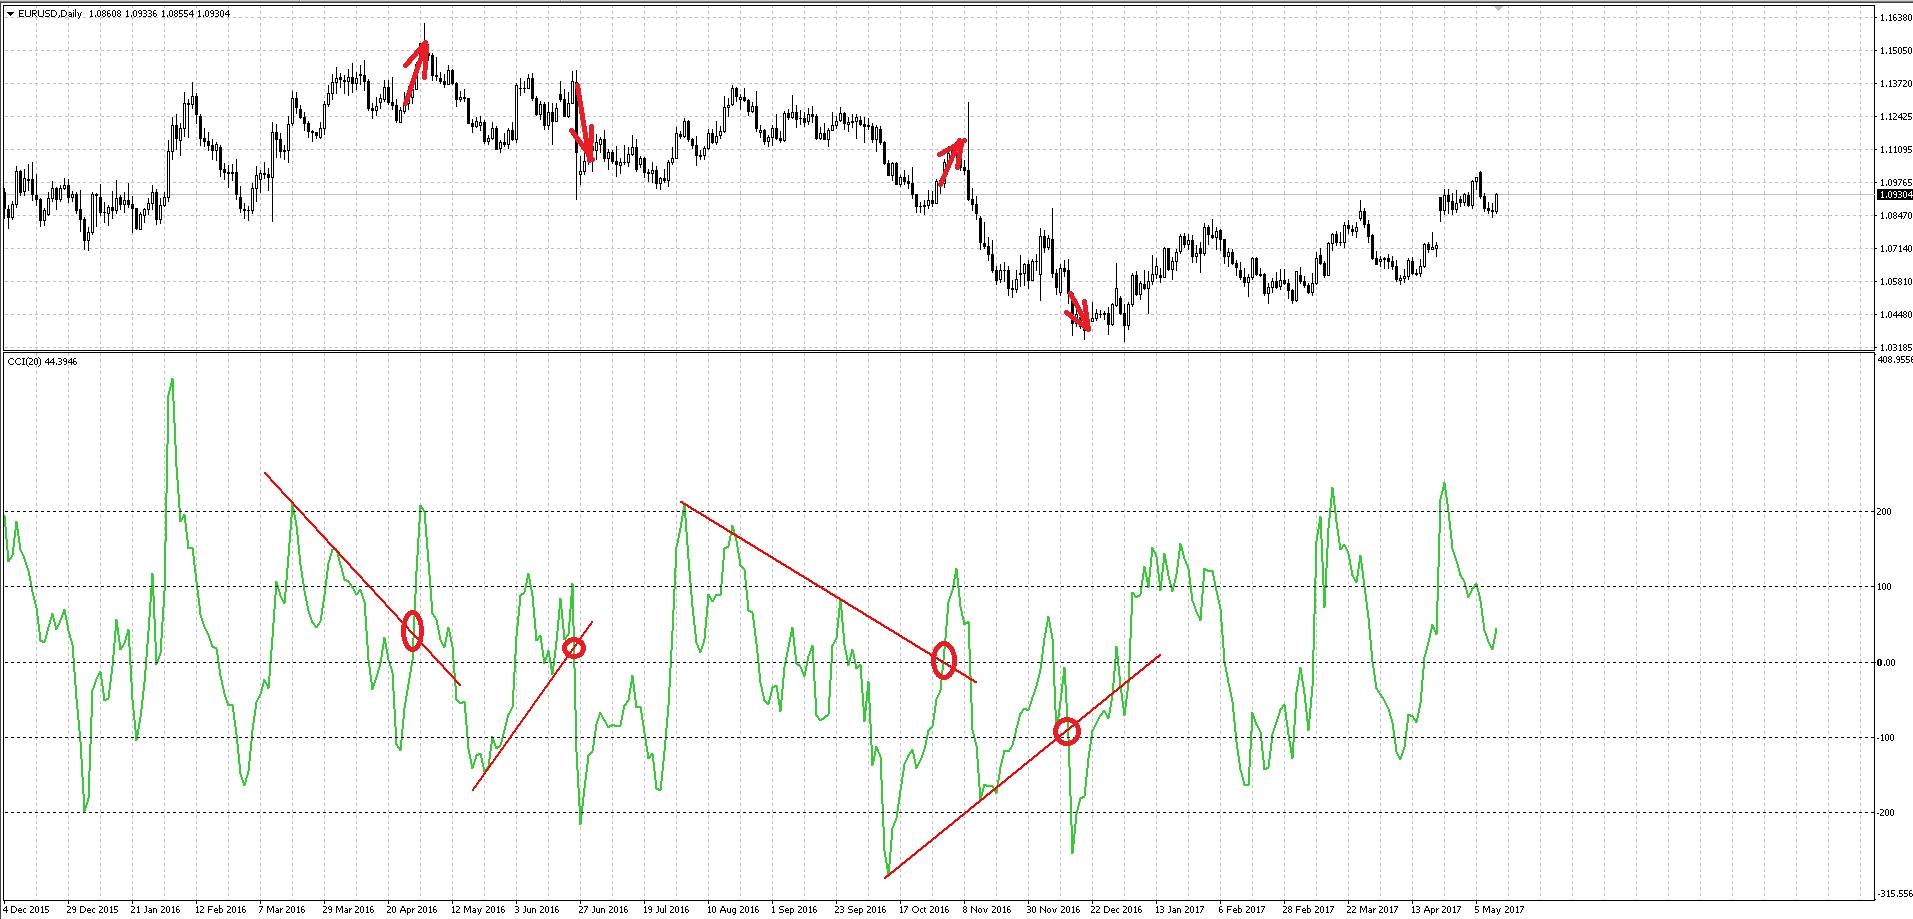
And the fourth option is the use of technical analysis elements to obtain signals from the CCI indicator chart. Here you can use various chart patterns such as the triangle, head and shoulders, and so on. You can also draw support and resistance levels as well as trend lines on the CCI chart, which, by the way, work especially well.
 At this point, we have probably covered almost all entry signals. Except for one, quite original one - I saved it for dessert.
Entry Filter

CCI can be used quite well as an entry filter. For example, do not enter buys if the CCI is above the +200 level, since it is believed that after crossing the +200 mark, the market loses strength. Or, on the contrary, do not consider sells if the CCI is above 0, since CCI growth in the range from 0 to +100 indicates trend stability.
Getting Confirmation

Let me repeat once again - it is extremely important, as with many technical tools, to use CCI in combination with other indicators. Support levels work well with CCI because both methods are aimed at finding reversal points. Some traders also add Moving Averages. For example, a 60-day exponential Moving Average provides a good support level.
Another possible addition to the CCI indicator can be the use of candlestick patterns, which can help confirm precise tops and bottoms, especially in combination with the same levels or trend lines.
An Interesting Strategy

As promised, here is something for dessert. Most traders feel uncomfortable trading breakouts - it seems to them that the price is about to reverse and they will take losses. Nevertheless, many try to catch market reversals, including by tracking overbought and oversold situations. Including with the CCI indicator. At the same time, it is believed that trying to catch a reversal always ends with a beginner losing their account. Then let us take that money ourselves, why let it go to waste? So, we will buy when the indicator makes a new high above 100 and sell when the CCI makes a new low below -100.
Apply the CCI(20) indicator to a chart with the H1 period or higher. Find a peak above the 100 level or a trough below the -100 level. If the new peak exceeds the previous one, enter a buy. If the new trough is below the previous one, enter a sell. Set the stop at the low/high of the signal candle. Entry is made with two orders. The take profit of the first is half the stop distance, the take profit of the second equals the stop size. When the take profit of the first order is triggered, the stop loss of the second should be moved to the breakeven zone. You should not enter a trade if the signal candle is very large and has a long shadow in the direction of the supposed trade entry. If the stop loss turns out to be large (more than 150 points for D1), it is worth reducing it by one and a half to two times. In this case, the profit targets can be left based on the full stop.
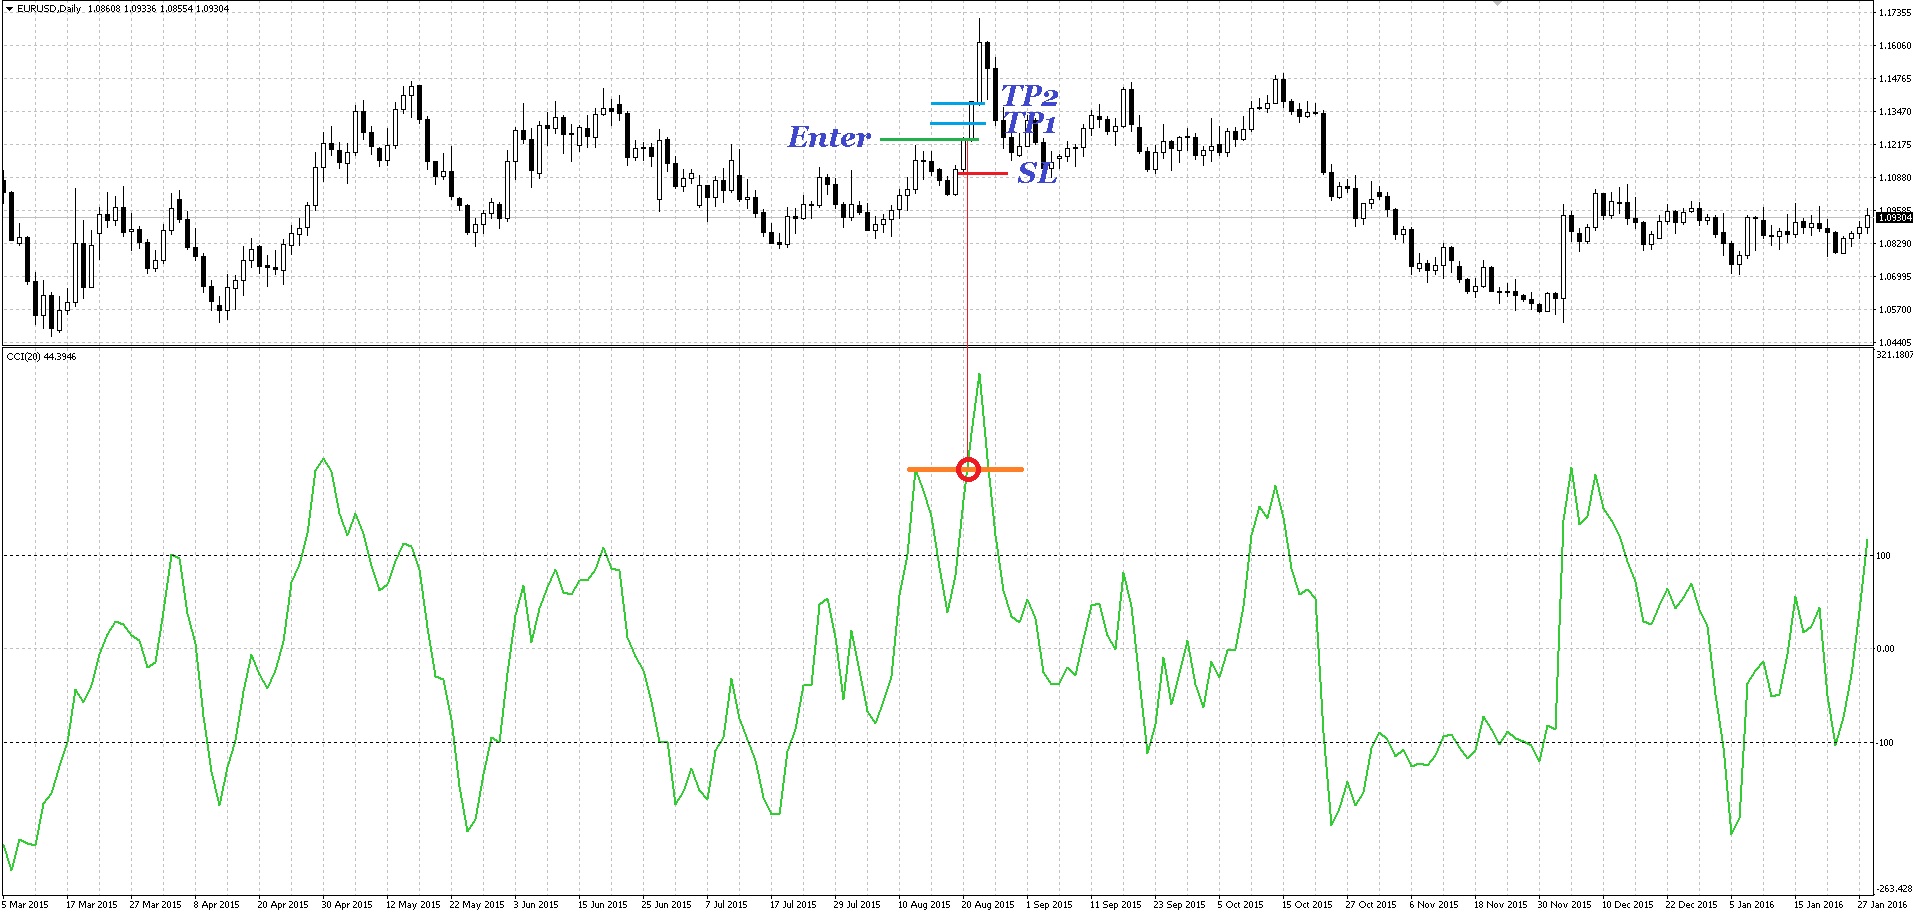 As you can see, most traders would not open in those places in the same direction where strategy signals arise. Nevertheless, the pattern is quite accurate and brings profit in more than 70% of cases. At the same time, our profit-to-risk ratio is less than one, it is 0,75 to 1. But such a ratio does not have to be taken as a rule, you can choose any ratio of your own. An important rule of this strategy is that the stop must be short. The strategy relies on momentum continuation with the goal of taking a small profit from the market. Most often, when the pattern works out, the price immediately moves in the required direction. Therefore, the stop should not be large.
Conclusion

So, today we got acquainted with another useful analysis tool - the CCI oscillator. The Commodity Channel Index is extremely useful for determining cyclical buy and sell points. Traders can use this tool most effectively by, first, calculating the precise time interval and, second, using it in combination with some other technical tools. Finally, let me remind those who decide to build their system on CCI that it works best on timeframes from H1 and above, and it is better to start testing with the EURUSD pair. And one more thing - I recommend a period of no less than 9 and no more than 28. In addition, they say that CCI works well in combination with MACD, another indicator that we have already managed to cover.
Also, do not be lazy to look at the indicator thread on the forum, where more than two hundred different oscillator modifications are collected: multi-timeframe, multi-currency, with a histogram, without one, CCI in interaction with other indicators, and so on; especially since most versions are presented with open source code (open source).
Best regards, Dmitry aka Silentspec
TradeLikeaPro.ru
