
How to Trade Wolfe Waves Profitably

Hello, fellow forex traders! Many of you have probably come across mentions online of a trading method called "Wolfe Waves." Some info-marketers try to sell courses based on it, although there is nothing complicated or secret about this strategy approach to trading. And today we will break down what these waves are, how to find them on the chart, and most importantly, how to use them in trading to make a profit.
What Are Wolfe Waves?

According to Elliott, the market has a Wave structure and follows certain pendulum-like movements. Many other researchers agree with him, and some of them developed their own wave theories. One of them is Wolfe Waves.
From the Forex for Dummies course we remember several reversal and continuation patterns. These patterns are quite a subjective phenomenon. There are not that many rules for constructing them. Quite often beginners tend to see these patterns where they do not exist at all.
Wolfe Waves, on the other hand, are a reversal pattern subject to very strict rules. In the opinion of the author of this article, this pattern is the most accurate and the least subjective reversal formation. The percentage of successful completion of this pattern is quite high. Studying Wolfe Waves is definitely not for beginners, and it is worth starting to master this trading strategy after about a year of trading. This pattern occurs on almost all timeframes and works on all instruments.
According to Newtonian mechanics, every action has an equal and opposite reaction. The Wolfe Waves trading system was developed based on this statement. Price, like a pendulum, swings from side to side: up and down. And its movements are not as chaotic as they may seem at first glance. Today we will learn to see the almost invisible. What other traders miss.
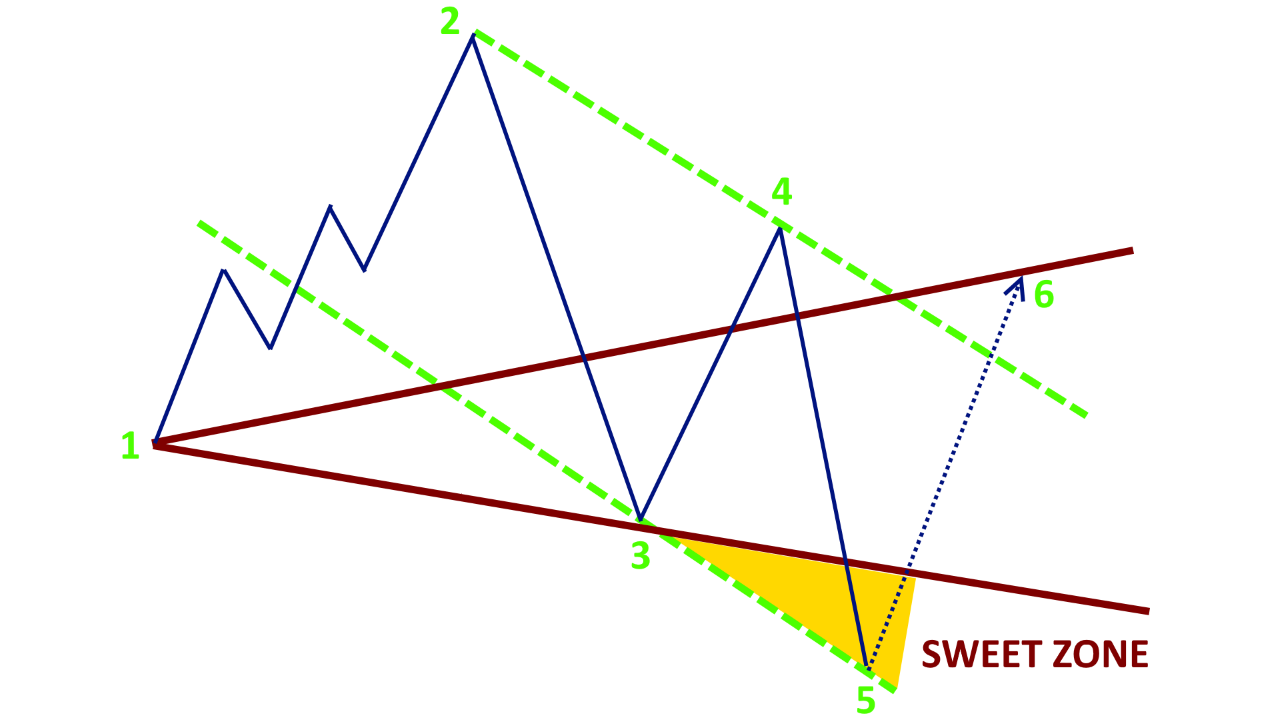
Let us pay attention to the picture below. This is a "Bullish Wolfe Pattern." All waves in this pattern are numbered, all of them are important, and each wave has its own specific function.
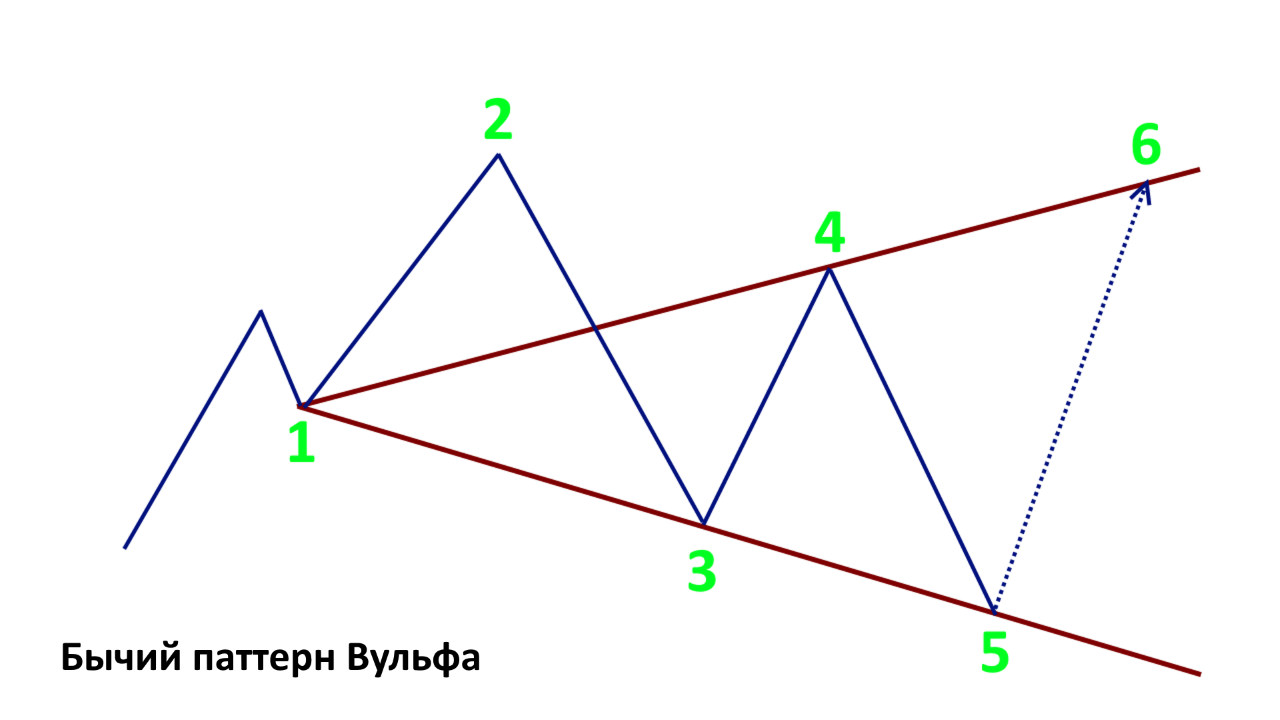
Rules of the Bullish Pattern:
- Point 1 is the first of the three points that define the pattern;
- Wave 1-2 is the basic foundation of the pattern. The entire pattern is its continuation;
- Point 2 is the first peak of the oscillating price movement. It must be above point 1;
- Point 3 is the second of the three points that define the pattern. It is the minimum reached after wave 1-2. It must be below point 1 on the chart;
- Wave 3-4 is the second wave in our pattern;
- Point 4 is the maximum of the second wave of our pattern. It must be below the second point and above the third point;
- Point 5 is the third of the points that define the pattern. It is the minimum reached after wave 3-4. It lies on the line drawn from point 1 to point 3. It must be below the third point. This is our entry point. It is upon reaching it that the pattern is considered suitable for starting trading;
- Points 1-3-5 lie on one line;
- Point 6 is our target. It lies on the line drawn from point 1 to point 4. Upon reaching point 6, all positions are closed and the pattern is considered completed;
- Wave 5-6 is the strongest and the only tradable Wolfe Wave;
- Points 1-4-6 lie on one line.
Bearish Wolfe Pattern
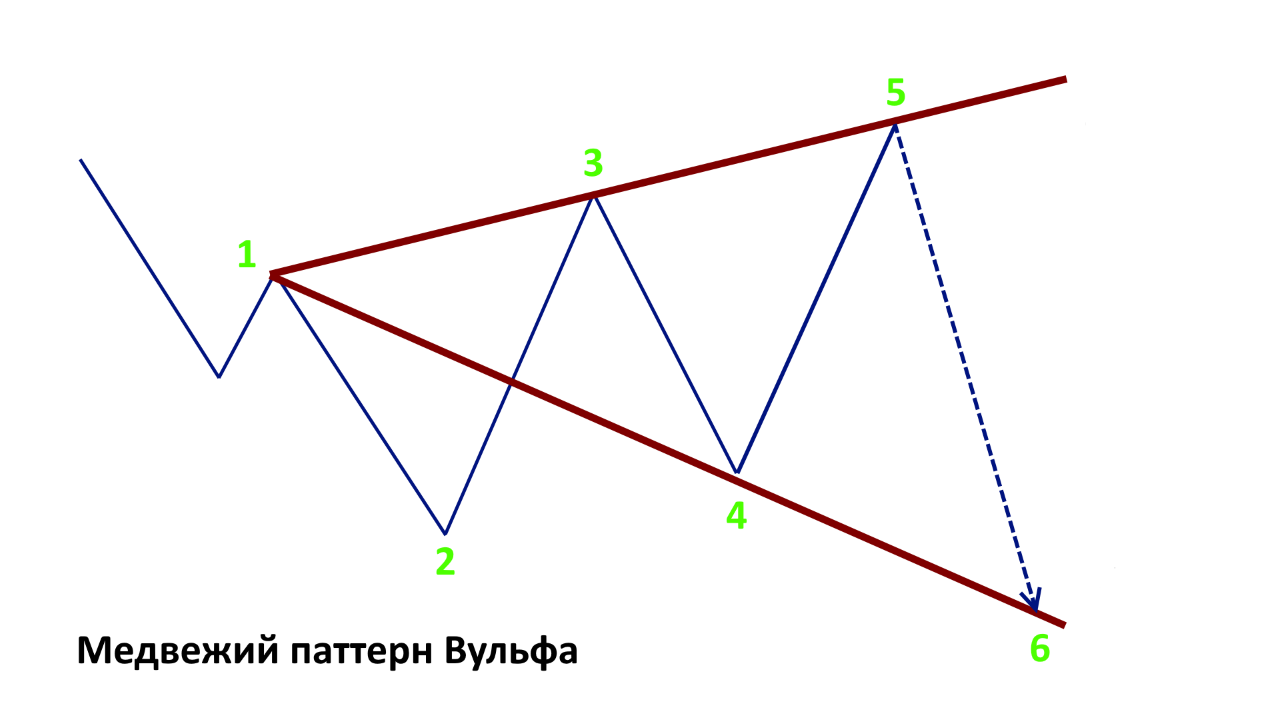
Rules of the Bearish Pattern:
- Point 1 is the first of the three points that define the pattern;
- Wave 1-2 is the basic foundation of the pattern. The entire pattern is its continuation;
- Point 2 is the first peak of the oscillating price movement. It must be below point 1;
- Point 3 is the second of the three points that define the pattern. It is the maximum reached after wave 1-2. It must be above point 1 on the chart;
- Wave 3-4 is the second wave in our pattern;
- Point 4 is the minimum of the second wave of our pattern. It must be above the second point and below the third point;
- Point 5 is the third of the points that define the pattern. It is the maximum reached after wave 3-4. It lies on the line drawn from point 1 to point 3. It must be above the third point. This is our entry point. It is upon reaching it that the pattern is considered suitable for starting trading;
- Points 1-3-5 lie on one line;
- Point 6 is our target. It lies on the line drawn from point 1 to point 4. Upon reaching point 6, all positions are closed and the pattern is considered completed;
- Wave 5-6 is the strongest and the only tradable Wolfe Wave;
- Points 1-4-6 lie on one line.
These rules describe ideal Wolfe patterns. Such situations arise quite rarely, and in reality, as usual, there are some nuances. Let us consider them:
Nuances That Arise When Working With the Fourth Point
Quite often, at the moment the fourth point is formed, the market may go sideways or the price draws a triangle; in the resulting jumble of peaks it is quite difficult to find the true fourth point. We find ourselves in a difficult situation and are not sure which of the lines drawn from point 1 to point 4 will be the true target line for the formation of point 6. Let us take all of them into account. Yes, yes, you heard that right. Now we have many point 6s.
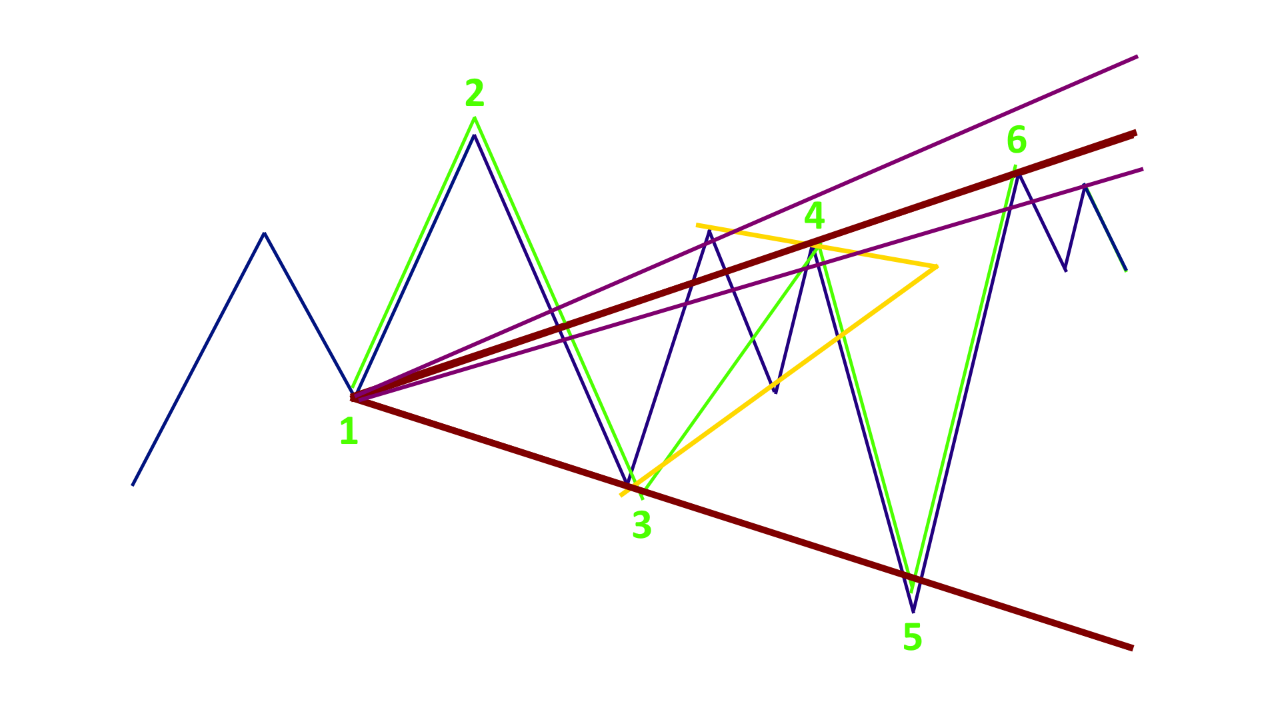
Let us pay attention to the bearish pattern in the picture above. As we can see from this schematic image, in the end all point 6s lying on the 1-4 line were reached, but this might not have happened. We need to calculate our lot in such a way that at each touch point of the 1-4 lines we close it little by little if we are not sure about the final target. Alternatively, we can move the stop loss after each 1-4 line is passed. Upon reaching point 6, all positions are closed. The subsequent movement may continue, or it may bounce back. The probability of these events is 50%. One should never ignore the exit rule at the last 6th point.
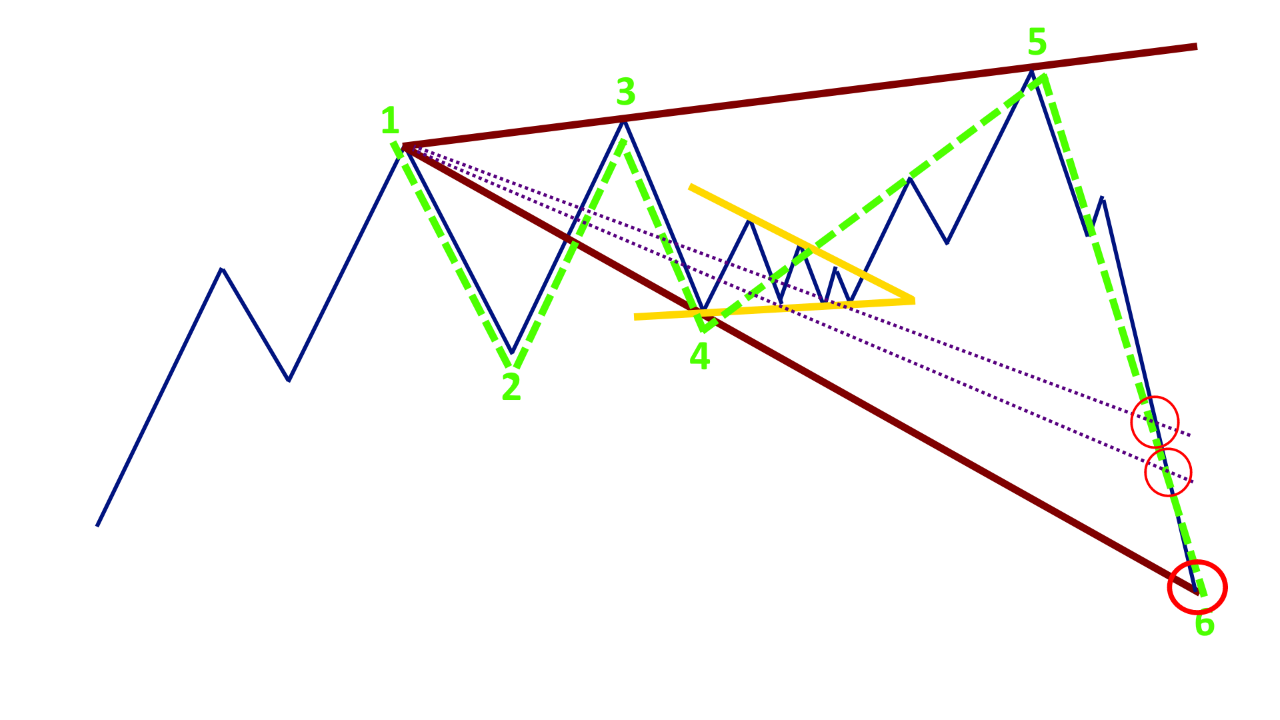
Sweet Zones in the Wolfe Pattern
In order to begin the move from point 5 to point 6, we need to accumulate liquidity. Because of this, point 5 is sometimes below the 1-3 line or quite often spikes through it. The zone located below the 5th point lying on the 1-3 line is called the sweet zone. Entering trades in this zone is considered the most profitable.
It is quite simple to outline the boundaries of this zone. It is necessary to draw an auxiliary line between peaks 2 and 4. Duplicate this line strictly in parallel and move it to point 3. If the line built from point 2 to point 4 is parallel to the line drawn through points 1-3, the sweet zone is absent.
If the angle built from point 3 of our supposed point 5 in the sweet zone is too wide relative to the 1-3 line, then most likely you did something wrong and this is not a Wolfe Waves pattern at all.
Algorithm for Finding a Wolfe Pattern on the Chart
We look on the chart for 3 points (highs or lows) lying on one line. We check whether peaks 2 and 4 are near them. We verify the placement of the peaks according to the rules of the bearish or bullish pattern (see above).
Let Us Consider Several Examples in Practice
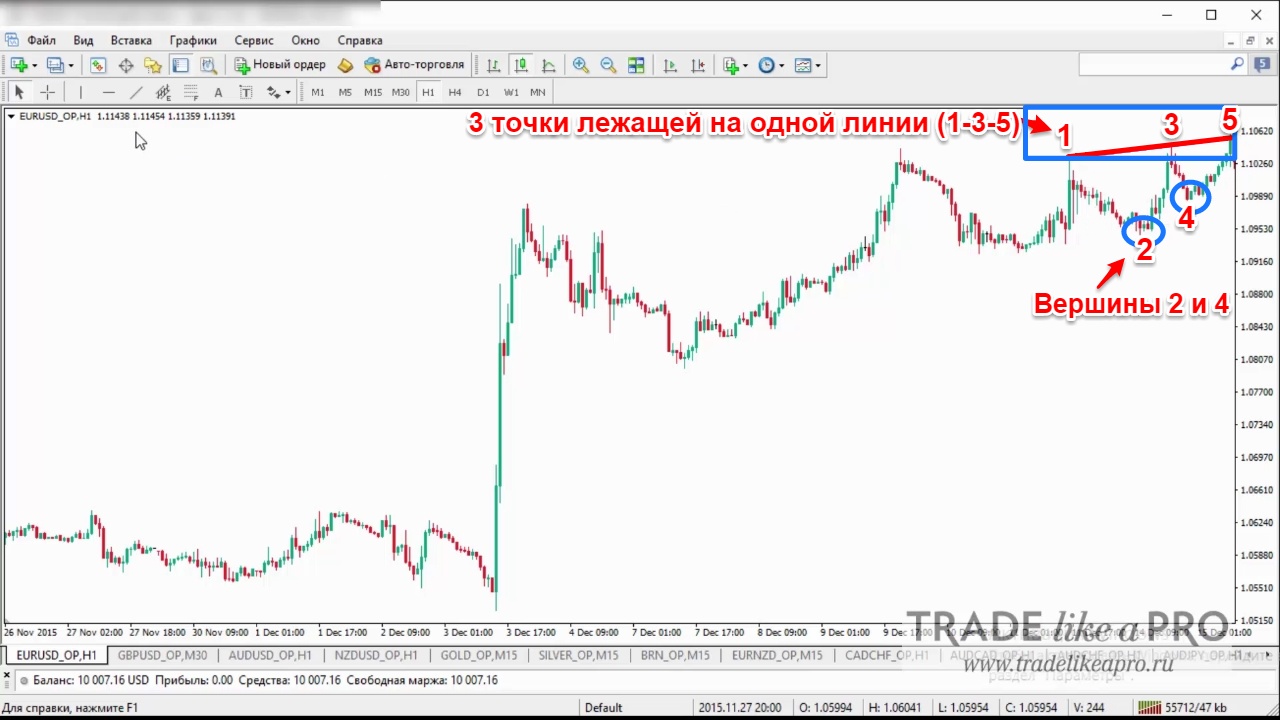
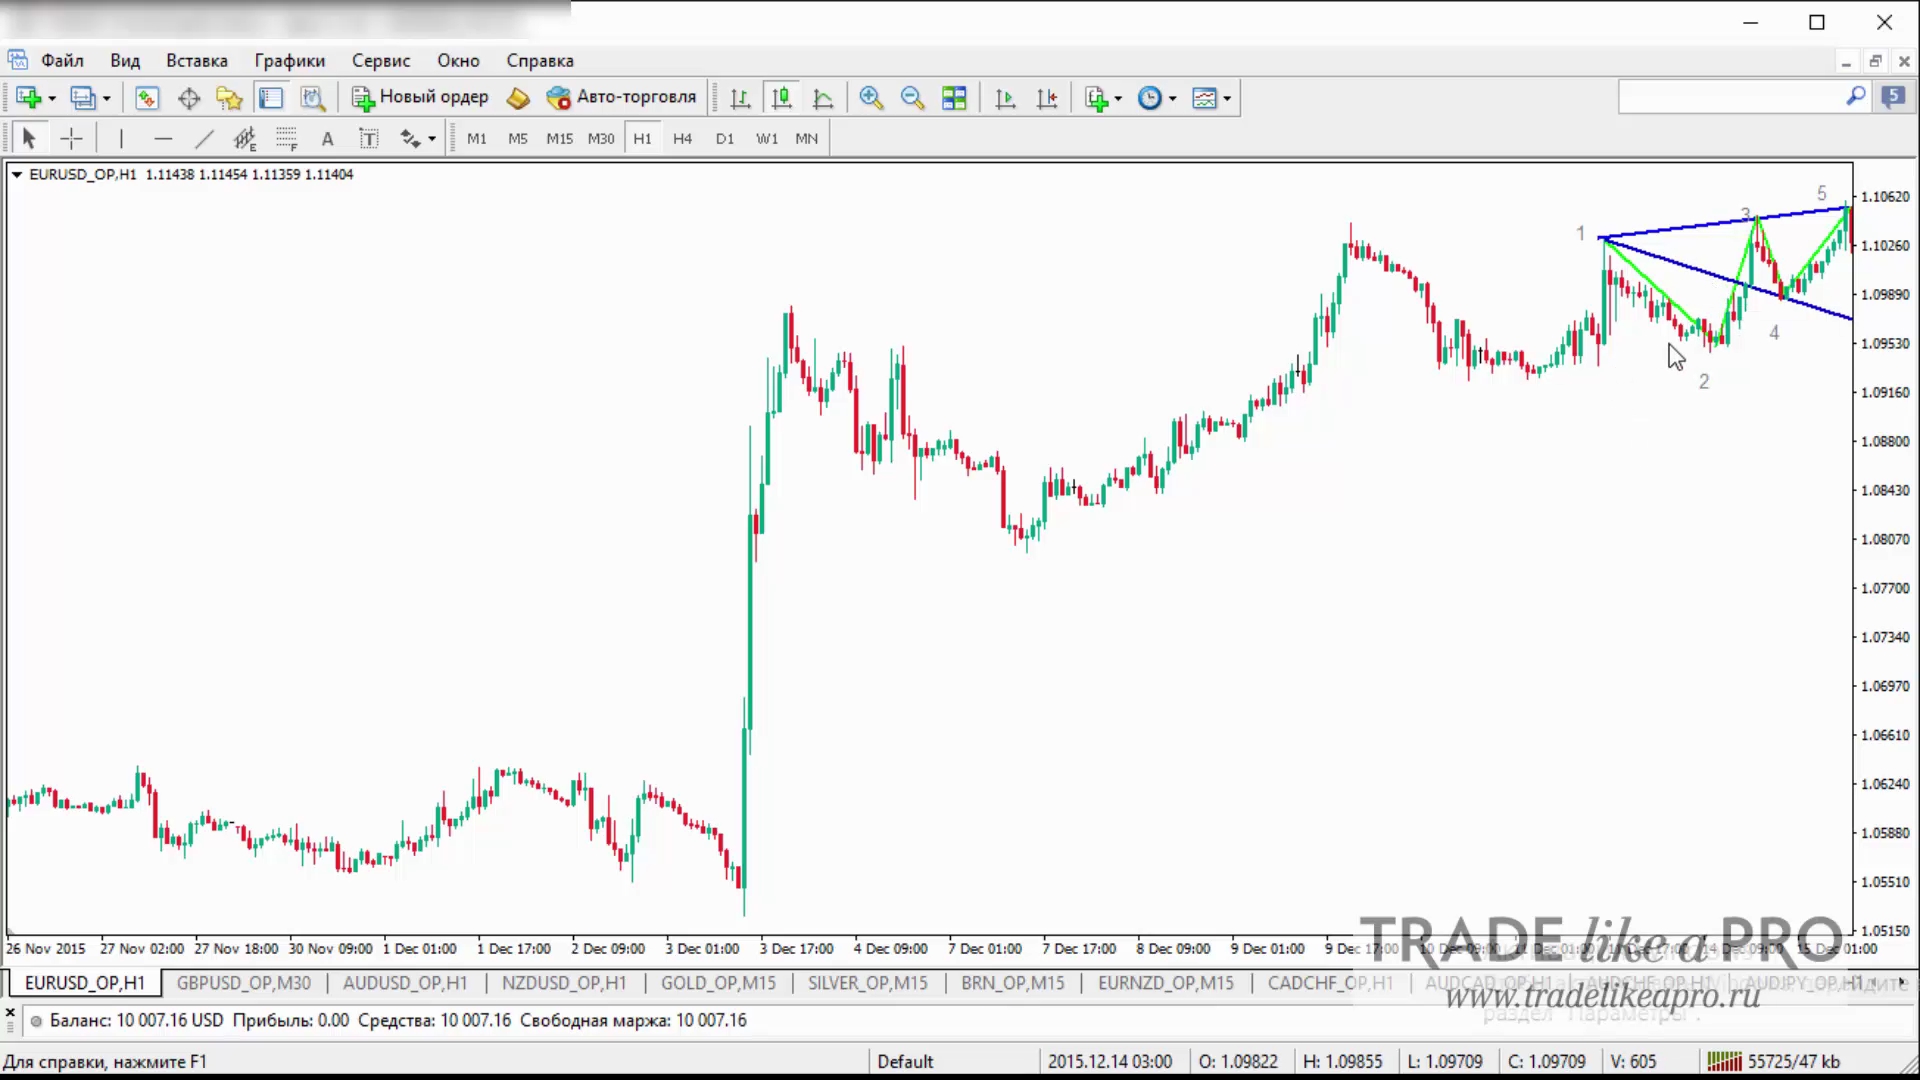
Let us try to detect the Wolfe pattern on the EUR/USD pair (H1). From the picture below, we can observe that 3 points lie on one line. These are points 1-3-5. We suspect a Wolfe pattern. We try to plot it according to all the rules of the "bearish pattern". Where is our target? Our target is defined by the line going from point 1 to point 4.
We cannot know where and when the price will touch this line. Therefore, we will set a ray from this straight line extending to infinity. And to do this, we will carry out a small algorithm of actions. By right-clicking on our line, select "Properties", then "Parameters", and "Ray".
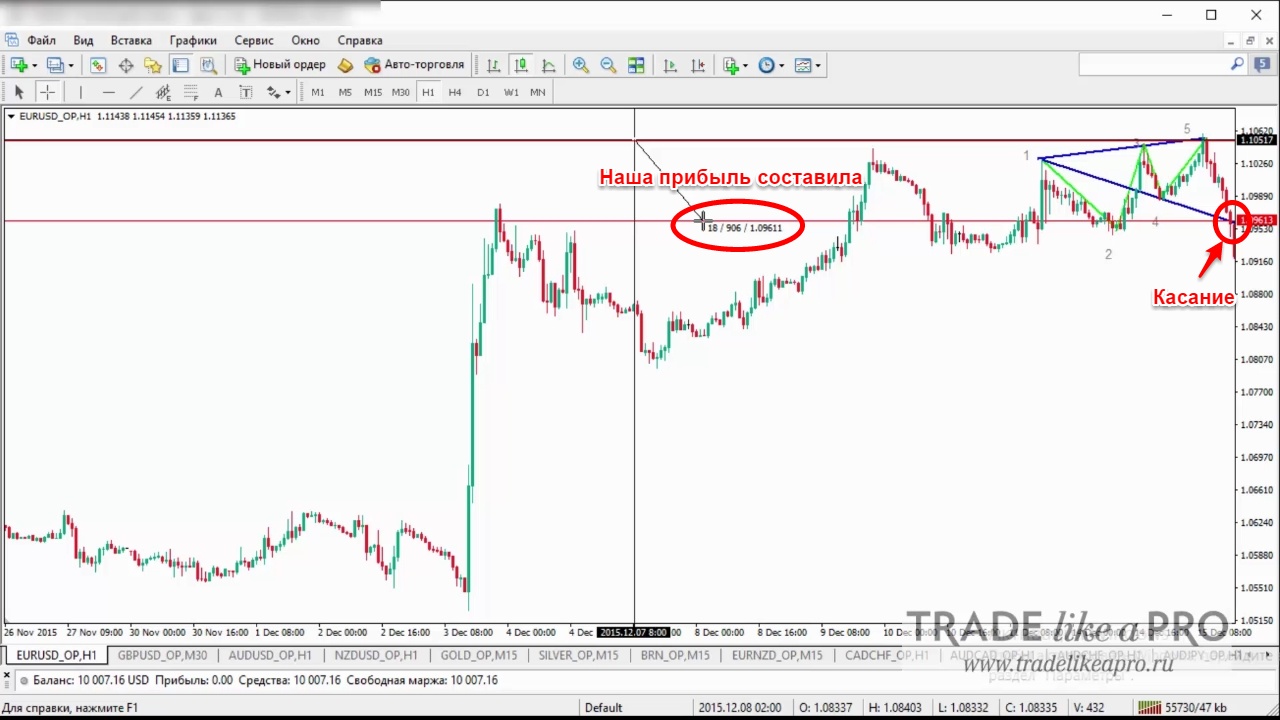
We wait for the pattern to play out. There is a price touch. This really was a Wolfe pattern. An excellent result. Let us calculate our profit.
Next, we will try to find our pattern using the example of GOLD (M15)
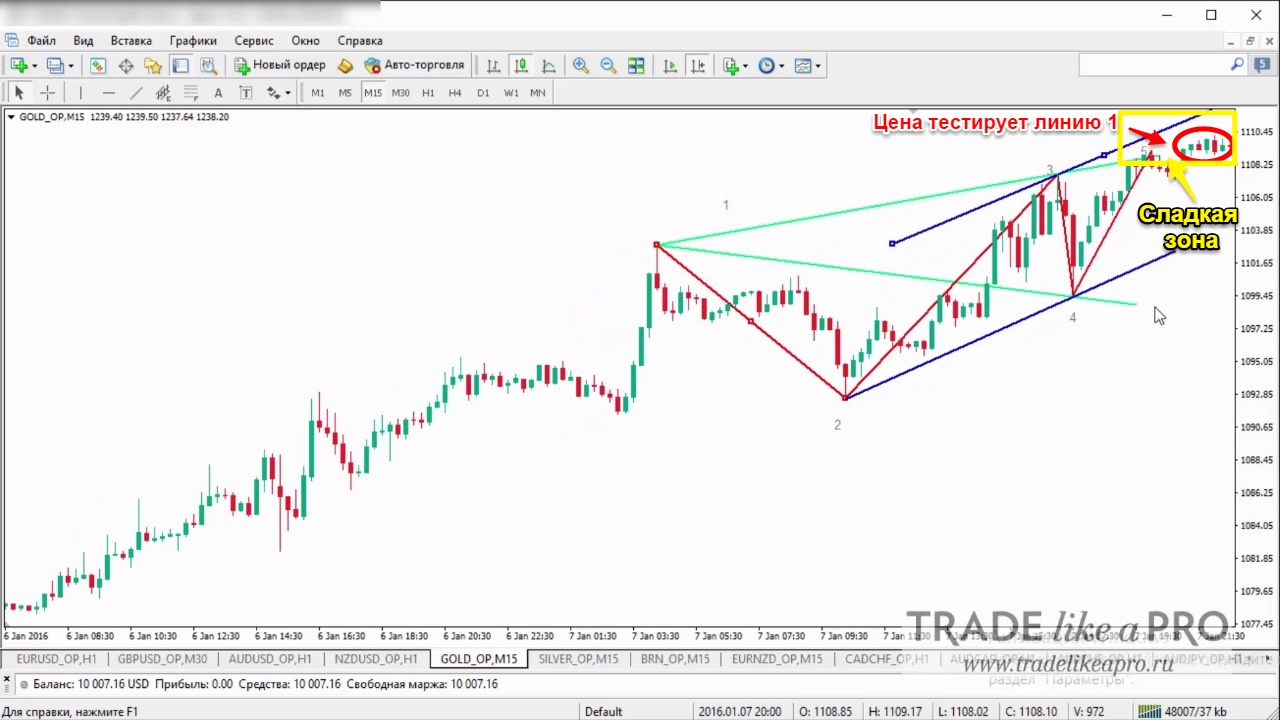
On this chart, we can observe a clearly rising bullish trend. The chart looks a little chaotic and not very neat, although it fits our standard rules for constructing a bullish pattern. Let us go through them:
- 2 is below 1;
- 3 is above 1;
- 4 is between 3 and 2;
- 5 is above 3.
We forecast a downward movement by placing a sell trade at point 5. The price retests line 1 again. Perhaps this is some kind of mistake, but as we remember, sometimes the Wolfe pattern forms "Sweet zones" (Sweet zone). We find it by drawing the (blue) line from 2 to 4. Then we copy it to point 3. We definitely have room for a sweet zone. Let us see what happens next.
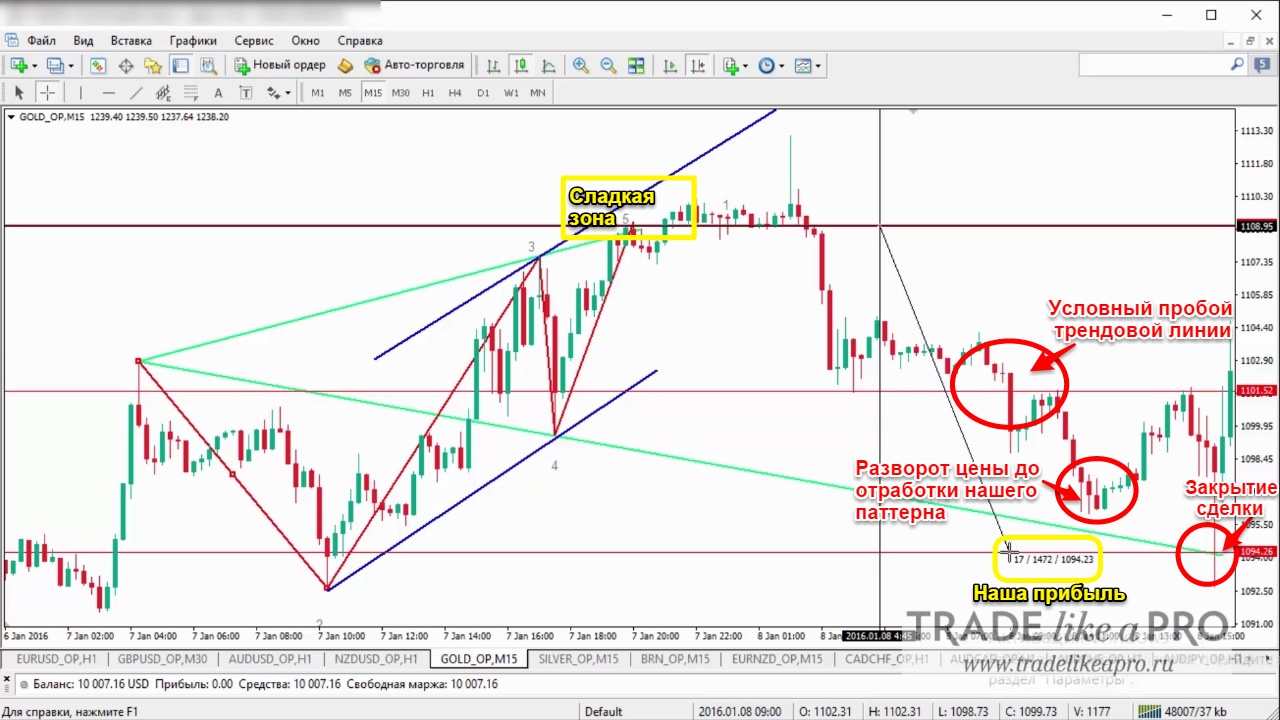
The price slowly began to reverse. Could the price really go that far down when we have an upward trend ?
We see where the trend broke (conditionally). Then we can observe a false reversal signal, but despite this, we stay in the trade and wait for the pattern to fully play out. Yes, the pattern played out and we can lock in profit with relief. The trade lasted 2 trading days.
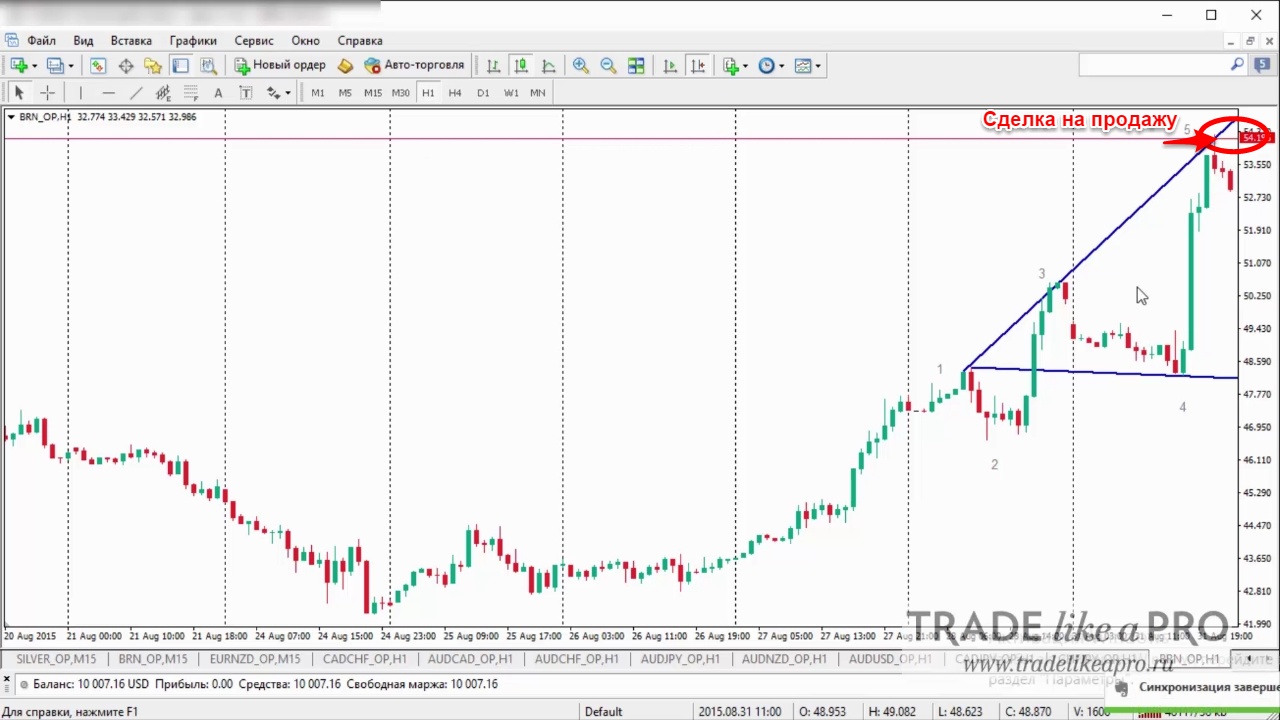
What about commodities, CFD contracts, and other assets? The same thing. Wolfe works everywhere. Let us look at the example of Brent oil BRN (H1).
We build the figure according to all the rules and place a sell trade while waiting for the figure to play out.
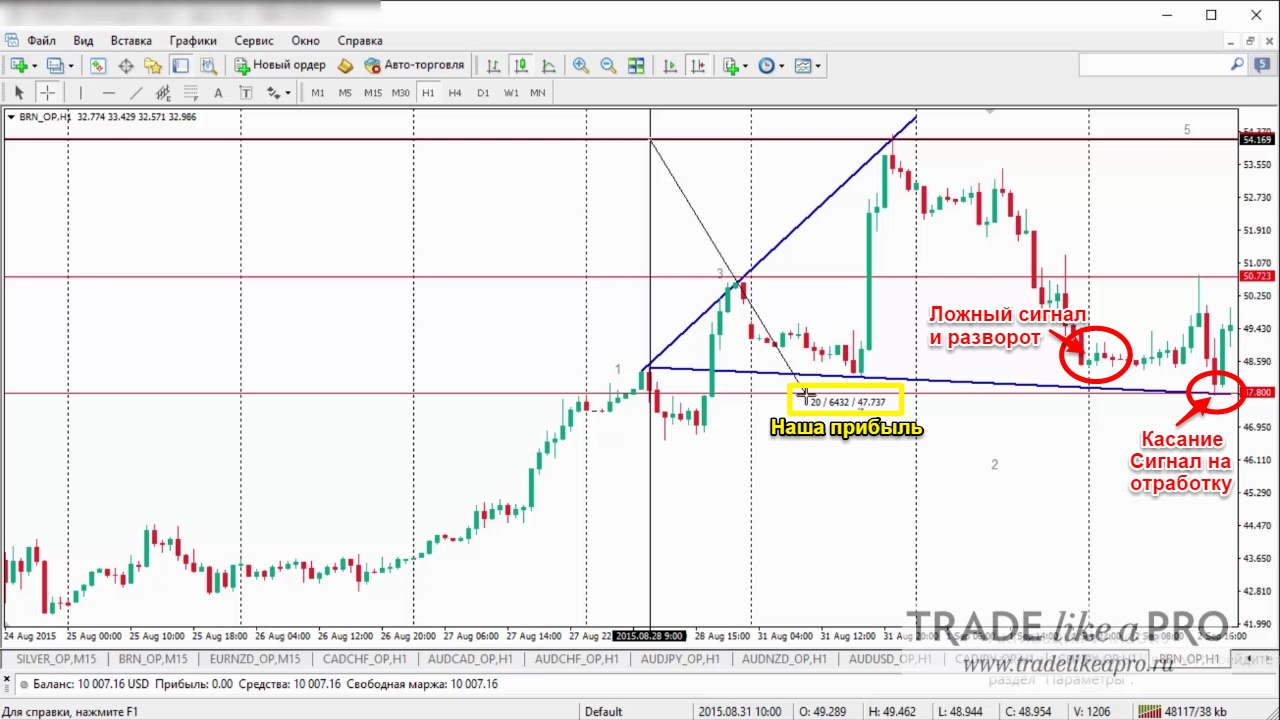
We wait for the touch. We close the trade. We calculate the profit :)
Conclusion

Although the Wolfe Waves pattern is quite difficult to grasp and requires long practice to identify, it is one of the most effective tools of wave-based technical analysis. The potential of using this pattern will surpass all your expectations and assumptions about its application. Despite the apparent impossibility of such a complex figure forming on a chart, it forms very, very often and is also one of the most profitable.
Best regards, Alexey Vergunov TradeLikeaPro.ru
