
How to Trade Oil
 Good day, fellow forex traders!
80 years ago, New York University economics professor Myron Watkins wrote: "the problem with oil is that there is always either too much of it or too little." And over the last couple of years this has been felt especially strongly: markets are suffering from oversupply, forcing OPEC countries and partners to negotiate with each other and limit production. The goal is to stabilize the price and buy time needed to carry out fundamental structural reforms that this most important sector of global production needs today.
How oil markets developed up to the present day, the current state of affairs and near-term prospects, the volatility of related instruments, as well as strategies that can be used to profit from movements in "black gold" are covered in detail in our material. After all, it is not only oligarchs who want to get rich; traders want their own "duck house" too :)
Production Costs in Different Countries

In 2017, oil once again confirmed its reputation as one of the global factors affecting the world economy. Nevertheless, black gold production in the world differs greatly, both in technology and in cost.
 As we can see from the table below, the production cost of shale oil in the United States has fallen to 20 dollars per barrel, thus coming very close to the cost of conventional production. This state of affairs is explained by the fact that shale oil extraction technologies are rapidly improving, and if in 2012 the production cost by this method was around 100 dollars, then in literally 4 years it was reduced by almost 5 times.
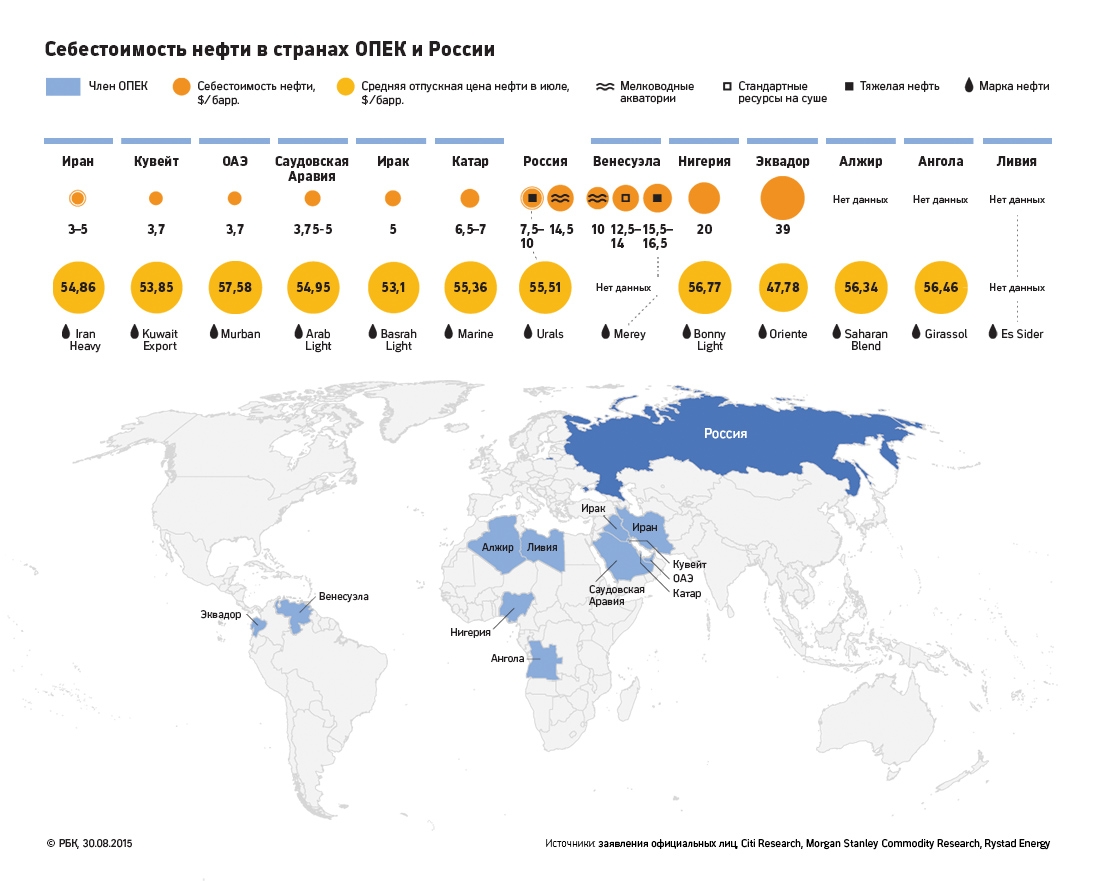
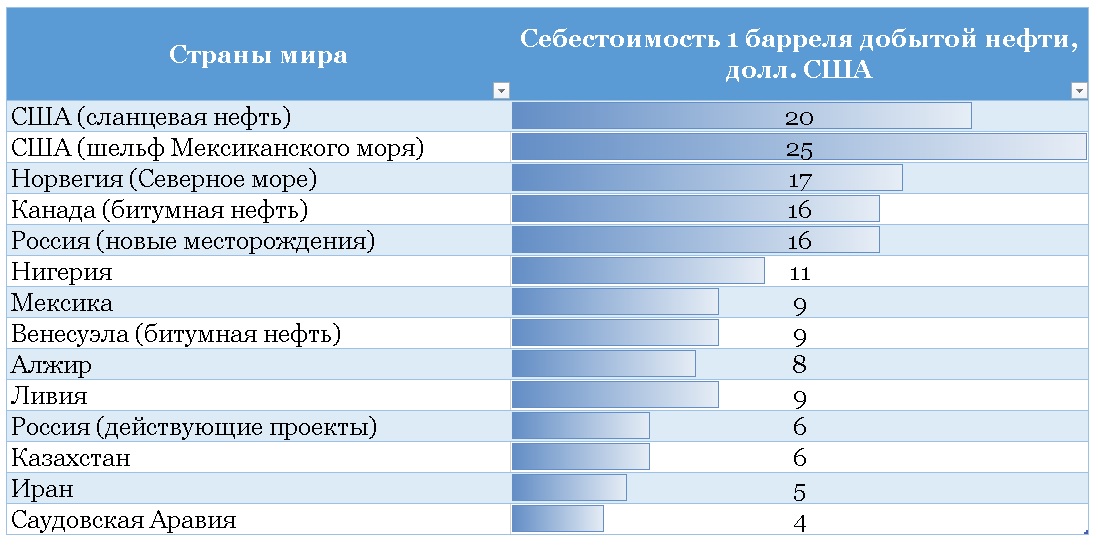 Oil production remains cheapest in Saudi Arabia and Iran: 4 and 5 dollars respectively.
As for Russia, at old explored fields the cost of oil production does not exceed 6 dollars, while at new fields it is about 16 dollars.
Brent and WTI Grades
 Marker, or benchmark, crude grades are oil grades with a specific composition (sulfur content, density), the prices of which are widely used when setting prices for the purchase and sale of various types of crude oil for the convenience of producers and consumers.
There are three main benchmark grades in the world: Brent Blend, West Texas Intermediate (WTI), and Dubai Crude. Quotes for these grades published by pricing agencies determine prices in the main regions:
- "Brent," produced in the North Sea, is for the markets of Europe and Asia. Prices for about 70% of exported crude grades are directly or indirectly based on Brent quotes;
- "WTI" (West Texas Intermediate), also known as "Texas Light Sweet," is for the Western Hemisphere (the USA) and serves as a reference point for other oil grades. For a long time in the 20th century it was the only benchmark grade;
- The benchmark grade "Dubai Crude" is widely used in determining prices for oil exported from the Persian Gulf countries to the Asia-Pacific region.
Usually benchmark grades are tied to some main field or to a group of fields whose oil has similar properties and is openly traded on the market with sufficient liquidity.
The standard U.S. grade is WTI (also Light Sweet), a light oil produced in Texas. At present, the benchmark grade West Texas Intermediate is used mainly in the United States (traded for delivery in Cushing, Oklahoma), both for setting prices for oil produced in the U.S. and for some imported grades. WTI is a light (API gravity) and "sweet" (contains little sulfur) oil, which makes it suitable for refining into low-sulfur fuels (gasoline and diesel). WTI oil production accounts for about 1% of global oil production.
European Brent crude has slightly higher density and higher sulfur content, but it is also high-quality oil. Thus, Brent originally meant oil produced in the British offshore field of the same name (discovered in the 1970s), but later oil produced at three neighboring British and Norwegian fields was added to it. At the moment, the blend includes oil produced from 15 different fields. This grade became a benchmark thanks to supply reliability, the presence of several independent suppliers, and the willingness of many consumers and refiners to buy it. Despite some supply problems in the past and not the largest production volumes, the Brent blend has sufficient liquidity to remain a benchmark. Oil production included in the Brent blend accounts for about 1% of global oil production.
At the same time, WTI has lower price levels, while Brent has served as a better indicator of world prices in recent years.
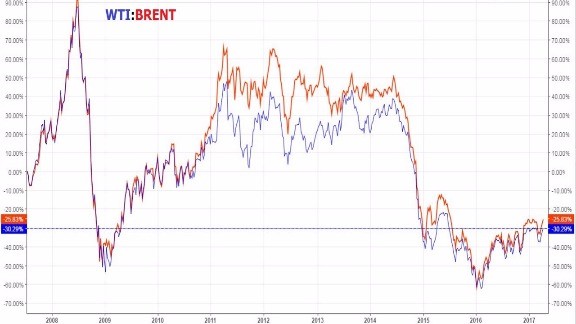 The price difference (spread) between these two grades remained fairly narrow until the end of 2010, when the two markets sharply diverged because of a changed supply and demand situation associated with rising U.S. production driven by shale and oil-loading sector technologies, while drilling in Brent fields underwent a forced reduction. In recent years, the spread between WTI and Brent has narrowed, but the current supply factors still have the power to reproduce a new dissonance.
Changes in oil storage infrastructure and its transportation through pipelines in the United States are so significant that they are very likely to lead to serious market changes in the coming years. These changes may spur growth in trading volumes of domestic petroleum product grades in the U.S. and increase the role of WTI crude as a global benchmark.
The catalyst for this transformation was the sharp growth of oil production in the U.S., as well as the lifting of the ban on U.S. oil exports at the end of 2015. To turn from a pure oil importer into an exporter, the United States will have to reverse several key pipelines. At the same time, refiners and oil storage operators on the Gulf of Mexico coast are beginning to expand existing capacities.
A number of new terminals are under construction along the Gulf of Mexico coast to serve the growing number of vessels arriving to load oil bound for the international market. These infrastructure changes will transform the United States more into a supplier of oil to the world market, capable of responding quickly to changes in supply and demand, rather than a regional exporter. All this will allow producers to take advantage of arbitrage opportunities that exist on the other side of the Atlantic.
Oil at Brokers

Today, even people who have absolutely nothing to do with exchange trading follow oil prices. This is due to the fact that the dollar exchange rate is tied to oil.
In general, oil trading volumes have a common volume standard: 1000 barrels per contract. But outside the bounds of Forex, any volumes can be handled, even measured in tons and railcars.
At the same time, the largest volume of oil transactions is recorded on the two leading venues: the New York and London (InterContinental Exchange) exchanges. Oil is also widely traded in Dubai, Tokyo, and Shanghai, but here the volumes are several times smaller than in the U.S. and the UK.
Trading oil on Forex happens almost the same way as trading currency. The only difference between them is that oil and currency have different leverage and margin levels. One oil trading contract can equal 10, 100, 1000, or more barrels of oil. All of them must be priced in U.S. dollars. Trading oil on Forex is contracts for difference, over-the-counter financial instruments that have a specific expiration date and cash settlement.
A Contract For Difference (Contract For Difference, CFD) is a financial instrument that allows you to trade assets such as gold and oil, gas and nickel, cocoa and cotton, without physically owning these commodities. In trades aimed at profiting from changes in the prices of particular goods, the goods themselves are of no interest to traders. Only the price difference matters. CFDs are precisely what make it possible to obtain this price difference without an actual purchase/sale.
Trading Hours
Trading hours for oil on Forex begin on Monday at 01:00 (Greenwich time) and end at 22:00 on Friday. This applies to trading oil from both the United States and the United Kingdom. We also see that there is a short period of time - the so-called "break" - which lasts from 23:00 (Greenwich time) until 01:00. Each contract has its own expiration time. When it arrives, all contracts that have not been closed will be closed automatically, and all open orders will be cancelled. If you decide to resume trading, you will have opportunities to open additional positions, which will be calculated at the new rate and will already have a different expiration date.
How Oil Grades Are Designated by Brokers

CFDs on WTI oil are found under various designations, the most common of which are WTI and CL. As for the Brent grade, different options are possible here, but most often in dealing centers it comes in two subtypes - BRN (based on futures traded on ICE) and BZ (quotes of settlement contracts from the New York Exchange).
In addition, some companies use their own tickers, for example, the codes USOIL and UKOIK are widespread, i.e. "American oil" and "British oil", but their quotes fully correspond to the data stream of the futures mentioned earlier. In the specifications of various brokers you can also find such oil designations as QM, WBS, XBZ. Therefore, it is important to clarify such nuances with your broker.
As for CFDs on gasoline and fuel oil, in this case everything is much simpler, since the futures contracts underlying them are traded only on NYMEX (New York Mercantile Exchange - New York Commodity Exchange), and therefore they depend mainly on trends in the US economy. In dealing center terminals, such instruments are found under the tickers HO (fuel oil) and RB (gasoline).
Long-Term Trend

WTI crude oil rose after the First World War, reaching a maximum in the 1920s, and moved in a sideways trend until the embargo of the 1970s led to a parabolic rally to $120. It reached its peak in the late 1970s, followed by a winding decline all the way to the 2000s, or more precisely to the end of 1999, where it is worth noting the most powerful decline in global business activity. Ultimately, oil reached the highest historical level of $144 in July 2008. And by 2010 it had fallen into the broadest trading range between $70 and $130, where it remained until mid-2014, after which there was a decline to multi-year lows. At the moment (summer 2017), oil of this grade is trading around 45 dollars.
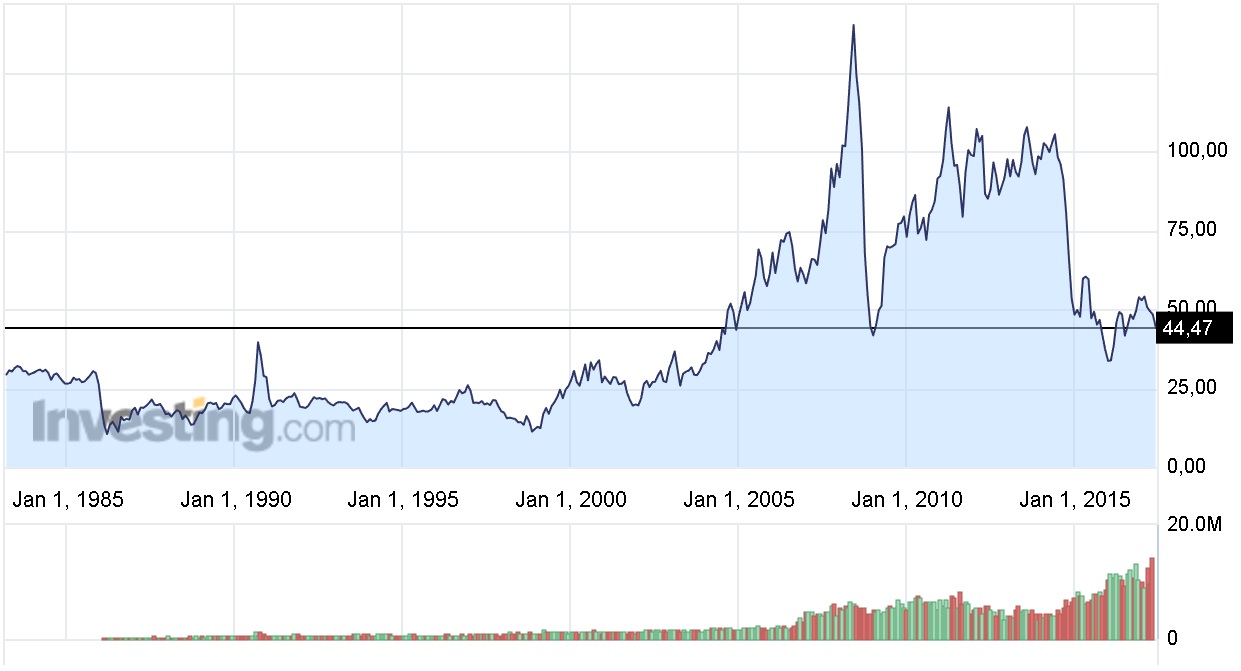 Now the issue on today's agenda is overproduction, which, together with weak global demand, as well as growing shale oil production in the United States, has led to lower oil prices. And after sanctions against Iran were lifted, in 2016 the price of Brent fell to $27.72, renewing a 13-year low. And today exporting countries regulate this problem by mutually reducing production quotas, which can only weaken the symptoms, but does not lead to a solution of the current overproduction problem.
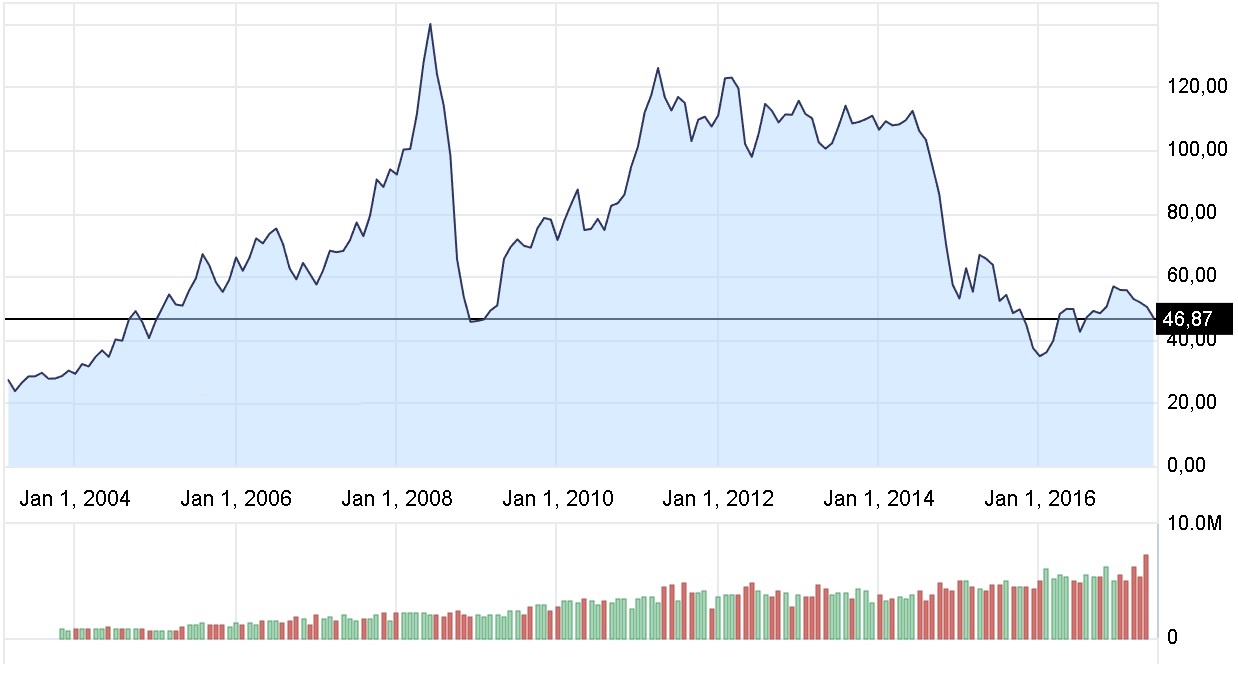 And perhaps now only the consistent recovery of the global economy, industrial activity, and consumer demand can provide the necessary climate for oil prices to rise.
What Influences Oil Quotes?

As mentioned earlier, a huge number of factors can affect changes in the cost of oil. Let us examine each of them in more detail.
Natural. To trade effectively and efficiently for as long as possible and take the correct position in the market, you need to determine the level of oil deposits in a particular region and the possibility of their depletion in the near future. At the same time, you need to take the climate situation into account; for example, global warming can reduce the volume of oil purchased. These are statistical data that provide information about oil reserves and their possible depletion in the future. It is believed that global warming can lead to a reduction in oil reserves.
Geopolitical. The presence of agreements between certain countries, as well as associations of oil producers, can have a huge impact on changes in the cost of raw materials. The establishment of agreements or the emergence of conflicts between oil-producing and oil-consuming countries can influence the price of the commodity asset in the short term. The price of oil reacts clearly to an escalation of geopolitical tension, since large reserves of raw materials are concentrated in regions where local armed conflicts do not subside. Many examples can be given, but the freshest of them is the conflict in Libya. At present, an uneasy situation is developing in Iraq and Sudan, and indirect signs also point to possible disruptions in Nigerian supplies.
Amount of crude oil reserves. Information about the amount of oil reserves in a particular country periodically appears in the press and is capable of fundamentally changing the current rate. In the chart below you can see the change in the amount of oil reserves in the United States.
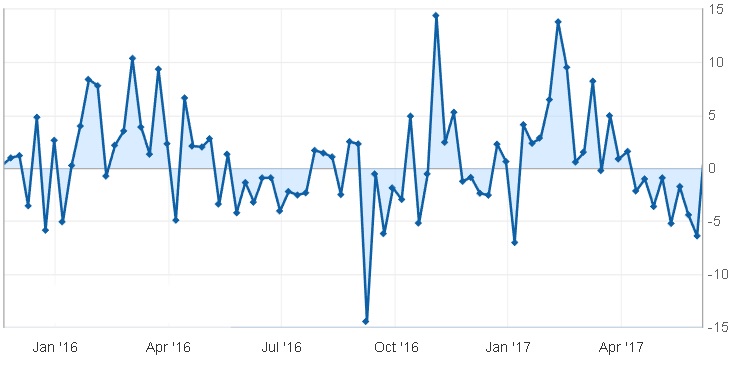 Such information should be used very carefully, since the fact of a decline in reserves over a week does not yet guarantee that demand for raw materials will increase, but recent years have shown that overstocking of storage facilities is always accompanied by a decline in quotes for "black gold", i.e. in the modern market it is the buyer, not the seller, who dictates the terms.
News background. It is necessary to carefully monitor the fundamental background: meetings of exporting countries, statements by individual officials attached to the energy industry, individual industrialists, as well as weekly reports on reserves in the US, the final summaries of which can be found here, and on the number of operating drilling rigs. OPEC reports and reports from the US Department of Energy have a considerable influence on the rate of oil and the US dollar. In addition, various reports should be treated very carefully, for example, on the number of drilling rigs in the US:
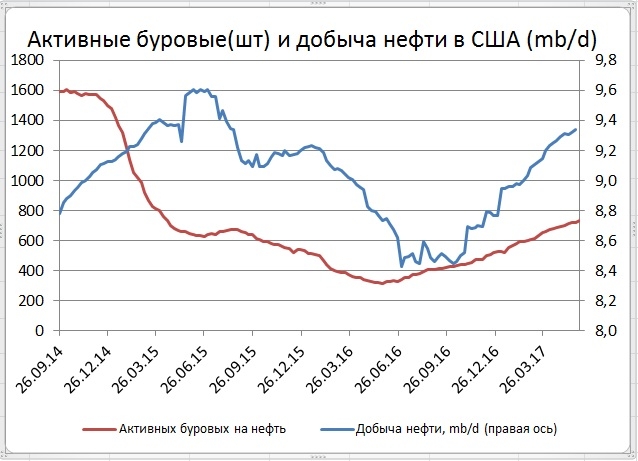 In addition, it is worth tracking supply and demand in the markets, and also monitoring trading volumes and inventories in the US.
Problems of refining and distribution. Both cost money, and the higher this price, the less profitable it is for the producer to extract oil, and the more expensive, and therefore less competitive, the final product becomes.
Growth rates of the global economies. The faster the economy of the US, China, and the whole world grows, the higher the demand for energy resources.
New technologies. The brightest example is shale oil production in the US, which increases supply and puts pressure on prices. Contrary to rumors about the high cost of this oil, at many fields it amounts to 40$ and even 30$.
The last group of factors includes various emergencies. These include fires on platforms and plants, storms in the Gulf of Mexico and the North Sea, conflicts in the Middle East, the imposition of sanctions on oil export/import, and others.
The main reasons for the fall in oil prices at the end of 2014 were not economic, but rather geopolitical preconditions. The leaders of Saudi Arabia - a country that possesses a quarter of the world's oil reserves - decided that a price of 120 dollars per barrel was too much. Indeed, in the late 1990s oil cost only 12 dollars, but a few years later oil prices unexpectedly jumped upward, to the displeasure of the leaders of Saudi Arabia, who believe that a barrel of oil should cost significantly less. To bring the price down, they began selling oil below market value, which led to a decline in its price. This played into the hands of the US, since this country is one of the largest consumers of oil in the world. Despite active development of oil fields, the US experiences a huge shortage of oil for the country's needs and therefore is forced to buy "black gold" from other countries. The decline in oil prices contributes to the US purchasing oil at the lowest prices, which cannot be said about Russia, whose economy directly depends on oil prices.
By the way, the powerful upward trend in the oil market that was observed from 2000 to 2008 was driven precisely by real physical demand for energy from China. Economists even came up with a special name for this period - the super-cycle.
Below you can see a chart of the correlation between the cost of Brent crude oil, the Dow Jones DOW 300 industrial index, and the DAX stock index:
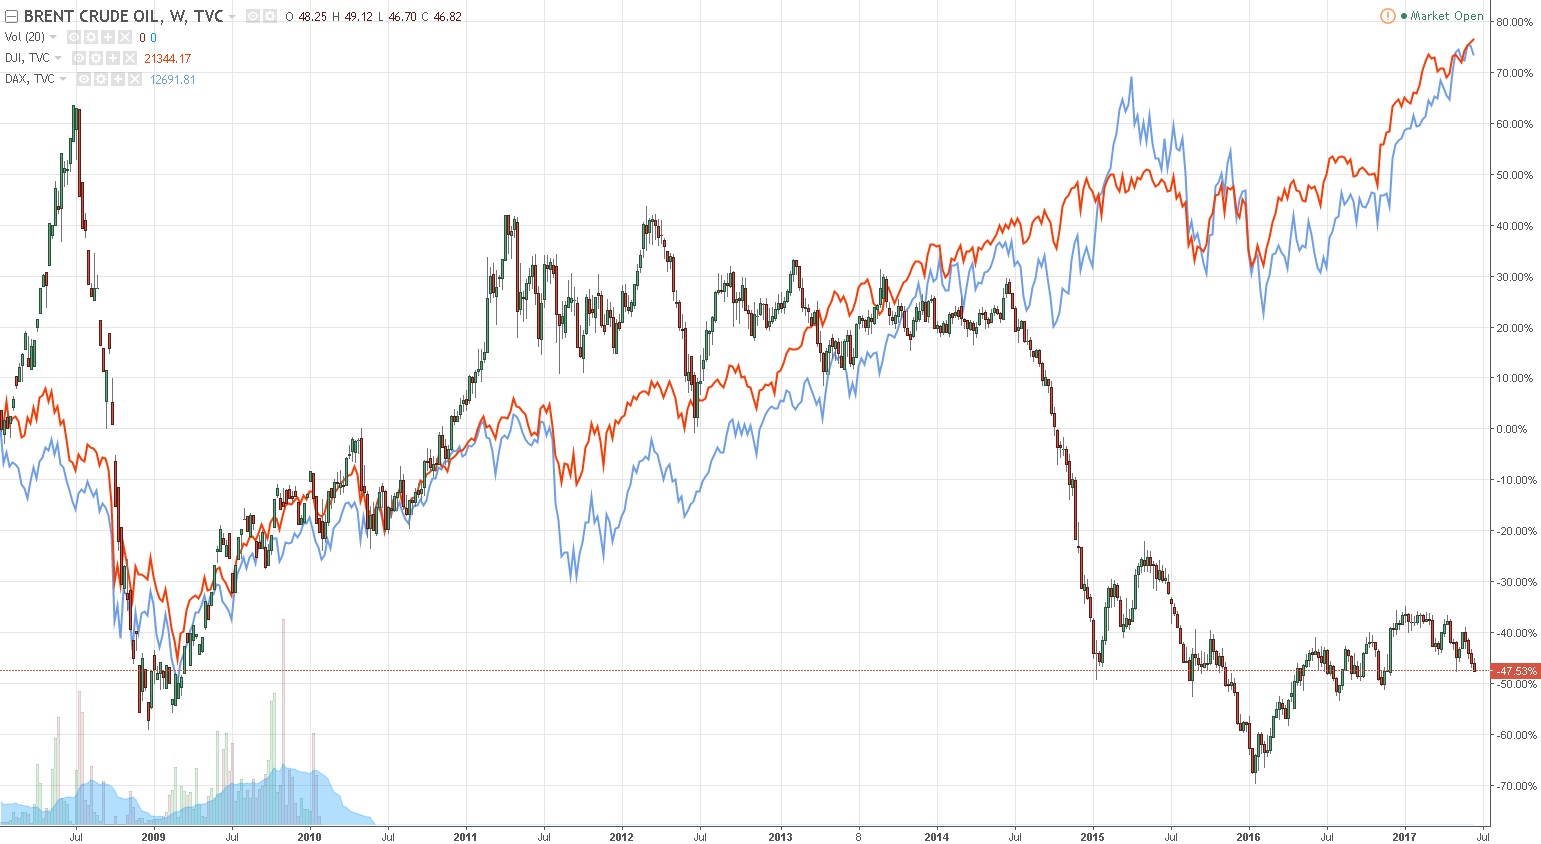 The chart is very interesting: it shows the correlation between oil prices and the state of the global economy. At the same time, it is clearly visible that since the end of 2014 this correlation has been greatly disrupted. This means that at the moment the main driver for oil prices is by no means the economy, but rather geopolitics. Nevertheless, before 2014, changes in the global economy almost always found their reflection in black gold prices.
The Relationship Between the U.S. Dollar and Oil

When trading oil, the U.S. dollar is used; all deals are concluded precisely in this currency. This is much more convenient and simpler. If various currencies were used to trade oil, traders and other exchange participants would need to perform many unnecessary actions. Today, oil can be regarded as an independent currency. And, as everyone knows, any modern national currency is equated to U.S. dollars. Thus, the euro relates to the dollar, various national currencies relate to the U.S. dollar, and it in turn correlates with black gold. The price of oil determines the change in the dollar exchange rate, national currencies, and the euro. Below is the EURUSD chart, on which I overlaid the WTI oil chart:
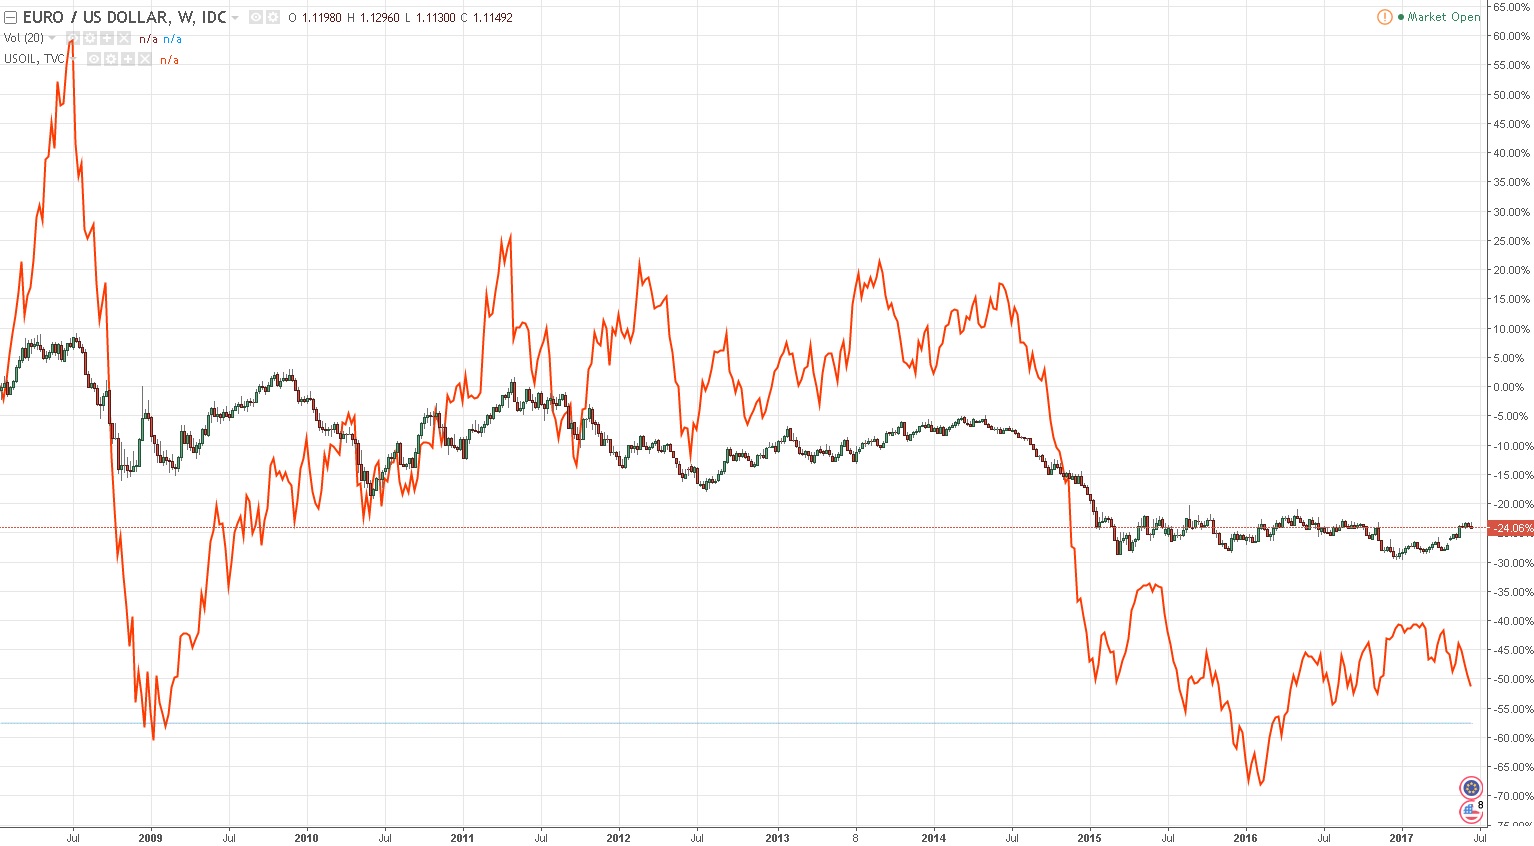 Quite often, price movements in oil value precede movements in the major currency pairs.
Volatility

Over the last 50 trading days, oil has shown average absolute daily changes of about +- 1-2%. This is significantly lower than last year. Comparing it with the moving average since 1983, we can say that from the end of 2014 to the beginning of 2016, when prices approached the very lowest lows, daily volatility spikes averaged about +- 4%.
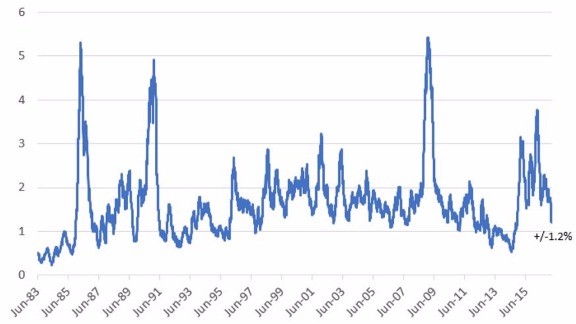 Thus, today volatility in the oil markets remains moderate, but it can change substantially at any moment as geopolitical processes in the Middle East and South Korea develop, Chinese productivity dynamics shift, Eurosceptic sentiment evolves, and as U.S. Federal Reserve policy relentlessly draws capital from emerging markets. Let us remind once again that in historical terms the average daily volatility of oil prices remains quite high.
Main Trading Strategies

If you are just beginning to get comfortable in forex, I do not recommend starting to trade oil. Black gold quotes are too dependent on many events, while these events are far from always connected with the economy. In order to trade oil successfully and make a profit, you must understand market sentiment and the geopolitical situation in the world.
Trading oil is a unique and highly specialized field that requires exceptional skills in order to build a system for obtaining stable profit from this type of activity. That is exactly why there are so few small speculators in this market.
The main indicators recommended for use when trading oil are: Bollinger Bands, MACD, RSI, Stochastic and others well known to traders.

An excellent complement to indicators will be the good old Price Action. Analysis of candlestick patterns, trend direction and strength, identification of support and resistance levels, trend lines and chart patterns will significantly improve your trading. In addition, oil charts are distinguished by prolonged, extended trends with a small number of pullbacks, as well as a rather small number of false breakouts.
The VSA method has also long proven itself as an excellent approach for trading futures and commodities. As we have already said, one of the effective trading solutions for working with oil is futures trading. Here VSA opens up new opportunities for the trader in oil deals. VSA also provides excellent opportunities for tracking leading trends in the market and for making further forecasts. Thus, you will be able to see the real volumes of closed transactions tied to price indicators.
Like all other commodities, energy resources are subject to the influence of seasonal factors. Let us recall that seasonality is understood as a set of phenomena and events leading to a predictable rise or fall in the price of the underlying asset over the time interval being studied. Many traders use this seasonality factor in their strategies or even build their strategies precisely on it. The chart below shows 15-year seasonality for Brent (red), 12-year (green), 10-year (light blue), 9-year (orange), and 7-year (ochre).
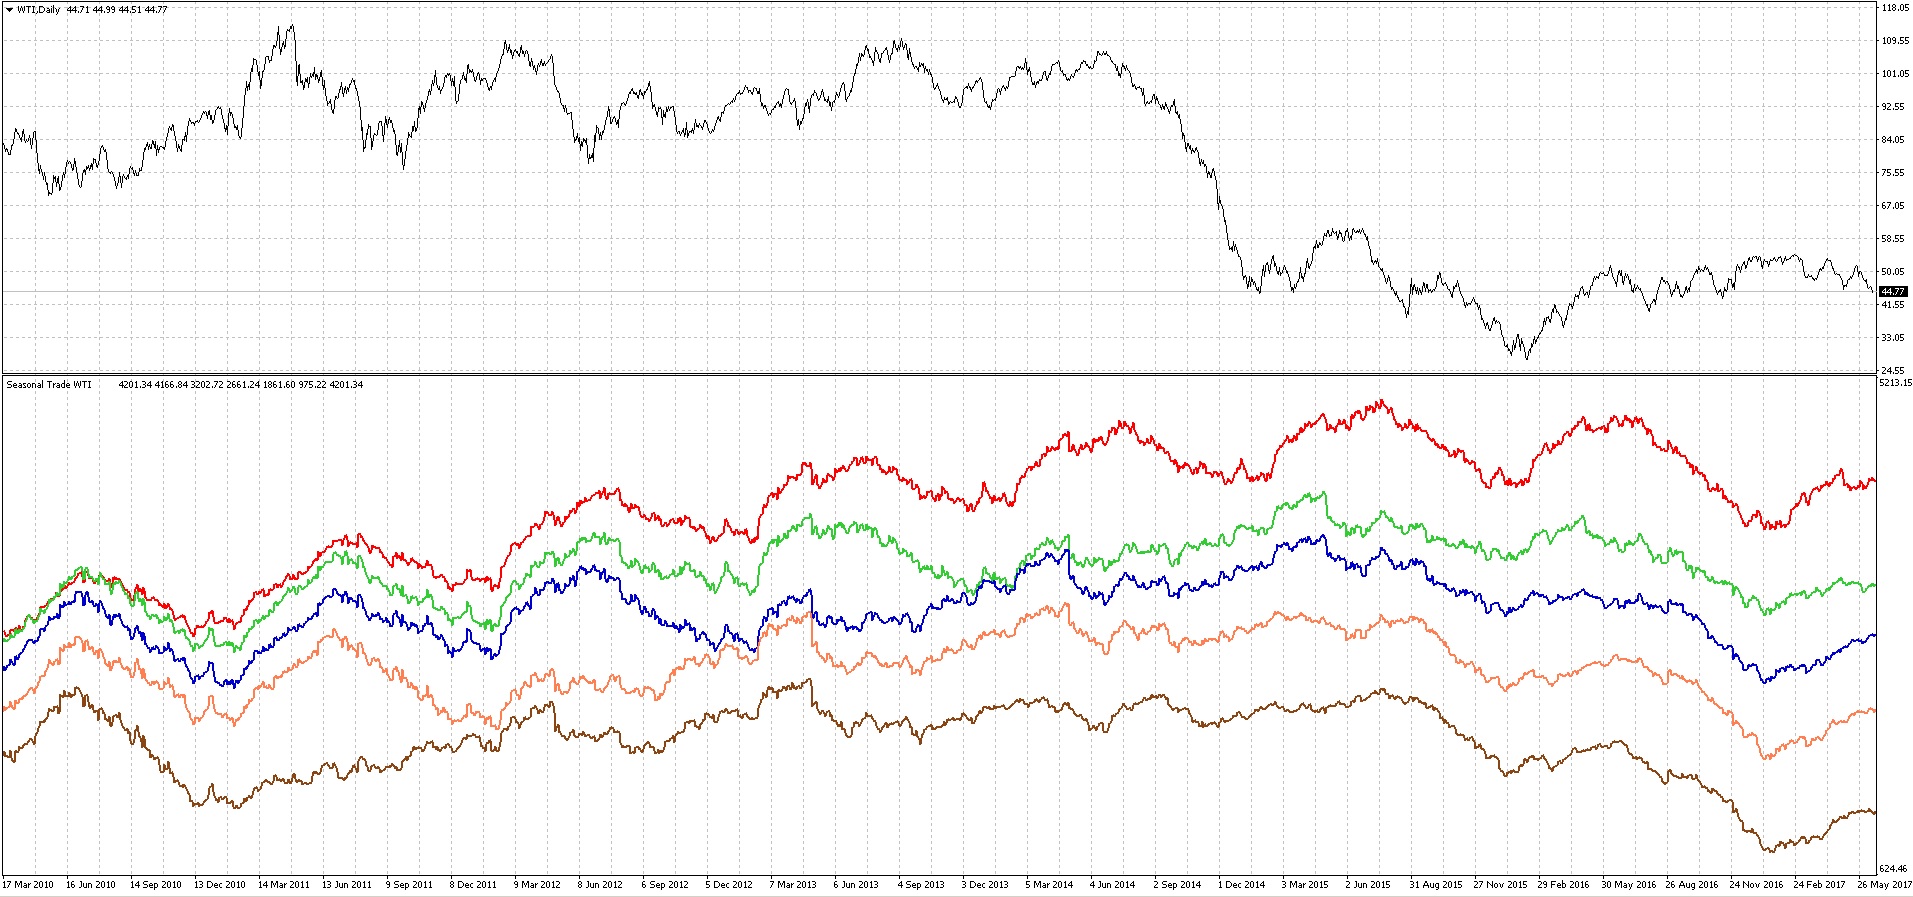 Since oil is used to produce energy, demand for it increases significantly in winter, that is, when severe frosts set in North America. It should be noted that in recent years this pattern has been showing itself more and more often; meteorologists have even introduced a special term into circulation, the polar vortex, which they used to describe the climatic phenomenon that brings severe cold snaps to the Great Lakes region. As a rule, such an impulse is observed in January and February and lasts at least until March. A similar picture is observed in heating oil, since it is this fuel that is used to heat private homes and industrial buildings, and is also used to generate electricity (in winter the night is much longer than in summer, and this factor also affects prices).
Then a decline occurs up to the summer months, when many people go on vacation and gasoline traditionally becomes more expensive. Together with it, oil also rises in price up to September. In September, oil usually begins to fall in order to repeat its traditional rise in the new year and repeat this cycle again. In this case, the tendency is explained by several reasons. First, demand for fuel falls, since the peak of the automobile season has passed and the most difficult agricultural work has been completed. Second, despite the fact that in the hot months the need for electricity for air conditioning increases, generating companies prefer to use not heating oil but gas, since in the U.S. it is relatively cheap and helps avoid problems with environmental monitoring. Third, the volume of supply of oil and oil products remains at a consistently high level, since in summer it is easier to extract and transport raw materials, especially in the Northern Hemisphere (U.S., Canada, the North Sea, etc.). On the other hand, demand is less elastic, since it depends on the dynamics of the entire global economy, so companies and factories often work for stock, that is, they pump energy resources into storage facilities.

This is seen quite well in the 15-year, 12-year, and 10-year data; it is worse in the 9-year and 7-year data, where the stronger influence of recent years is felt. Pay attention to how well the data agreed up to 2010-2012. After the first decade of the 21st century, which was perfectly suited to seasonal strategies, the situation with oil became aggravated and destabilized; new factors began to exert their influence on prices, and seasonal trading at the present moment is no longer as powerful a tool as it was before. Nevertheless, certain seasonal trends have remained to one degree or another, which is easy to notice on the presented chart. Such tendencies make it possible to identify the preferred direction for trades; in other words, if the long-term pattern contradicts the technical picture, it is reasonable to refuse speculative operations, but in the opposite case, that is, if technical analysis coincides with seasonality, the probability of the signal playing out increases significantly.
As was noted earlier, due to the impact on the sentiment of market participants and specific factors, the prices of different oil grades or petroleum products can diverge significantly.
Such a difference between the prices of related assets is called an intercommodity spread. Here it should be noted that this term has nothing in common with the usual difference between ASK and BID quotes, information about which can be found in the instrument specifications. Unfortunately, the capabilities of the MetaTrader4 terminal are rather limited and do not contain many functions available in popular exchange platforms, therefore the spread between oil CFDs has to be built using auxiliary indicators:
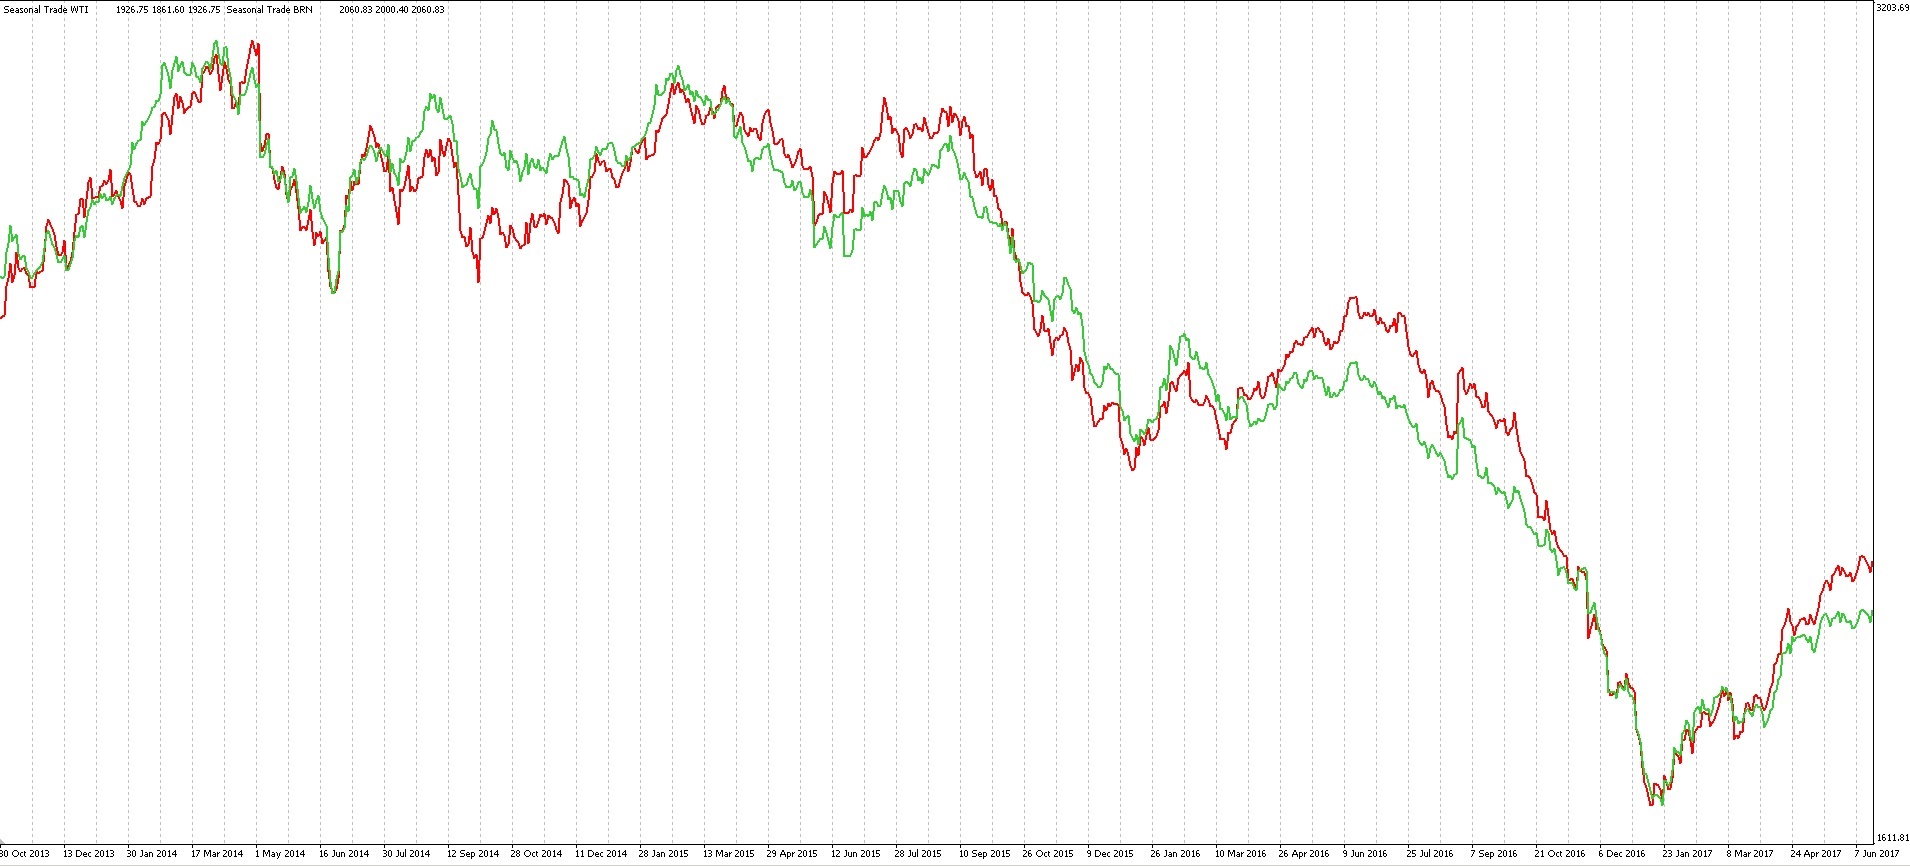 In the chart above you can see the prices of the two most popular grades, WTI and Brent. As can be seen from the chart, the quoted instrument prices diverge and then converge back again. This value, the distance between the prices, is commonly called the spread, and its chart can also be plotted:
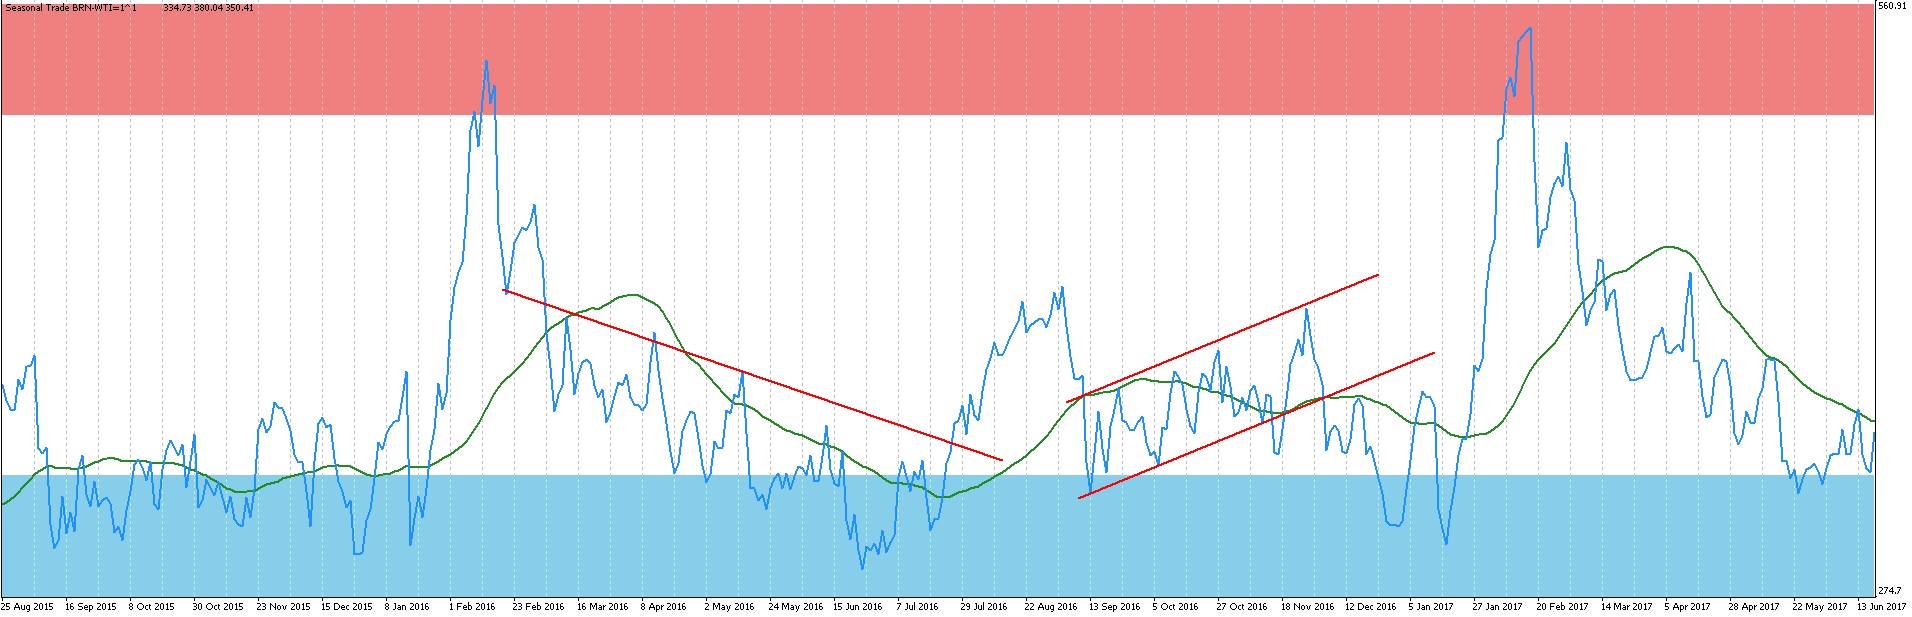 Spreads are traded in the same way as oscillators: trend indicators are applied to them, levels and trend lines are drawn, graphic patterns are sought, and so on. At the same time, a rise in the chart indicates that the spread between the grades is widening, and when the divergence becomes large enough (ideally in the red zone), it is worth entering a trade (in my case, buying Brent and selling WTI), while when the spread is in the blue zone, the trade should be closed.
In addition, when analyzing the spread between two oil grades (which effectively creates a synthetic Brent/WTI instrument), one can also be guided by seasonality. Moreover, seasonality is even more pronounced in this case:
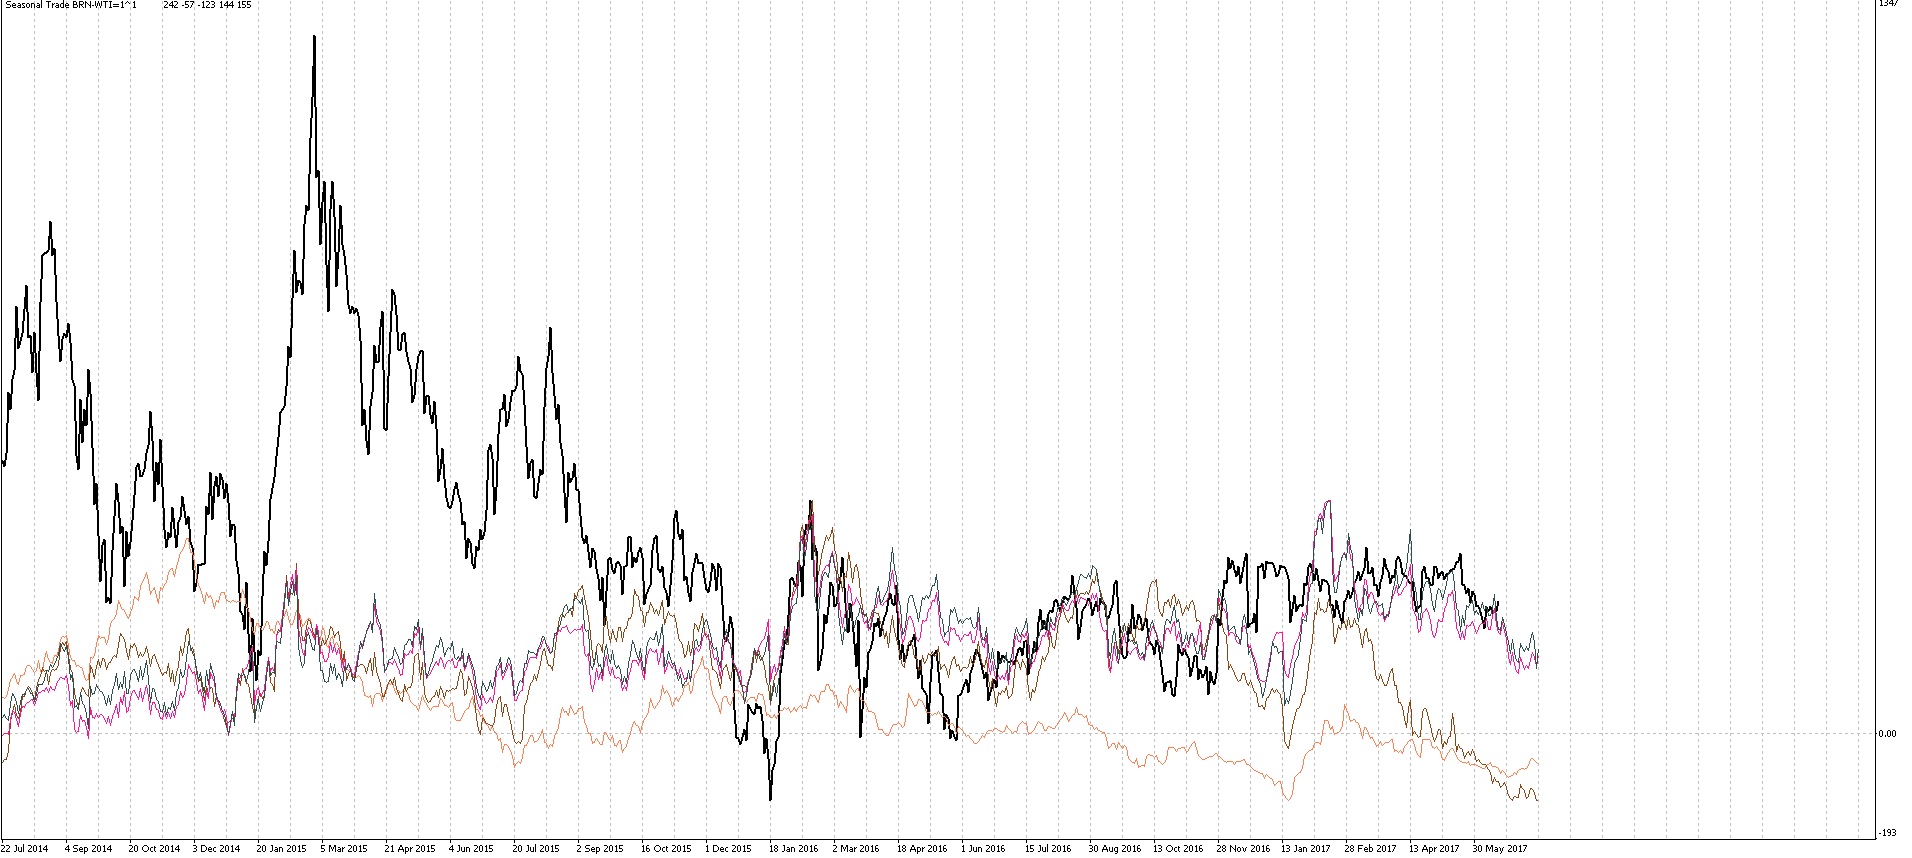 In the figure above, the actual spread is marked by a thick black line. The thin colored lines show the spread averaged over different numbers of years (from 15 to 3). Even with the naked eye, it is clear that quite a large number of tendencies repeat from year to year, which can also bring profit.
Here I would like to dwell in more detail on specific timeframes, since the spread behaves differently across different time ranges. The chart above shows the markup on D1, which is the classic spread-trading approach, because only on large intervals is an obvious fluctuation range visible.
This is due to the fact that the divergence between oil CFDs depends primarily on the situation in the Middle East and Africa; in particular, when geopolitical uncertainty increases, demand for Brent rises noticeably because energy supplies to Europe may be disrupted, while in North America the market functions normally, i.e. the need for WTI remains at the same level.

If we once again focus attention on the chart, we can notice that the spread grew significantly right after the operation in Libya, when the supply of oil in the Mediterranean basin shrank substantially. Further spikes were recorded during the escalation of the conflicts in Syria and Northern Iraq. Thus, if new hotbeds of tension emerge in Africa or the Middle East, it makes sense to buy Brent oil CFDs and simultaneously sell the same amount of WTI; such tactics make it possible to protect oneself from accidental speculative fluctuations, to which single contracts are vulnerable, since sometimes the fundamentals turn out to be stronger than geopolitics.
If we consider smaller timeframes, then in this case spread trades become riskier, since the ranges are broken more often, and sustained trends form on the synthetic indicator itself. Nevertheless, even in such conditions it is possible to earn money if decisions are made after analyzing important regional news. Here is a typical spread trade on small periods:
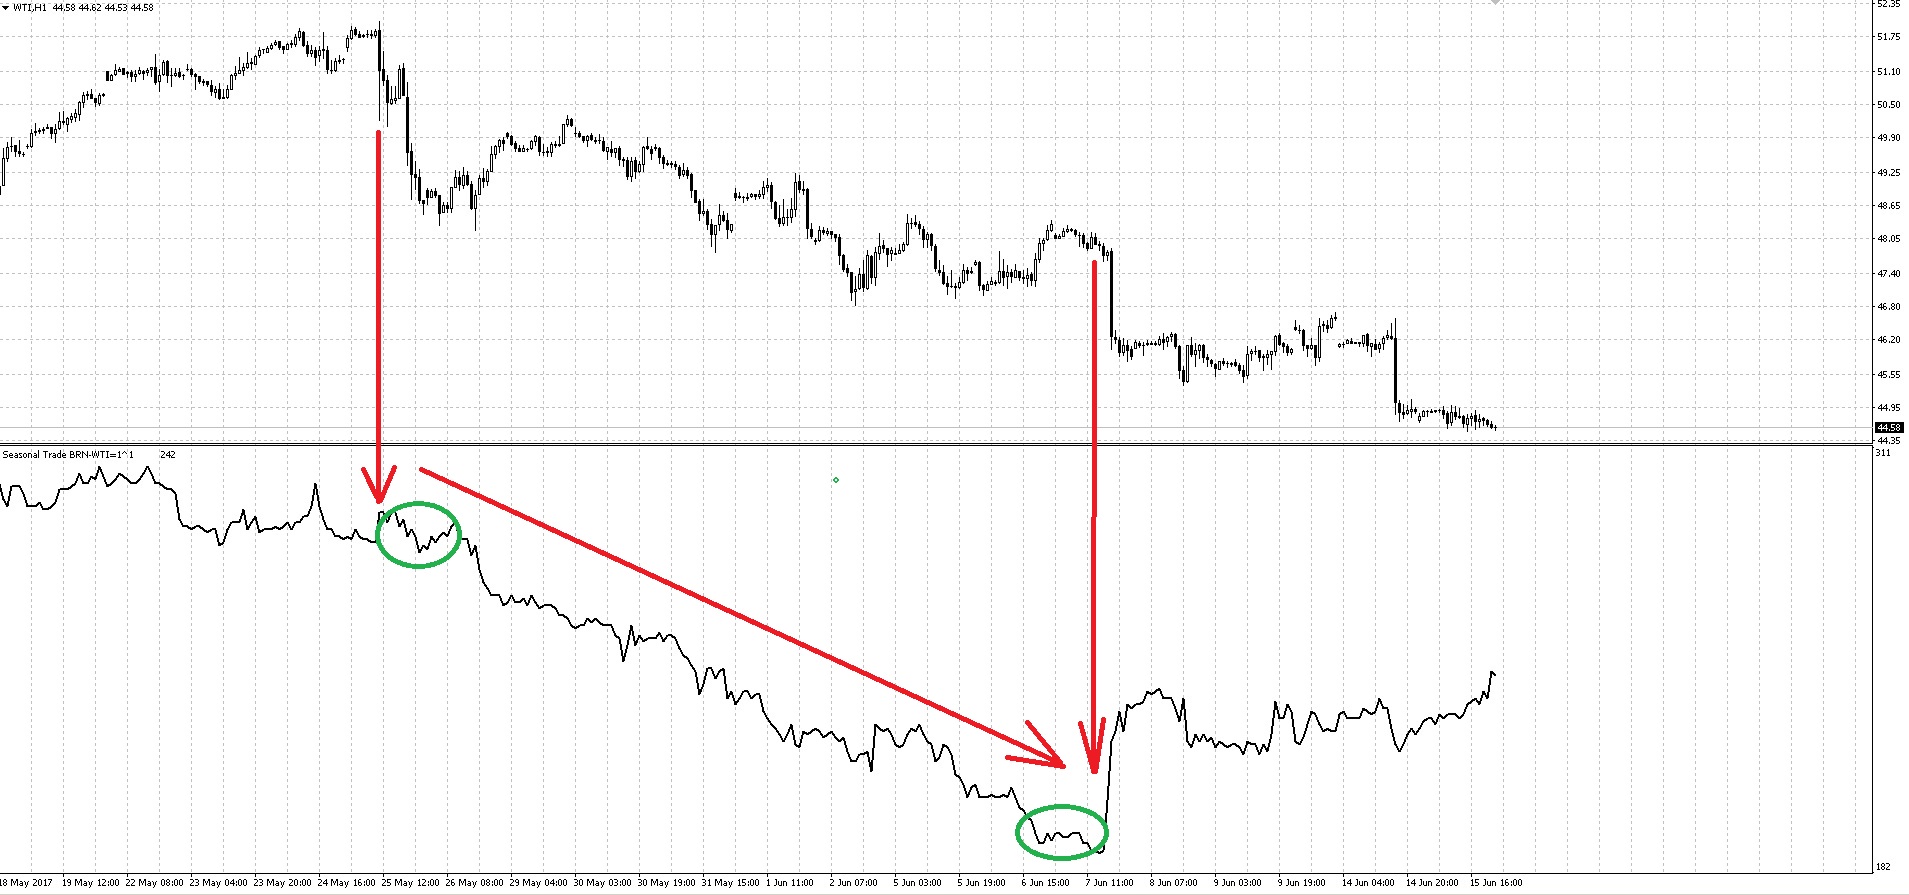 On May 25, 2017, the spread was in the upper zone, which indicated a trade opportunity. After GDP for the pound came out worse than forecasts at 11:30 and the market stopped storming, it was possible to enter the trade calmly, expecting the spread to narrow from 2.82 cents. As we can see, the spread chart continued to decline calmly, the news background was quiet, but on June 7, 2017, at 17:30, news on U.S. oil inventories was due to be released, which would most likely fuel a new move. And since we were already in profit and had no insider information regarding the upcoming news, we exit the trade when the spread reached 1.92$. As a result, we lost 0.2$ on two spreads, but earned 0.7$, or 70 points, on this trade.
And since the discussion has turned to spread trading in energy commodities, one cannot fail to mention the divergence between WTI oil and heating oil, since the latter in the U.S. is quite a popular raw material for heating and energy generation, as a result of which its prices respond more sensitively to seasonal consumer demand.
Conclusion

Oil as an investment asset is interesting primarily because of its high volatility. Due to the possible significant change in the oil price over a short period of time, it is possible to obtain high profits.
Oil CFDs, as we have seen, provide broad opportunities for speculative and investment decisions. At the same time, oil is the only commodity asset that is available in the product line of almost all dealing centers.
As for the advantages of oil contracts compared with currency pairs or other assets, it should be noted here that they are more predictable from the point of view of fundamental analysis, especially when it comes to intercommodity spreads.
Nevertheless, in order to trade oil successfully, considerable knowledge and experience are needed; besides that, one must stay aware of a very wide range of news and events from different fields.
Sincerely, Dmitry aka Silentspec TradeLikeaPro.ru