
How to test your trading system for stability

Hello everyone!
There is no shortage of information on the Internet these days, rather the opposite – unverified, incorrect information creates a whole problem for traders. People lose a lot of time and effort trading systems that do not deserve the effort they put into them. And now you have decided to test a popular TS found in the network, which is considered very profitable among traders. This article will help you thoroughly test your system for stability and be sure that the resulting robot will withstand all market storms.
What does this mean? For our trading system it means to continue to trade effectively under different market conditions, to adapt to their changes. Such a system should contain a clear and strict trading logic, while flexibly adapting to any market conditions, and its parameters should not be too rigid. In other words, your system should be robust.
What is strength

The picture below shows a silent fish. It is the most resilient creature on Earth and would survive even the end of the world. These distant relatives of crayfish and insects could survive in outer space and reproduce there in complete weightlessness, without food or water. They are not afraid of lethal doses of radiation, large asteroid impacts, supernova explosions and gamma-ray bursts.

Strength of a trading system is its ability to remain effective in different markets and under different market conditions. There are several types of TS strength: working period strength, seasonal strength, market phase strength, instrument strength, optimization strength, parameter strength, portfolio strength. Next, we’ll look at all of them in detail.

Strength by market phase

Strictly speaking, there are two types of market phases – general and strategic. The general type is determined by the presence of a trend and the level of volatility of the instrument.
If a trading system passes any market phases on tests, it can be considered robust with respect to market phases. This is the most important type of durability – because if the system will work well in a trend, but drain all the earnings in flat, there will be little sense in such a system. In the picture below you can see six conditional market phases for which it is worth testing your system.
The second type of market phases is strategic. It is connected with foreign and domestic policy of those countries, which form a currency pair and its influence is sometimes very great. A banal example is the Swiss franc, which changed a lot after the Swiss National Bank significantly lowered interest rates and abandoned the exchange rate limit of 1.20 per euro, which it introduced in September 2011 in an attempt to prevent deflation and further appreciation of the currency.
Ideally, of course, the system should not lose money during any of the market phases, but this rarely happens. So the maximum goal here is to lose relatively little in any of the phases. Does it mean that if your system is not strong in market phases, you should abandon it? Of course not, because there are many systems designed for trading in a particular phase. The most important thing in researching the effectiveness of your trading system in relation to market phases is to identify the phases in which it is highly undesirable to trade it and in the future refrain from trading in such periods or switch to trading systems that are more appropriate for the current phase.
Seasonal Strength

Seasonal strength is the ability of a system to remain equally effective regardless of seasonal effects in the markets. In principle, one could include seasonal robustness in the group of robustness by market phase, but I have separated it out.
Seasonal effects, recurring from year to year, undoubtedly exist in markets. They are most often connected with economic phenomena, natural behavior of people, and peculiarities of state economies. For example, due to the fact that oil oil is used for energy in the USA, the demand for increases significantly during the winter period, i.e. when there are severe frosts in North America. Oil is indeed closely linked to the dollar, which means that all seasonal anomalies in oil are reflected in the dollar and, consequently, in most currency pairs.
But seasonality can also be less short-term. Sometimes there are very interesting anomalies in the trading statistics, for example, very low efficiency of the system on Mondays or at certain hours of the day. It is also not uncommon for the system to perform poorly at the beginning or end of the month.
In most cases, all of these anomalies are easily explained. For example, markets are more active at certain times of the day and less active at other times of the day due to the opening and closing of certain trading floors around the world. You all know that the Asian trading session is the quietest. Or, for example, everyone knows that trading is especially quiet on the first Friday of the month because of the upcoming Non-Farm Payrolls.
All these patterns can be easily tracked in myfxbook or any offline program for analyzing statistics. Your task in this case is to identify such moments and take them into account in further work. It should be remembered that seasonal effects are unstable and over time they appear or disappear. This is due to the fact that market participants are constantly trying to use these or those seasonal patterns in their favor and this, of course, affects the overall picture.
For example, night scalpers have been working very well since the middle of 2016, but at the moment we see volatility quite high for such time of day, which makes the work of night scalpers not so effective anymore. It will take a little more time and the effectiveness of such strategies will completely disappear and people will stop using them. Then the market will probably discover this inefficiency again after some time and people will rush to use it again, until everything will be repeated in a circle.
Durability by working period

A trading system remains robust by period if it trades efficiently on different timeframes. There can be two options here – either our strategy works fractally, or it simply remains insensitive to market noise when the period decreases.
The concept “fractal” has many different meanings, but in this case I mean self-similarity. That is, when the system is based on a certain figure or pattern, which works equally well on any period. An example is Elliott Waves – it is considered that they can be used on any period.
In general, there are very few such trading systems, so the second variant, when the system is insensitive to noise, is more suitable for us. It is believed that the lower the period, the more noise and more difficult to trade. Therefore, every trading system has a certain minimum threshold, a minimum timeframe, at which the system is still quite effective.
And our task here comes down to determining this minimum period and trading on it, because the smaller the period, the more trading opportunities, more trades and higher profits. Besides, with the decrease of timeframe the stop loss level decreases, which means that you can manage risks more flexibly and drawdowns will be lower and shorter. If your system works equally well on H4 and on H1, but on M30 is already bad, you should definitely choose H1.
But here, as everywhere, it is important to stop in time. If your system trades well below the H1 period, for example, on M15, you should be especially careful, because when testing on such small periods, there are many factors that can significantly distort the final result.
If your system is not strong on timeframes, it is not very bad. It is only important to determine the period of work on which the system is as strong as possible to the market phases.
Strength by instruments

A trading system is strong by instrument when it shows positive results on a wide range of trading instruments. The fact that your system trades EURUSD, USDCHF, AUDUSD, and USDJPY equally well means that you have found a global inefficiency in the market. And it is like a huge diamond – it is as durable as it is rare. In fact, most strategies don’t have this type of durability, working efficiently on some instruments and earning almost nothing or even losing on others.
So instead of trying to create a one-size-fits-all system for any instrument, it’s worth focusing your efforts on finding inefficiencies on a specific instrument. You’d rather have multiple systems, each of which is great for a couple or three currency pairs, than one system that trades poorly on all of them.
Optimization Robustness

A trading system is considered robust on optimization when its parameters on the forward test remain within the parameters obtained during the optimization period. Surely many of you have tried to optimize Expert Advisors. It often happens that one or another forex robot shows excellent results during the optimization period, but finding the right settings that pass the forward test period turns out to be a problem.
In this context, all we can do is to always use forward testing to avoid adjusting to the history and to make sure that the system parameters on the forward test do not deviate too much from the system parameters during the optimization period. In case the system does not pass the forward test, it is worth refusing to use it on a particular currency pair.
To solve this problem more thoroughly, a technique called Walk Forward Optimization has been invented. Its essence is to break the whole history into pieces in a certain way, as shown in the figure:
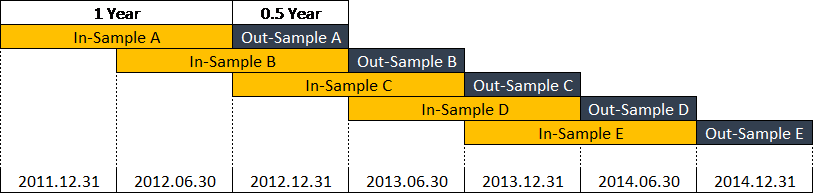
That is, we perform optimization on chunk A, then perform a forward test, repeat on the second chunk B, and so on. The main purpose of this convoluted exercise is to test how the system behaves in an unknown “territory”. If the system on all pieces of forward tests shows statistics similar to the one obtained during optimization, it means that the system is robust by optimization and the probability of fitting its parameters to the history is rather small.
Strength by parameters

A TS is considered robust in terms of parameters if a small change in the system parameters (within 10-20%) does not lead to fatal consequences. In other words, if you changed the period of moving average in your system from 24 to 20 and it drained your deposit, it cannot be considered strong by parameters.
If this happens, such a TS will be very sensitive to adjusting the settings to the history. And you should not use such a strategy – there is a high probability of losses on a real account.
The practical application of this knowledge is as follows. You can easily run optimization of each parameter of the system and see how much its change affects the results. After identifying all such parameters, run their overall optimization and look at the results. If most of the results (between 50-70%) turned out to be profitable, then everything is fine. If most of the sets of settings are draining, then, most likely, this system is too sensitive to changes in settings and you should either try to modify it or throw it away.
When working with MetaTrader 4, you can switch to the “Optimization Chart” tab to the “Two-Dimensional Surface” mode and evaluate the distribution of the two selected values:
The figure above shows a system with good robustness to the selected parameters. Each rectangle is the ratio of the two parameters. The higher the gain on a set of settings, the deeper green the rectangle is. The results are distributed fairly smoothly over the entire area. As you change the settings, the change in profitability is also quite smooth.
When looking at this surface, it is worth treating it as a topographic map. The greener the color, the higher the rectangle is relative to zero profitability. Here’s how it might look like in 3D:
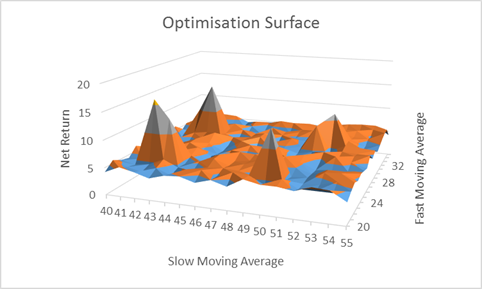
The Net Return axis, the total return, is the height. The other two axes are the parameters being optimized, in this case moving average periods. The highest points on this graph on the surface from the previous example would look like single rectangles in deep green. And this is the optimization surface of a bad system. And here’s the good system:
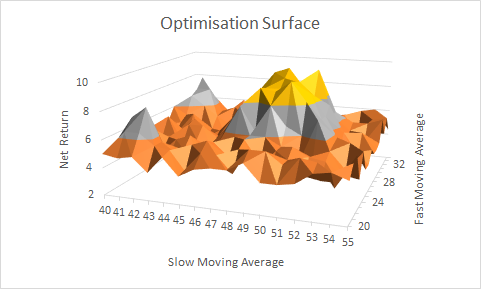
Here the peaks no longer have such a sharp shape, but are more evenly distributed in space. These are also called flat peaks.
In this context, your main task is to check whether all peaks on the optimization surface of your system are flat. Otherwise, it risks over-optimization and fitting to the market.
There is another, more reliable, but also more time-consuming method proposed by Van Tharp. Its essence boils down to the calculation of the so-called quality number of the system, determined by the formula:
SQN= Squareroot (N) Average (of the N Profit&Loss) / Std Dev (of the N Profit&Loss), where:
Average (of the N Profit&Loss) – average deal on the system,
Std Dev (of the N Profit&Loss) – standard deviation from the average deal,
N – total number of deals in the test.
Thus – for each combination of the two parameters under study you should calculate the SQN and find the average value of the SQN. It is considered that the value should not be lower than 2.5. You should get something like this if you use a spreadsheet to analyze the results:
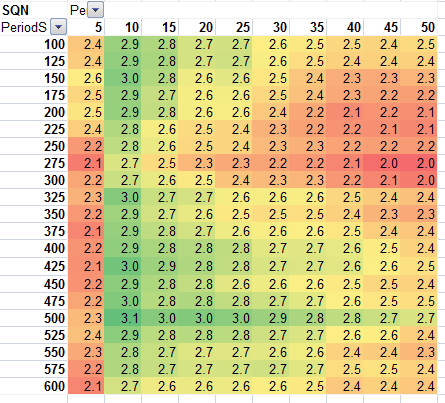
When you use the color formatting of the cells, you can see how smoothly the results are distributed, which combinations of parameters are optimal, and how robust the system is in general to changes in the selected parameters.
A small trick – in order not to count this parameter manually, you can calculate it in the OnTester() function and then, after optimization, take the ready values from the “Optimization Results” tab from the “OnTester Result” column.
Conclusion

With this article, I have introduced you to the main types of stability or strength of trading systems. If you follow these guidelines, your strategies will show better results, or at least you will significantly reduce the probability of losses. The described criteria of strength are not the only ones for selecting a profitable TS, by the way.
In fact, it is only one of the criteria, but it is the most important one. It will not help you to select the best and most profitable strategy. But, guided by all the techniques in this article, you will be able to select the most stable, the most survivable TS, which, as a silent walker, will have the maximum possible margin of safety and will please you with profit for a very long time.
Good luck and see you soon!