
How to Test an Expert Advisor in the MT4 Strategy Tester - Detailed Guide

Hello everyone! Mechanical trading systems are as old as the markets themselves. With the development of computer technologies and the internet in the 20th century, it became possible to trade without leaving home, and at the beginning of the 21st century, with the appearance of the MetaTrader platform, also in automatic mode. The resources of a modern desktop computer make it possible to bring to life any, even the most complex algorithms, and the MetaEditor editor built into the MetaTrader terminal makes it possible to write a robot even for a person who is not very familiar with programming. As a result, the forex-adjacent market is filled with various offers to buy miracle expert advisors, and some of them are really worth attention. But how can you understand whether it is worth using one or another forex expert advisor on real accounts? Today I will explain how to test a trading robot on historical data using the MetaTrader 4 program.
Preparing for testing
Today we will not go over how to install an expert advisor in the terminal - there is a corresponding article in the blog for that. We will assume that we have already installed the expert advisor. Now you need to think about the quotes you will use. Most brokers do not have their own historical database; the exceptions are Alpari and Ducascopy, while the rest use quotes provided by MetaQuotes. I cannot say that these quotes are suitable for tests at all - they are of very low quality (many gaps, mistakes, and inaccuracies). How to download quotes from Ducascopy is a topic for a separate article, and besides, it is not so easy for a beginner to do. Therefore, for expert advisor tests we will download exactly the terminal from Alpari. Attention! To get access to the historical Alpari quote database, in the terminal you must be connected specifically to a real account! Recently this broker no longer provides its quote database to demo account holders.
It is precisely because of differences in quotes that tests of the same expert advisor on the same pair with the same settings and all else being equal will most likely differ, sometimes very strongly.
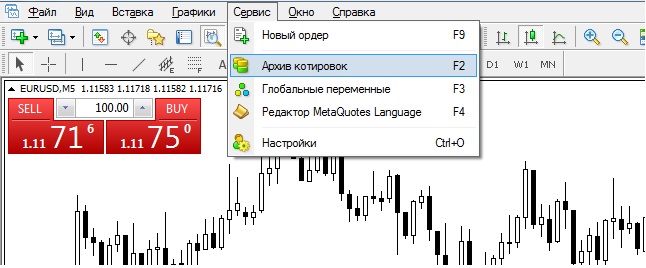
To begin with, we need to configure a few things, so go to the Tools -> Options tab or press Ctrl+O
A window with the terminal settings will appear:
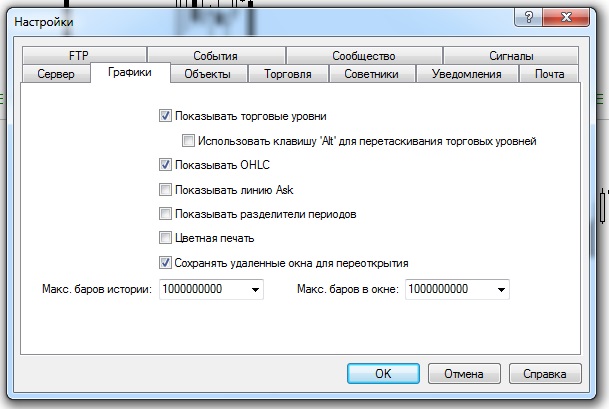
Select the "Charts" tab and fill in the "Max. bars in history" and "Max. bars in chart" fields the same way as in the picture above (by default it is set to 65000 bars).
In order for quotes for the pair we need to become available in the terminal for testing, open the Tools -> History Center tab or press F2.
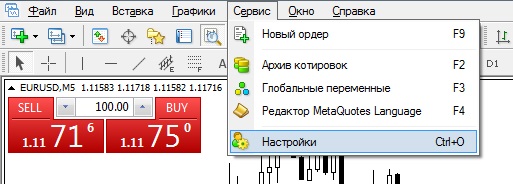
The following window opens:
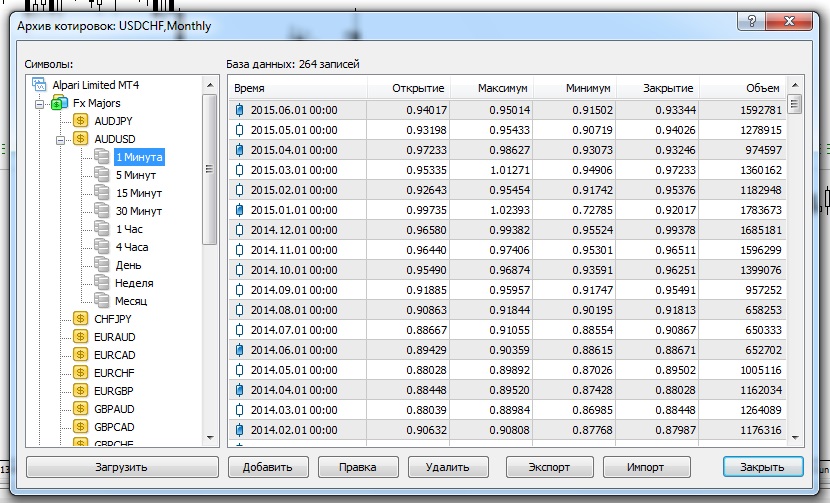
Select the pair you need and the M1 period and click the "download" button. After some time the quotes will load; turn off the terminal and turn it on again. Go back to the archive and left-click several times on the M1 period of the pair you need until the gray battery shown before the period lights up yellow-green. All that remains is to click through the other periods so that quotes are calculated for them as well. If you want to test the expert advisor on several currency pairs, download the quotes for the required currency pairs. Close the terminal and open it again. Then enter the quote archive again and go through all periods of the pair you need, pressing the left mouse button several times on each of them. All these shamanic actions are needed in the latest terminal versions, because quotes are often loaded incorrectly. This completes the preparation stage.
Terminal tester. Main functionality

So, to start testing the expert advisor, open the strategy tester or press Ctrl+R.
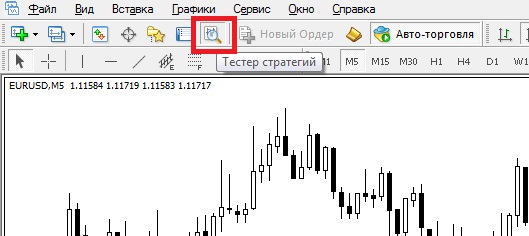
This panel will appear at the bottom of the terminal:

Let us go over each function in more detail.
The first thing you will see at the top left of the panel is the expert advisor-indicator switch:
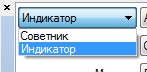
In the new terminal builds, the ability to look at an indicator's operation in visual mode has appeared (which will be discussed below). It must be said that such an option existed before as well, but unofficially. Now a separate button has been allocated for testing indicators.
So, select the expert advisor.
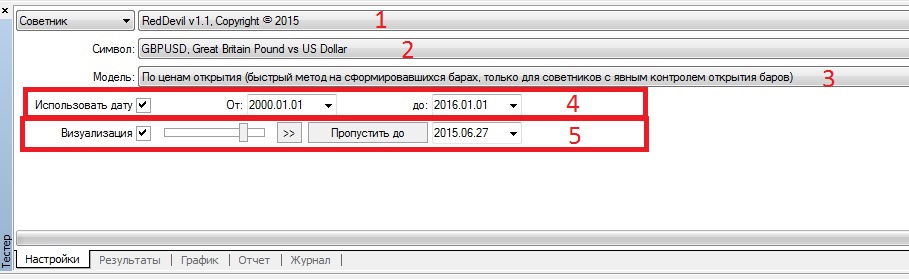
Under number 1 we have a drop-down list with expert advisors available for testing. Here you will find only those expert advisors that are loaded into your terminal. Number 2 is a drop-down list of currency pairs, choose the one you need. Do not forget to download quotes for it into the quotes archive. If you suddenly could not find the pair you need in the list, although you are sure that it is available for trading with the broker, turn on Market Watch or press Ctrl+M:
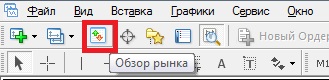
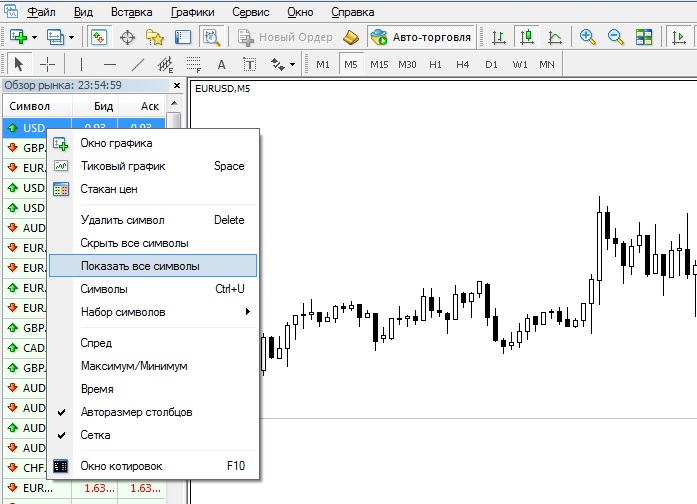
Then right-click directly in the navigator window and click "Show All Symbols":
Let us dwell on point 3 in a little more detail. Here we can choose the testing model we need. For high-quality testing of a trading strategy, it is important to choose an adequate way of modeling the development of price bars. There are three options available in total:
- Open prices only (a fast method on formed bars, only for expert advisors with explicit control of bar openings)
Uses a rough estimate of the strategy. Only one tick is generated for each candle. The advantage is that it is the fastest way to check. In this mode, the opening of the bar is modeled first (Open = High = Low = Close, Volume=1), which makes it possible for the expert advisor to accurately identify the end of the formation of the previous price bar. It is on this emerging bar that the expert advisor test is launched. At the next step, the already fully formed current bar is issued.
- Control points (a very rough method based on the nearest smaller timeframe, the results cannot be taken into account)
The control points modeling method is intended for a rough evaluation of expert advisors trading inside a bar. This method requires historical data from the nearest smaller timeframe. In some cases, the available data of the smaller timeframe do not completely cover the time range of the timeframe being tested. In the absence of data from the smaller timeframe, the development of the bar is generated on the basis of predefined wave patterns.
As soon as historical data from the smaller timeframe appear, interpolation is already applied to these data. However, the exactly existing OHLC prices of the smaller timeframe act as control points. In most cases, the results of testing expert advisors by the control points method can be taken into account only as indicative, and not as final. Such results have an intermediate evaluative nature.
- Every tick (the most accurate method based on all available smaller timeframes)
This mode allows the most accurate modeling of price movement inside a bar. Unlike "control points," the tick-by-tick method uses for generation data not only from the nearest smaller timeframe, but also from all available smaller timeframes. At the same time, if data from more than one timeframe simultaneously exist for some time range, then data from the smallest timeframe are used for generation. Just as in the previous method, control points are generated on the basis of OHLC data of the smallest available timeframe. To generate price movement between control points, interpolation based on predefined patterns is also used, therefore it is highly desirable to have minute data covering the entire testing range. A situation is possible when several identical ticks are generated in a row. In this case, duplicate quotes are filtered out, and the volume of the last of such quotes is recorded.
When testing on every tick, the volume of generated ticks can be quite large, therefore the terminal can consume quite a lot of resources.
For testing an expert advisor, we always choose the every tick method. Yes, it is the slowest, but also the most reliable method. Many use bar close control in their expert advisors, that is, they deliberately wait for the moment a new candle opens and orders are opened only at that moment. But expert advisors often use stops, takes, and trailing stops that can trigger at any moment inside the candle. The open prices method can be used only for expert advisors that do not use trailing stop, stop loss, and take profit, and open and close positions at the moment a new candle opens, and there are extremely few such expert advisors.
Point 4 is use date. Tick the box and choose the desired testing start and end dates. If the box is not ticked, testing is carried out on the entire quote history loaded into the terminal. The tester will not be able to carry out testing on a period for which there are no quotes in the quotes archive, that is, you will not be able to make a test from the year 1300 if you do not have quotes for that period.
Point 5 is visualization, which we will talk about later.
Settings on the tester panel on the right:
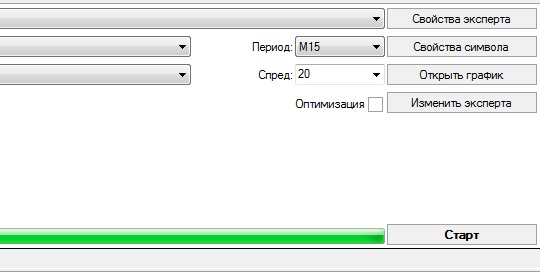
Period is the choice of period for testing the expert advisor. Periods up to D1 are available. W1 and MN1 are unavailable for testing. In addition, if you do not have the quote history of the needed period loaded, you will not be able to perform the test.
Spread means you can set any value or use the current spread for the pair. This is done for convenience, for example, at night and on weekends the current spread is usually inflated and if you are testing an expert advisor at this time it makes sense to set the spread manually. If you have the current spread selected, the test results can differ greatly depending on the time of day and the day of the week, especially when testing on every tick.
The "Modify Expert" button is available only if you have the source code of the expert advisor (a file with the mq4 extension). It opens the expert advisor code editor, where you can make the necessary changes to the expert advisor.
The "Open Chart" button opens a chart with the indicators applied to it and the trades made by the expert advisor during the test (you can click it after the test has been completed).
The "Symbol Properties" button
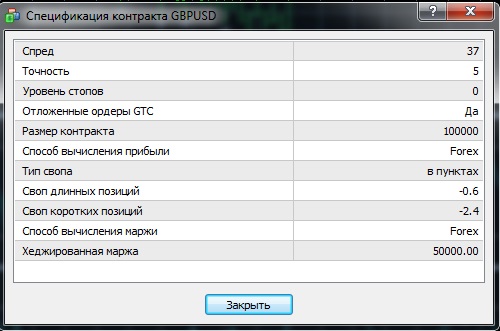
Nothing can be changed here, this is simply reference information about the currency pair being used.
The "Expert Properties" button
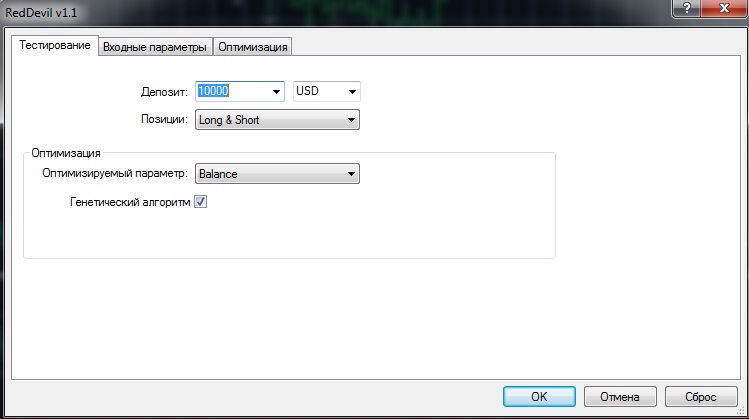
By clicking the button, you will see the window shown above. Three tabs are available: "Testing", "Inputs", and "Optimization".
The "Testing" tab.
Here you can enter the deposit used for the test and the deposit currency. If desired, you can also choose the trade direction, for example allow the expert advisor to trade only buys or only sells. The optimization settings within the framework of this article will not be considered. Just like the "Optimization" tab.
The "Inputs" tab
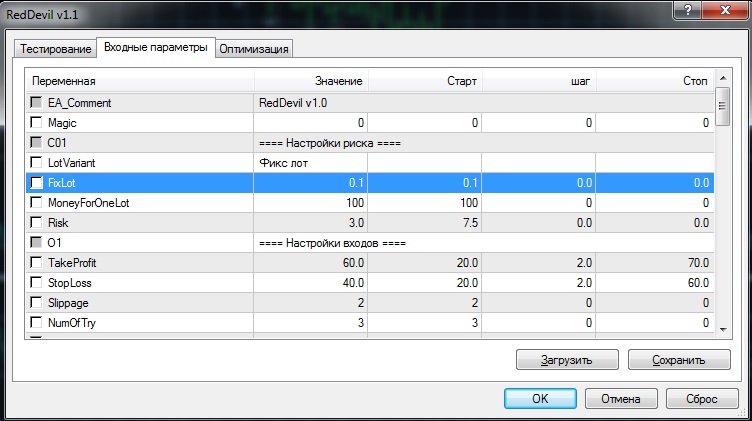
Here are all the control variables of the expert advisor itself, its settings. By the way, the window is resizable: if you drag the lower right corner with the mouse, you can enlarge or reduce its size. As a rule, expert advisors are usually supplied with settings files that have the *.set extension. Moreover, most often there is a separate settings file for each pair. To load the correct settings for the desired pair, click the "Load" button and select the needed file. Often after installing the expert advisor into the terminal, they end up in the wrong folder. After clicking the "Load" button, we end up in the tester folder (for me this is C:UsersSilentspecAppDataRoamingMetaQuotesTerminalFE03BE71CD8F9E8F4C70E0FDAFC997E5\tester). If the needed files are not there, go to the FE03BE71CD8F9E8F4C70E0FDAFC997E5MQL4Presets folder, most likely the files are there. So, select and load the required settings file. After loading, we need to find the money management parameters of the advisor and set a fixed lot of 0.1 - in this case each dollar of profit or loss will equal 1 old point. Why this is needed - I will explain below.
Testing the expert advisor. Test results
Now everything is ready for the test. Check the settings once again and click the "Start" button. After some time, the test will be completed, and we will be notified by a sound signal similar to the one made by a rubber children's toy with a squeaker.
It is time to look at the lower left corner of the tester:
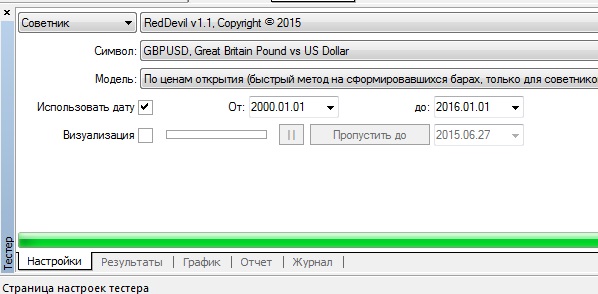
Here we can notice the "Settings", "Results", "Graph", "Report", and "Journal" tabs.
In the "Results" tab, a list of all trades made by the expert advisor during the test is available.
On the "Graph" tab, you can admire the expert advisor's equity curve.
If the expert advisor did not make a single trade, it is worth looking into the "Journal" tab. There you will find a description of everything that happened during the test. It is quite possible that there is some error in the expert advisor. You can see the explanation of the error number in the Error codes section.
In the "Report" tab, all statistics on the expert's performance over the selected time period are available:

Bars in history - the number of bars in the history, shows the depth of the history on the basis of which the modeling was performed.
Ticks modeled - the number of modeled ticks, shows the size of the modeled sequence. Each record in the sequence represents the state of the bar (OHLCV) at one moment or another in time. Depending on the timeframe, the modeling method, and the availability of historical data from lower timeframes, a different number of bar states can be modeled within the bar.
Modeling quality - modeling quality.
Chart mismatches errors - errors that occur when modeling ticks across different timeframes. If there is even one such error, delete the entire history from the terminal and download it again. You can delete it like this: File -> Open Data Folder -> A window with the terminal folder will open - > history folder -> Select the account type we need (the one you are currently using) -> Close the terminal and delete all files with the *.hst extension. Then download the quotes again in the quotes archive.
A panel with a quote quality indicator (mine is green, so I found an example on the internet):

Gray indicates missing quotes, red indicates quotes for the current period only, green indicates quotes are available for previous periods as well, and the brighter the green, the more lower timeframes are available. When the M1 period is available, the indicator will look like mine, bright green.
Initial deposit is the deposit with which the testing was carried out.
Spread is the spread with which the testing was carried out.
Gross profit is how much was earned in total during the expert advisor's operation.
Gross loss is how much was lost in total.
Net profit is the profit earned by the expert over the specified period. If the test is done with a 0.1 lot, then this profit in the deposit currency is equal to the number of old points earned. The same is true for all other parameters specified in currency. Net profit = Gross profit - Gross loss.
Profit factor shows the ratio between gross profit and gross loss. It is calculated using the formula Profit factor = Gross profit / Gross loss.
Expected payoff is the mathematical expectation of profit.
Absolute drawdown is the difference between the initial deposit and the lowest balance value during testing.
Maximum drawdown is the maximum difference between one of the local upper peaks of the balance change chart and the following lower peaks.
In the following figure, the numbers show the main stages of changes in the maximum drawdown value during testing. The final maximum drawdown value is highlighted with thick arrows.
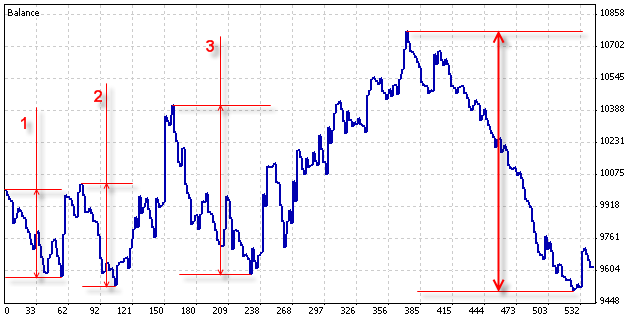
Relative drawdown shows the ratio of the maximum drawdown to the value of the corresponding local upper peak.
I think the remaining test data, such as the average profitable trade, the maximum number of consecutive losses, and so on, are quite understandable and do not need explanation here.
If you right-click on the report, you can save this report as an html file:
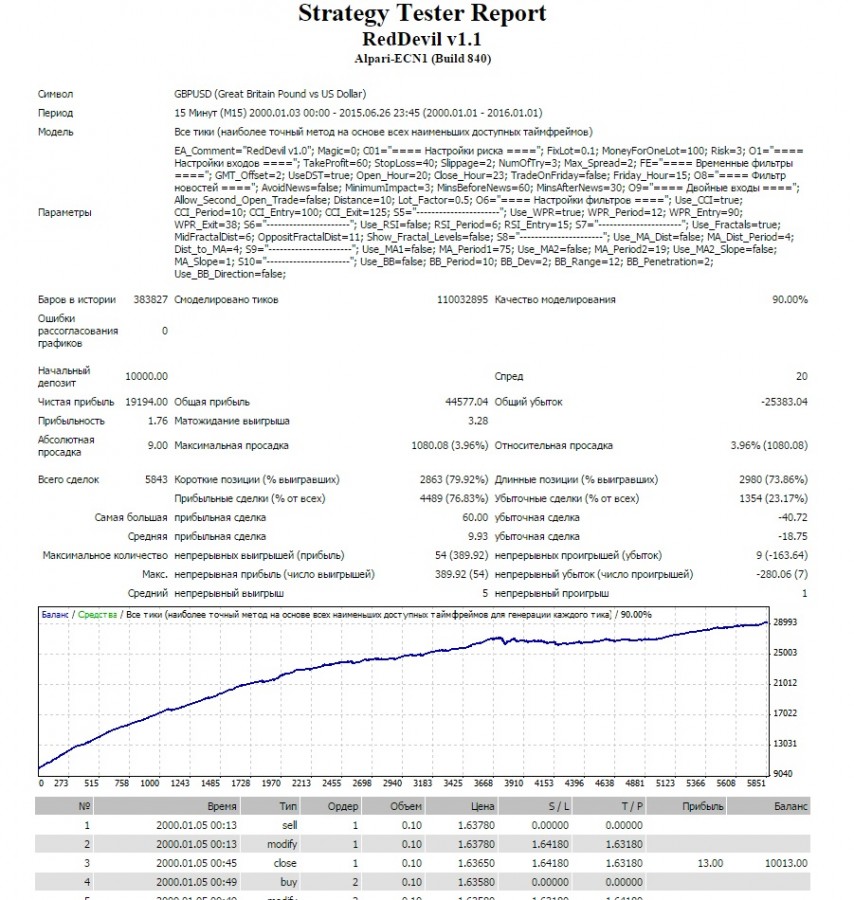
At the top of the report are the main data about the testing conditions: the period, currency pair, testing model, expert advisor parameters, and more. Below are the statistical test data and the equity curve chart. Next comes a table listing all completed trades.
Visualization Mode

This mode makes it possible to literally see, at an accelerated speed, how the expert advisor would have worked in the past under the quote changes that actually occurred. For example, if the expert advisor's entry and exit signals are based on the signals of some indicator, then you can place the needed indicator on the visualization chart and the appearance of trades and the closing of trades will become even clearer.
In other words, visualization helps you understand and feel the logic of the expert advisor's algorithm, because everything will happen right before your eyes.
In addition, visualization is also used when you want to see the nature of the origin of some specific segment in the expert advisor's run (the moment a blowout begins or, on the contrary, the most profitable period).
By running the robot in visualization mode, you can understand the principle of its operation and will know what can be expected from it in the future. This is a very useful tool, especially for expert advisor developers.
Conclusion

This article covered the core functionality of the MetaTrader 4 strategy tester terminal and the specifics of downloading quotes. We also became familiar with the results of an expert advisor test and the visual testing mode. I want to point out that these are only the basics of working with expert advisors. The method of testing an expert advisor discussed in the article is suitable for expert advisors on periods from H1 and above. For scalpers working on smaller periods, this method of testing is only conditionally suitable and is purely informational in nature. If you intend to earn money with the help of expert advisors, you also need to master expert advisor optimization. It will also be useful to gain deeper knowledge about testing and optimizing expert advisors with higher modeling quality, which is unfortunately unavailable in the terminal's standard version.
Respectfully, Dmitry aka Silentspec
TradeLikeaPro.ru