
How to Predict an Economic Crisis?

Hello, fellow traders!
On specialized forums and sites, as well as in the business press, many articles devoted to the coming recession have appeared. Is it possible to recognize an economic crisis in advance (and with the help of which indicators), and why is it dangerous for Forex currency traders? Our article, describing methods and ways of earning during periods of "bursting bubbles" in markets and falling stock indices, will answer these questions.
Each of us is familiar with the topic of economic crises, which have a cyclical nature proven by theory and practice. Historical chronicles point to a 7-10 year periodicity of the collapse that arises in all types of markets.
The danger of economic crises lies in the guaranteed disabling of any strategy that had worked before that. A Trader who has spent years on the search for a trading system and on coordinating the settings of indicators is forced to start from scratch because of changes:
At the same time, the type of reaction changesmajor playerson the output of certain economic indicators, which creates problems infundamentalforecast.
Fatal mistake of traders in post-crisis times on the Forex market

Pay attention to the gray zones of the chart of monthly EURUSD candles on the chart. The difference between pre-crisis and post-crisis fluctuations is obvious and is determined visually.
A trading system found at the moment of recession leads to three mistakes that already show up in the post-crisis period:
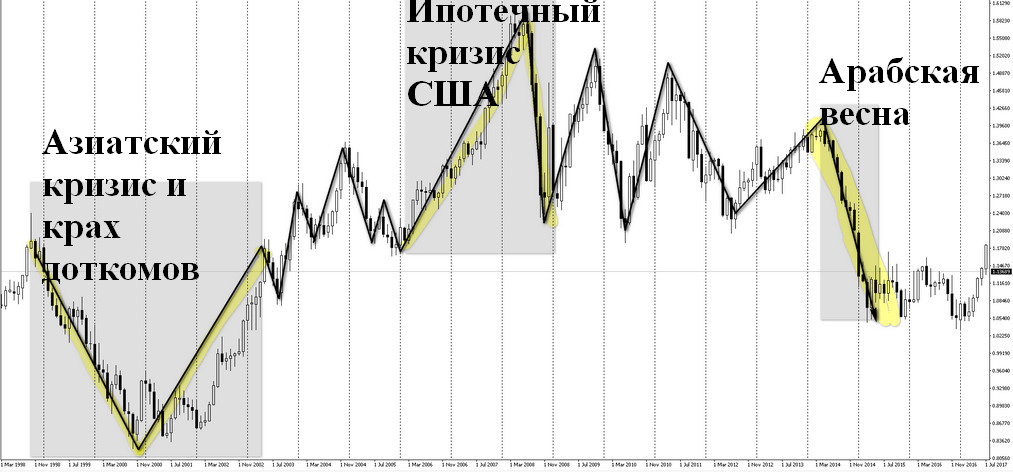
Fitting to sharp impulse spikes of quotes during the collapse will lead to increased sizes of take profits and stop losses, the latter will inevitably be enlarged because of volatility jumps that knock out short stops.
Therefore, the search for strategies after a blowup during a crisis will turn into "Sisyphean labor." Only one way remains: creating a separate tactic during the onset of the global economic collapse.
Once the markets calm down,traderswill not be able to compensate for the large losses incurred. The trading system will not have time to registerprofitsdue to large sizetake profitand reduced trend amplitude.
The fall of stock indices has become a kind of symbol of the economic crisis: investors sell stocks and move "into cash" in order to preserve capital, having fixed an acceptable level of loss. The money is kept in accounts until the end of the recession, when it can be invested in cheaper securities by starting purchases after signals of economic recovery.
How to make money during the economic crisis on the Forex market?

Until the end of the 20th century, such an asset was considered to be gold, but in 1998, 2008, and 2014 the fall in the value of the precious metal exceeded the decline of the stock indices of developed countries. The reasons for this behavior are described in detail in the article on the site "How to Trade Gold."
The most suitable instrument for preserving funds during a crisis is bonds, which provide protection against inflation through coupon interest payments. Sovereign bonds of developed countries with stable economies and minimal default risk are traditionally in high demand.
At the end of the 80s, Fed Treasury bonds became the most reliable "safe haven," which was reflected on the Forex market by the strengthening of the U.S. dollar exchange rate at moments of economic downturn. The surge in demand for debt instruments gave rise to a stable medium-term downtrend in the EURUSD pair.
At such a moment, all currencies lose to the U.S. dollar, but the euro is the most "technical" instrument, possessing moderate volatility, high liquidity and stable trends. A Trader can use simple strategies based on moving averages, selecting only short trades.
Essentially, trading in a crisis consists of choosing the right point for one trade at its very beginning, in order to further build a pyramid or work according to the tactic of a positive martingale until the end of the crisis.
The most important question remains: how to correctly determine the beginning of a stock market crash?
Essentially, trading in a crisis consists of choosing the right onedealsat the very beginning, in order to later build a pyramid or work according to tacticspositive martingaleuntil the end of the crisis.
Indicators of market crises are a topic that is little covered because of its being in demand once every ten years. Traders begin to study it only after losing deposits; here we mean only several dozen percent of speculators out of the total mass who traded profitably for several years.
Indicators of market crises

After the recession is confirmed, the decline of the markets may continue, but entering at the moment of a possible rebound will cost "very dearly" because of frequently triggered or unjustifiably large sizes of stops.
There are three methods for determining a market decline before it begins. Below we will examine them in detail.
Once a recession is confirmed, markets may continue to decline, but entry into a possible rebound will be “very expensive” due to frequently triggered or unreasonably high sizesstops.
LEI is a basket of real statistical and market indicators (including stock indices), developed by the non-governmental organization The Conference Board. There is a legend that such an assessment methodology was at first secret and was used by the U.S. intelligence services to assess the condition of the economy of a potential enemy.
1. LEI leading indicator method
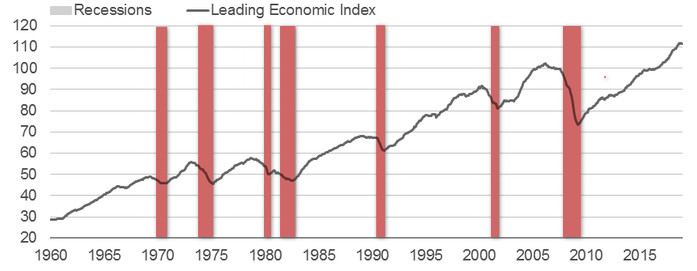
The indices are measured in relative units, where data from the 60s is taken as zero. In the late 90s, analysts noticed a historical peculiarity: two consecutive declines precisely indicate the beginning of a recession.
It is difficult to predict the end of a crisis with the help of LEI; for reliable forecasting, five consecutive rises are taken, but they show the beginning of the collapse of the economy quite accurately.
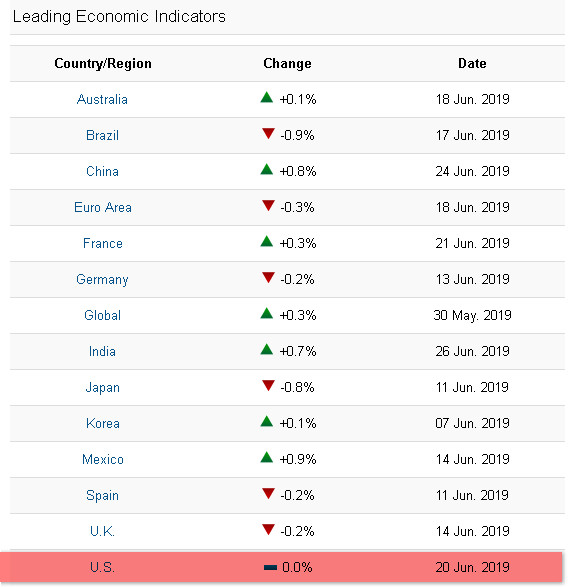
The archive of indicator readings is distributed for a fee, but current data is published monthly on the website of The Conference Board in the form of a table presenting LEI for nine countries, the eurozone, and the world economy as a whole.
Pay attention only to the indicators of the U.S. economy: two declines will predict a recession, while the rest of the set, including indicators of the world economy, is less accurate in its signals and may lag. Check the site once a month, after the 25th, and you will know exactly how correct the current crisis forecasts of leading economists are.
An archive of indicator readings is available for a fee, but current data is published monthly onwebsiteThe Conference Board in the form of a table presenting the LEI for nine countries, the euro area and the global economy as a whole.
Options price volatility (VIX) has been named the index of fear and greed. These are unique contracts that give traders the opportunity to apply a "smart stop." The option premium is an insurance compensation lost by the trader in the event of a correct trend forecast. It also limits the loss in the event of an incorrect forecast, while the remaining amount of the losses is reimbursed after expiration.
2. Index of fear and greed in the Forex market
When securities soar, the cost of insurance falls, greed forces speculators to save on hedging stocks and ultimately leads to a "market bubble" that "bursts" with a collapse of stock indices. As they decline, investors' fear grows along with the cost of insurance, which leads to a reversal and the formation of a bottom, and purchases become more confident because all the rules of position hedging have been observed.
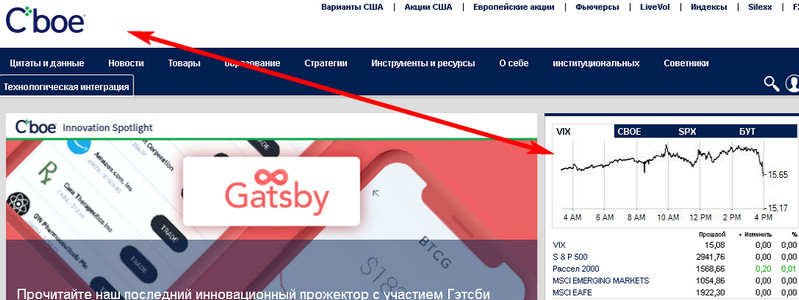
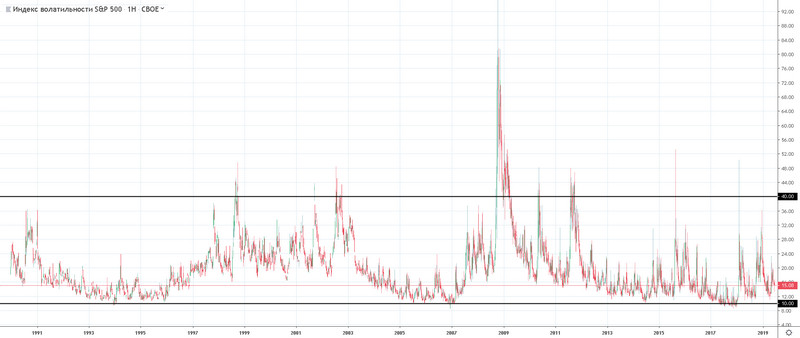
VIX is the most important parameter published on the front page of the Chicago Board Options Exchange CBOE website. This chart can also be obtained in the TraidingView service. Working levels: 10 means a crisis, 40 means the end of the crisis.
The chart shows that the VIX curve gives more entry points for shorting EURUSD than LEI, but it makes mistakes with the end of the recession. Still, every trader can find a way to apply filters and come up with a tactic for using the indicator.
VIX is the most important parameter published on the first page of the Chicago Board Options Exchange websiteCBOE. Also thisschedulecan be obtained from the serviceTraidingView. Working levels: 10 is a crisis, 40 is the end of a crisis.
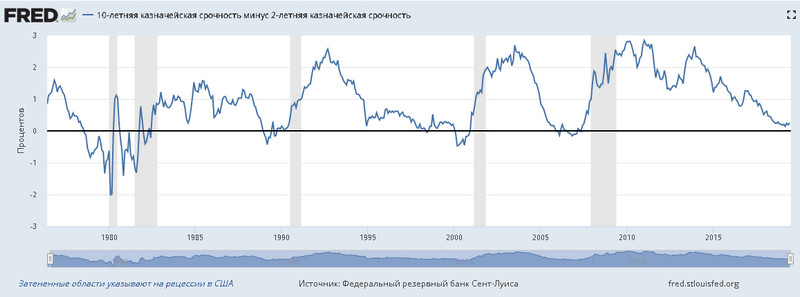
The strengthening of the U.S. dollar against almost all world currencies during a recession was already substantiated at the beginning of the article by the growth in demand for Fed bonds. The U.S. Treasury issues debt securities with several maturities, which helps determine the approach of a crisis by analyzing the yields of 2-year and 10-year bonds.
3. Fed bond yield divergence
The Federal Reserve Bank of St. Louis constantly publishes fresh and historical data on the spread between bonds on the website, displaying the periods of economic crises in past years. As can be seen from the chart, after a divergence of 2% there follows another market collapse and a rise in the U.S. dollar rate. However, as in the previous cases, the exit from the recession is weakly predicted by this indicator.
The abnormal interest of investors in debt securities leads to an increase in the yield of bonds of “short-term” maturities. Analysts determine that a recession is approaching when this rate begins to exceed interest on 10-year bonds.
The described indicators of an economic crisis belong to the class of non-trading indicators. They cannot be used to obtain specific entry signals into a position, these are alerts that warn or explain why a strategy that has been working for many years begins to fail.
Conclusion

Respectfully, Ivan Petrov
Tlap.io
Best regards, Ivan Petrov
Tlap.io