
How to Make Money on the S&P500?

The S&P500 index can be found in the list of instruments of any forex broker, but many traders pass this asset by. Perhaps the stereotype is at work that the stock market and currency speculation are incompatible things that require different approaches and strategies.
There is some truth to this: S&P500 has a clearly growing historical trend, obvious even to newbie, unlike major currencies, whose movements are similar to wide flat. A stock index provides opportunities for both long-term investing and short-term trading.
Today we will understand what S&P500 is, what companies it includes, important features of the instrument, and consider investment and trading strategies suitable for this index.
What Is the S&P500 Stock Index

The S&P500 index is a mathematical indicator that reflects the general state of affairs in the stock market and is based on the prices of 505 shares of the largest US companies.
The index formula was developed jointly by Poor's Publishing and the rating company Standard Statistics Company.
Both firms were engaged in issuing recommendations on promising stocks and compiling portfolios for investors in the early 20th century. In 1941 the companies merged, giving rise to the Standard & Poor's agency, whose specialists began working on the idea of creating a universal indicator that most fully describes the stock market of the USA.
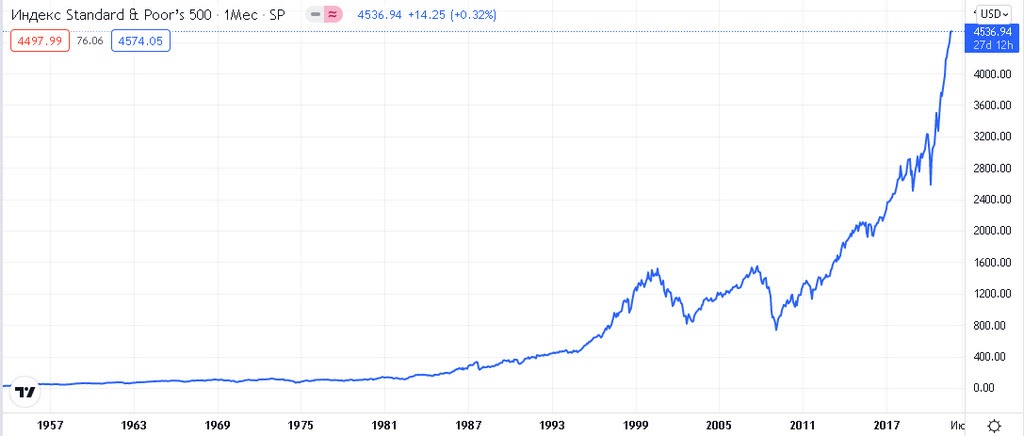
The first version of the S&P index contained 500 shares of American companies traded on stock exchanges in the USA, selected by the size of their capitalization in 1943. The indicator was published in 1957, but level 10 from 1941 was taken as the starting point. At the time of writing, the S&P500 had exceeded the 4536 level.
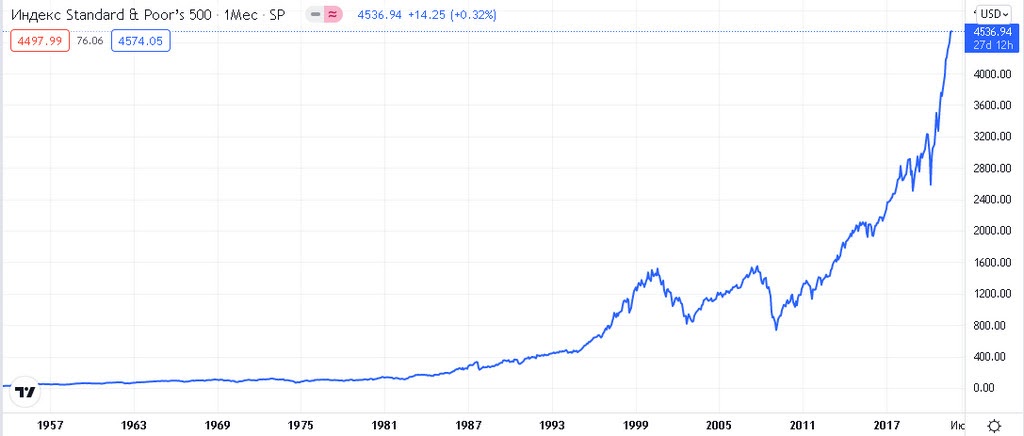
The formula of the indicator created 64 years ago, as well as the stock selection criteria, has not undergone any significant changes to this day.
The index includes only securities of American companies listed on the NYSE or NASDAQ exchanges with a capitalization of more than $13,1 billion. An additional condition is a trading turnover of at least 250 thousand shares per month over the observed six-month period.
The indicator formula was amended in 2006. S&P Global now multiplies the stock price not by the entire number of issued securities, but only by those that are in free float on the exchange.
List of shares included in SP500 contains only companies that are owned by joint stock companies, excluding various investment funds, trusts, etc., that are not engaged in real activities. The decision to include a particular stock in the list is made by a committee that takes into account the following criteria:
The composition of the index is reviewed and adjusted quarterly. S&P500 does not necessarily contain strictly 500 shares; the number of securities can be higher or lower within a dozen positions.
The role of the S&P500 index

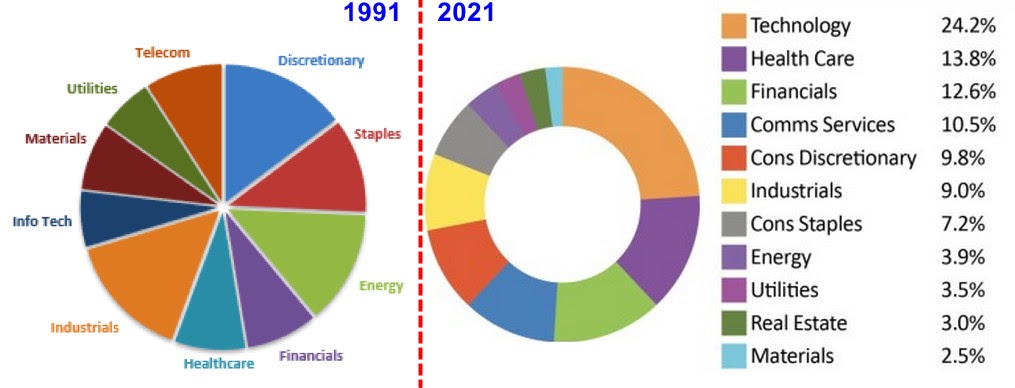
For example, today in the top-10 company ranking, the greatest weight by capitalization is held by IT companies, which 30 years ago ranked only seventh.
Based on the results of 2021, it is expected that finance will be finally shifted to third place by the medical industry.
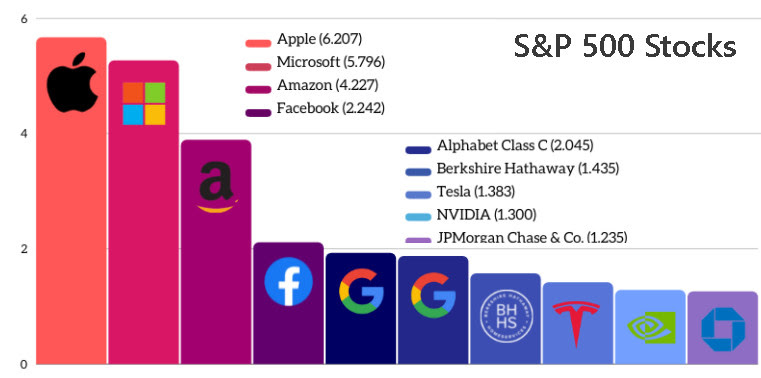
The chart presented above can serve as a guide for building a stock portfolio. Divergence from the index allows a trader to find undervalued declining stocks that can “shoot up” after the next renewal of S&P500 local highs.
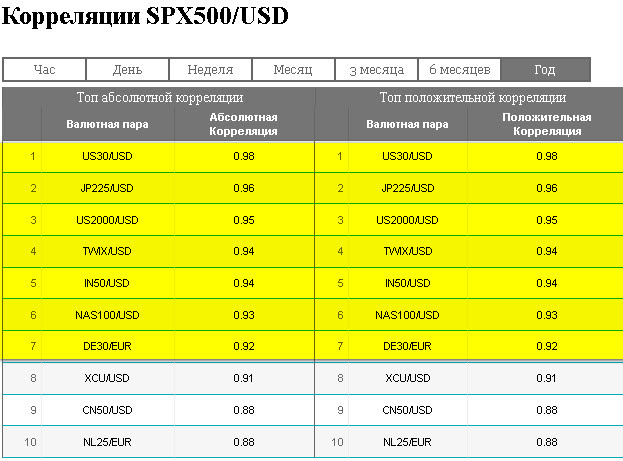
The positive trend of the American stock market affects not only individual stocks, but also sovereign markets. As investors say, “A rising tide lifts all boats.”
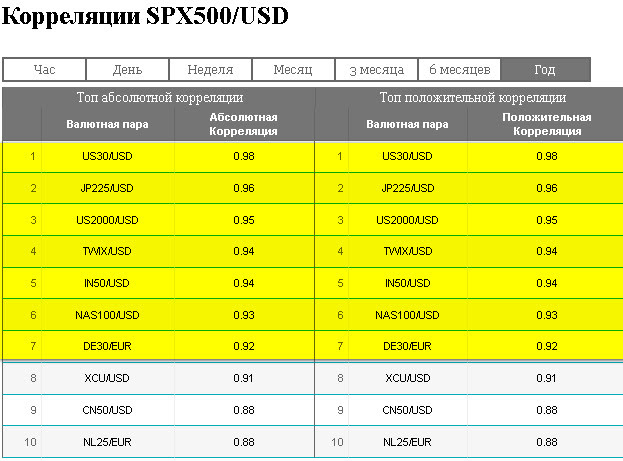
New S&P500 highs are a reason for at least short-term growth in almost any national stock market, despite internal negativity. Most stock indicators of developed countries follow S&P500 trends with a fairly high correlation coefficient, which can be seen in the service on the TLAP website.
New highs S&P500 is a reason for at least short-term growth in any stock market in the country, despite the internal negativity.Most stock indicators in developed countries follow trends S&P500 a fairly high correlation coefficient, which can be seen inserviceon the TLAP website.
How to properly follow the S&P500 index

In addition, the purchased shares may not match the final S&P500 values exactly. A trader will lag in rebalancing positions and incur high trading commission costs for such a sizeable package of shares.
In addition, the purchased shares may not exactly coincide with the final values of S&P500. Traderwill be late in rebalancing positions and incur high trading commission costs for such a large holding.
ETF
Funds investing in a package of securities equivalent to the composition of S&P500:
The full composition of the S&P500 index can be purchased in the form of fund units from the largest international and domestic brokers and banks. The only downside to such investments is that they are not openly traded on stock exchanges like the three stocks listed above. Investors will have to assess these investments by the reliability of the issuer.
Securities of the listed issuers can be purchased on the Moscow Exchange. It is worth noting once again that actual stock holdings differ from the calculated index, and the annual return results for these securities will be different.
The listed banks and a number of Russian brokers also offer traders the purchase of shares in American S&P funds, subject to qualified investor status and a certain amount of funds in the account.
Securities of the listed issuers can be purchased on the Moscow Exchange. It is worth noting once again thatactual stock holdings differ from the calculated index, and the annual return results for these securities will be different.
Derivatives are the simplest and least expensive (in terms of commissions) way to follow the broad market indicator.
On the US market, a set of futures for S&P500 is offered by the Chicago Exchange CME in the form of:
CFD
Traders using forex-market brokers have access to CFD contracts on the popular American stock index. They are available from almost every broker, allowing you to trade the S&P500 with leverage much higher than CME futures or CBOE options.
When trading CFDs, the trader bears much lower commission costs than with all the other forms of investment considered. With medium- and long-term holding, the broker credits the client's account with dividend income from a package of 500 shares.
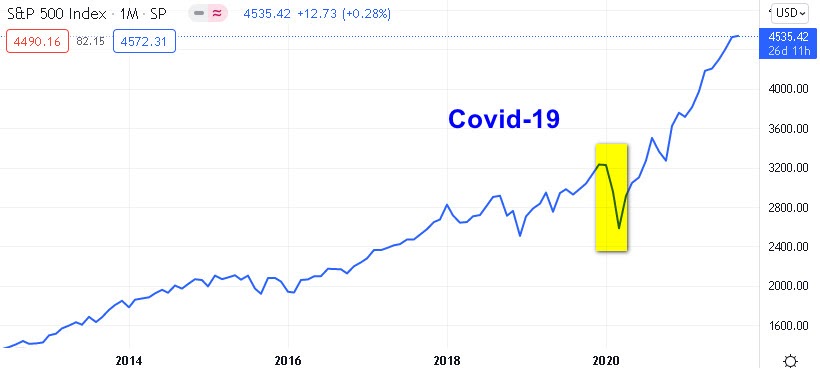
Across the overall historical span of the S&P500 chart, a rising trend is clearly visible, which is characterized by the following interesting indicators:
CFD
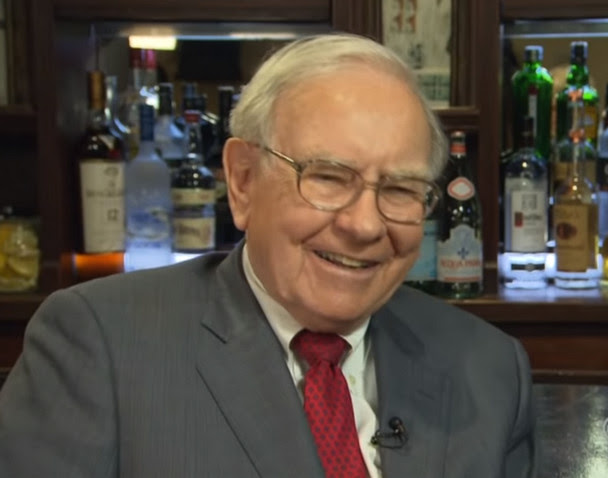
The famed investor's company, Berkshire Hathaway, ranks 6 in the index, proving the validity of his investment views. In addition, Buffett has actually proven the superiority of S&P500 over the work of hedge funds.
The Oracle of Omaha made a million-dollar bet with Protégé Partners investment manager Ted Seids. The latter assembled a portfolio of 100 hedge funds with the goal of outperforming the broad market index from 2007 to 2017. Buffett easily won this bet, giving the money he received to charity.
Historical trend

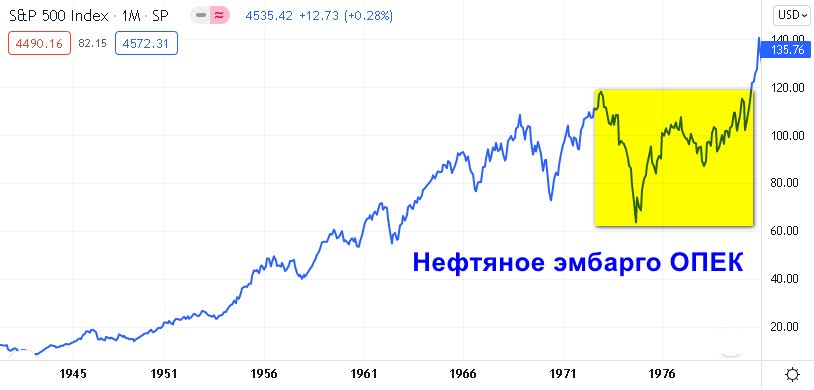
The first such catastrophe struck investors in 1973, which was marked by the oil crisis that arose after the Yom Kippur War. It was at that moment that the OPEC cartel emerged, and the United States created its famous strategic oil reserve.
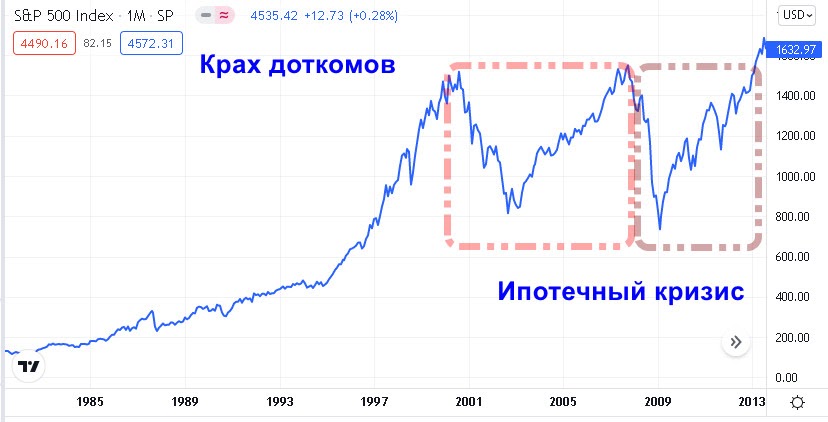
Starting in the mid-1990s, the S&P500 increased its returns thanks to the explosive development of the IT industry. Investor excitement “inflated the dot-com bubble” in the shares of companies whose business was entirely tied to the Internet.
At that stage of technology development, the IT sector had no chance of receiving sufficient profit, which led to a series of bankruptcies that brought down shares for 7 years.
However, investors were unlucky twice at the beginning of the 21st century. As soon as S&P500 reached the levels of 2001, the “mortgage crisis” broke out in 2008. After this fall, the stock went to highs of 2007 for 6 years.
The past crisis of 2020 cannot be considered as such, based on the principles cyclicality. The stock market was bought in 4 months. Apparently, the 7-year period of “failure” of S&P500 is still ahead.
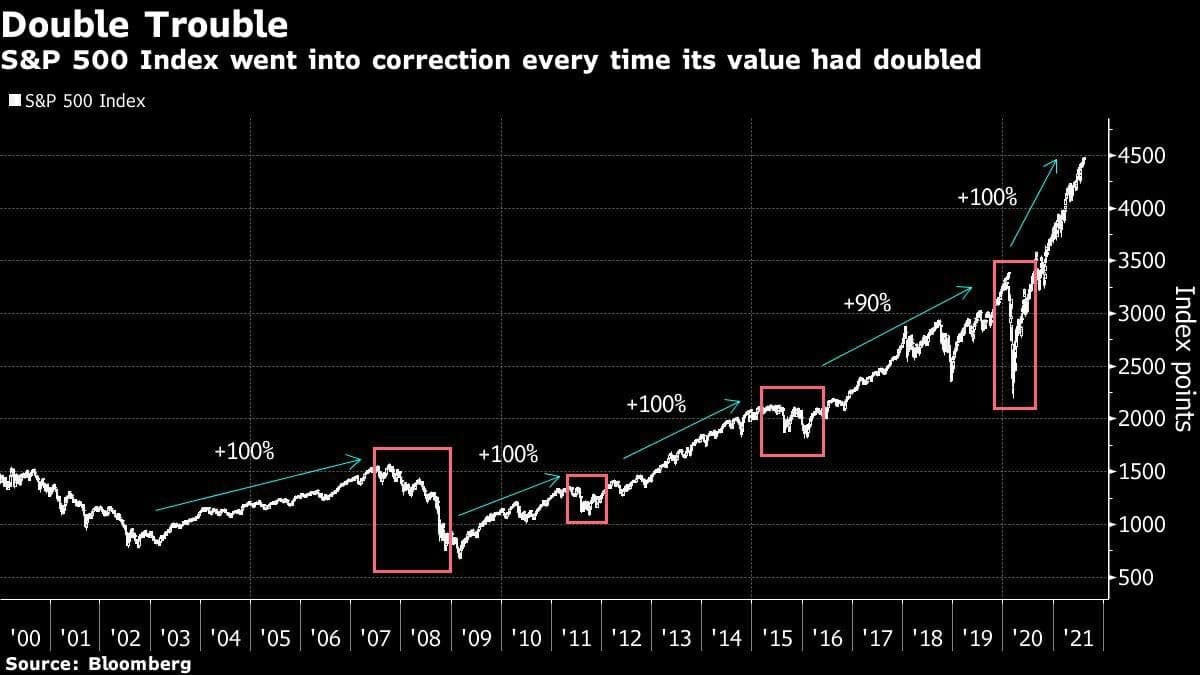
Interesting observation - The S&P entered a correction every time after growing by 100%.
Also, based on a study by Fidelity Investments (an American holding company providing financial services and one of the largest asset management companies in the world), it was found that since 1920 the S&P500 index has shown on average: a 5% pullback three times a year, 10% corrections every 16 months, and 20% drawdowns every 7 years. The average correction lasts 43 days.
Since the mid-1990s, S&P500 increased profitability due to the explosive development of the IT industry. The investor frenzy “inflated the dot-com bubble” in the shares of companies whose business was entirely related to the Internet.
The main feature of the S&P500 indicator is that it has become the basis for determining investor sentiment, predicting future economic crises and moments of “safe” entry into the market. We are talking about the famous index volatility VIX and the cost of options on stock indicator futures traded on the CBOE platform.
The price of any option contract can be calculated in advance using the Black-Scholes formula, which won the Nobel Prize in economics. In 1989, Professor Menahem Brener proposed using these data and actual option values to calculate the market's expected future volatility.
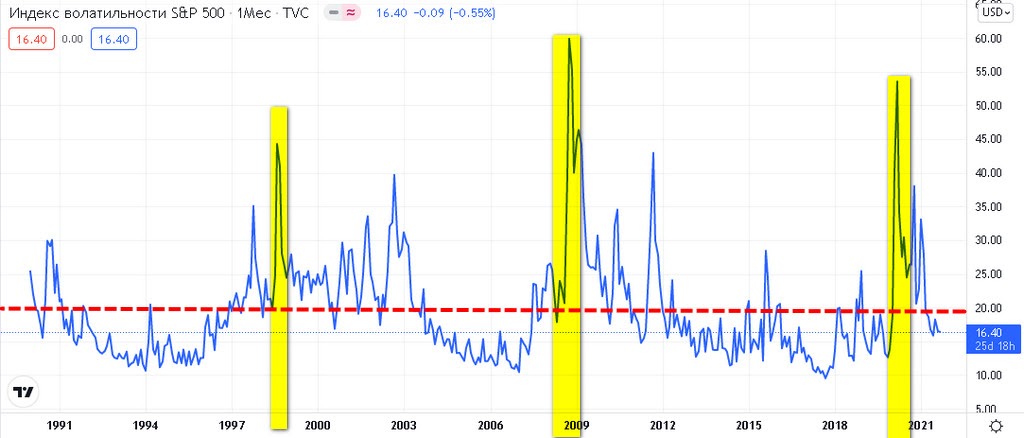
Later, the CBOE exchange mathematically implemented this idea by releasing the VIX index. The meaning of this indicator can be seen with the naked eye, even without special knowledge in technical analysis stock market. VIX surges were forewarned or coincided with the dot-com crisis, the subprime crash, and Covid consequences.
A value above 40 points is considered the investors' “zone of fear,” warning that a crisis is near. In this case, to resume buying assets, you should wait for it to fall into the “greed zone” below 20 points.
The VIX index can be found at TradingView.
Seasonality

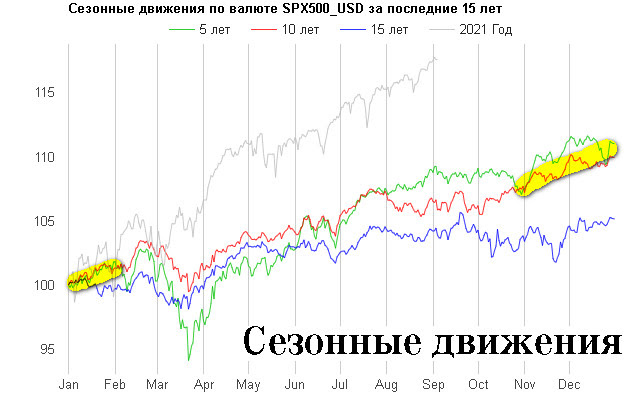
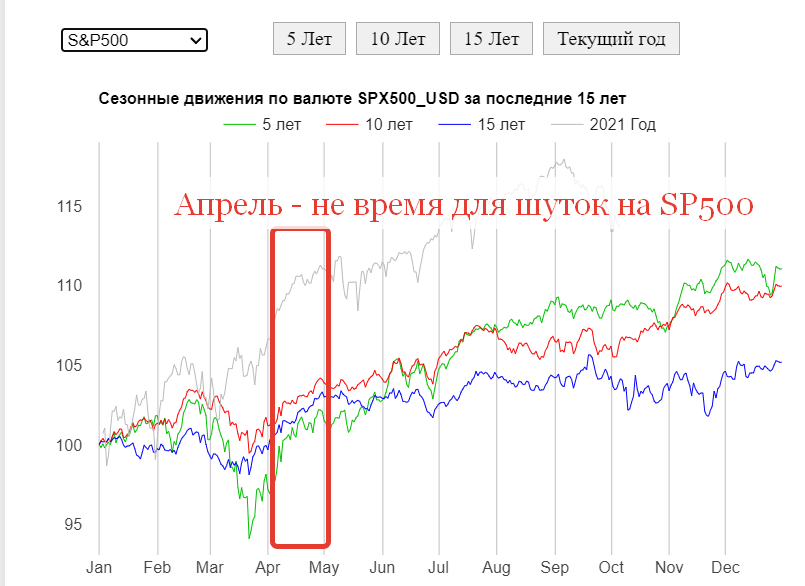
Seasonality is another feature of the S&P500 index, namely the tendency of stocks to rise or fall during certain periods of the year. The Christmas Rally is the best-known and most beloved season of stock gains among investors. A wave of security purchases takes place at the end of the year and/or immediately after the New Year holidays.
As can be seen from the graph seasonal movements of instruments on our TLAP website, in the last 10 and 5 years, seasonal S&P500 rallies began to cover a long period from November to January.
April is often called the best month for investing – over the past 10 years there has never been a negative closing of the index at the end of the month:
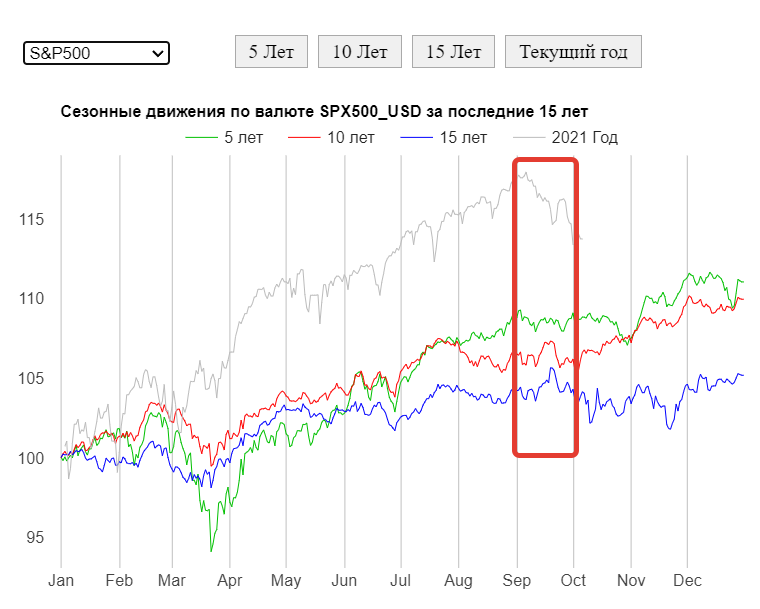
But the famous adage “Sell in May and go away” no longer works when it comes to selling stocks in May. Three statistical curves together point to March as the most likely month for a stock-market slump.
However, May and June are a flat season in the stock market. A longer period of lateral movement, according to statistics, occurs from July to the end of September.
Seasonality
Seasonality is another feature of the S index&P500, which is the pattern of stocks rising or falling during certain periods of the year.The Christmas Rally is the most well-known and beloved season for investors to take off stocks.. A wave of securities purchases occurs at the end of the year and/or immediately after the New Year holidays.
Trade intraday also has its own characteristics, distinctive from the market Forex. This is due to the work schedule of American exchanges, which are open from 9-30 to 16-30 EST (+7 Moscow time), but S&P500 futures are traded throughout the day.
According to Moscow time, the US stock exchange operates in the summer from 16:30 to 23:00, in the winter - from 17:30 to 00:00 Moscow time.
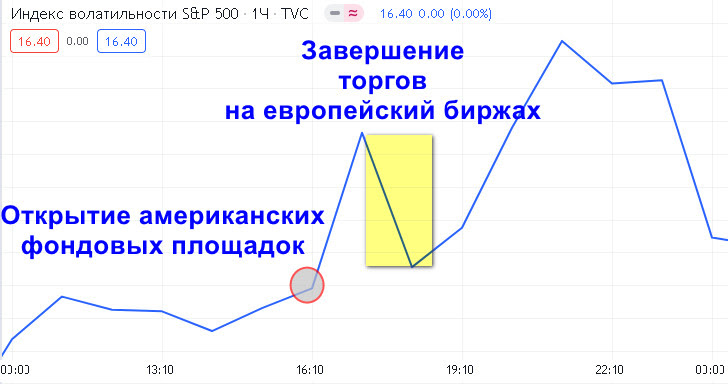
Despite the 24-hour derivatives trading schedule, trading remains at reduced volatility until 16:30 MSK, which is associated with a sharp increase in collateral requirements for futures contracts. Leverage drops sharply during the main session, and US statistics are also often released by that time.
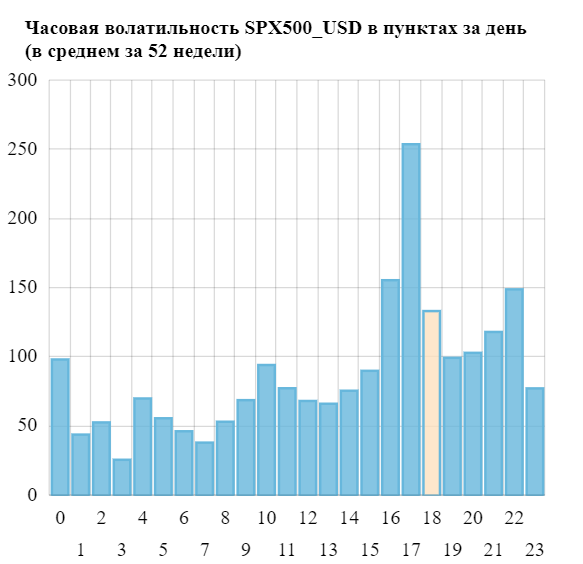
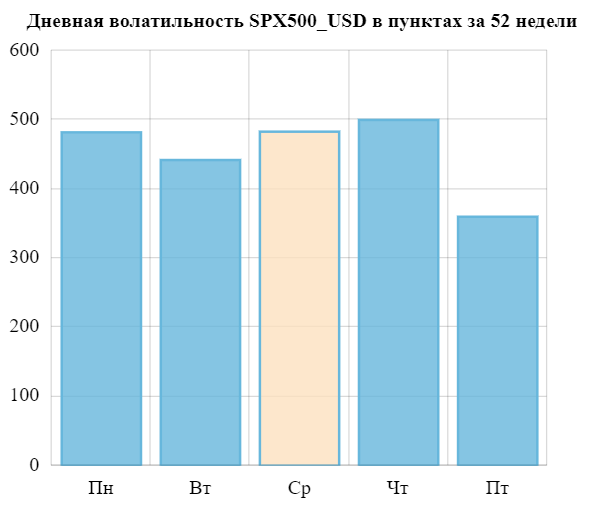
The standard pattern of volatility distribution is shown in the picture below. The intensity of transactions increases throughout the day until the end of the session at 23:00 MSK.
The departure of European traders from the market at 18:00 causes a dip in volatility after the opening of trading. The correction in liquidity created by this outflow becomes the reason for a wave of new transactions, whose pressure leads to renewed volatility highs around 22:00.
Volatility

As for the days of the week - Friday stands out for its reduced volatility.
Moscow time, the US stock exchange is open in the summer from 16:30 to 23:00, in the winter - from 17:30 to 00:00 Moscow time.
To conclude the topic of the S&P500 index's features, it is worth dwelling on correlations. For many traders, it now seems obvious that the indices of developed countries move almost unconditionally with the trends of the American stock market. The degree of their correlation can be viewed in the service on our TLAP website.
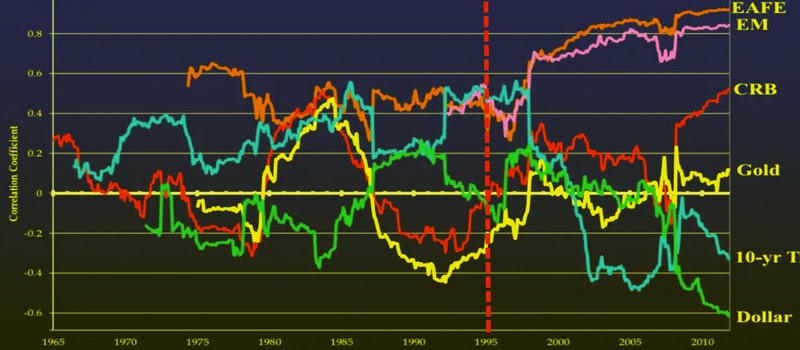
This was far from always the case: until the mid-1990s, the S&P500 was not connected in any way with the MSCI developed markets equity index (EAFE) or emerging markets equities (EM). From 1964 until the very end of the 20th century, the correlation of exchanges on opposite sides of the Atlantic was 0.4 points.
The era of globalization of markets, which started in 1995, has changed this picture beyond recognition.
With the emergence of multinational corporations, EAFE and EM stocks synchronized their movements up to 0.8 points, and this relationship will only grow. As statistics show, 44% of the profits of the 500 companies in the S&P are generated outside the United States. The White House's attempt to change this situation during Donald Trump's presidency only made the situation worse. Before the start of 2018, companies earned 30% of their revenue abroad and 70% inside the States.
The loss of correlation with gold is another unusual fact. The reasons for this phenomenon were described in a previously published article on our website.
S&P500 index trading strategies
The clearly pronounced multi-year upward trend of the S&P500 provides grounds for creating a long-term strategy with no shorts. As statistics show, a simple purchase of the futures contract on any timeframe will lead to 70% profitable year-end closes. The only problem is economic crises, which knock the S&P500 rate down once every 10-20 years.
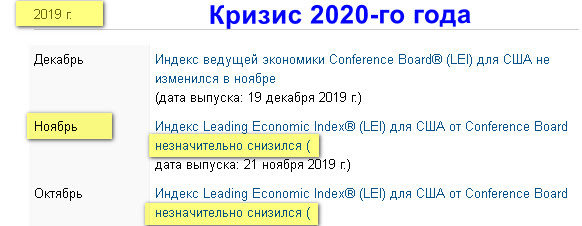
Data on the LEI indicator described in the article on our TLAP website will help to avoid such moments. This indicator is calculated by The Conference Board. The agency is known for its US Consumer Confidence Index (CB), which carries the highest significance rating in the economic calendar.
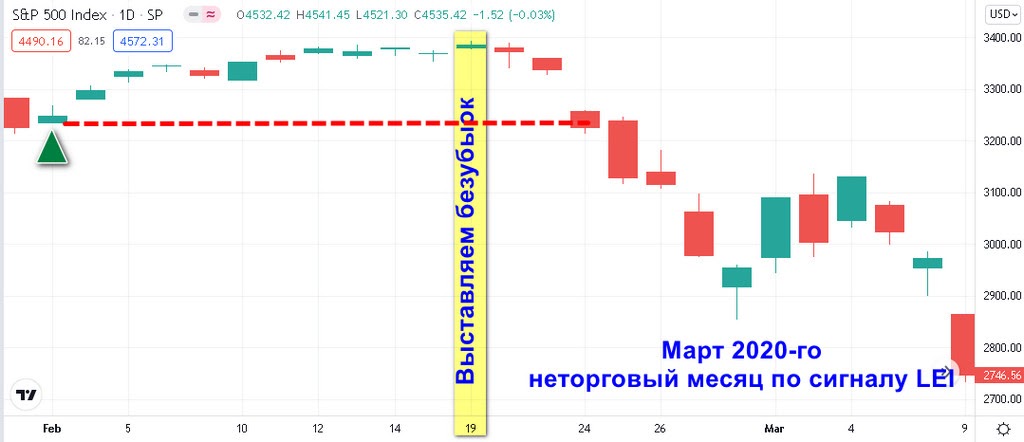
The indicator can be tracked via press releases, published on the CB website. Two consecutive months of falling LEI is a fairly reliable predictor of future economic crises. Markets fall three months (on the fourth) after the signal is released. A quarter is enough to prepare for this event, close all transactions and not trade.
LEI indicators are published at the end of the month, so entry into an S&P500 long can be tied to the beginning of the next month, closing, extending, or adding to the trade after the 25th-26th when CB data is updated. The position should be protected with a breakeven stop after the 18th so as not to become a victim of the volatility that often arises after options expiration.
Money management for the strategy is simple. According to statistics, the S&P500 index did not fall by more than 30%. Such a stop is enough to protect the initial trade, which can later be increased with subsequent entries. A trader can thus increase the position and reduce the stop thanks to the paper profit generated and the averaging of the overall position.
S&P500 index trading strategies

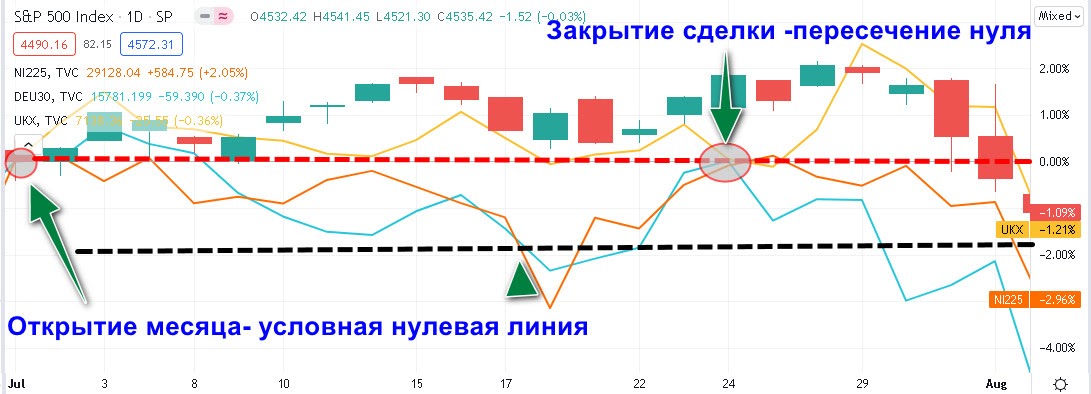
Trades opened this way are closed after crossing the month’s opening level. All positions are formed with an eye on the LEI.
As in the first strategy, you should trade only long. The predominance of a long-term historical positive trend will “save” a stuck buy position, but a short can bring destructive losses if you do not exit in time.
The short-term strategy consists of news trading. The news must relate to the US and be marked as having high market impact in the economic calendar.
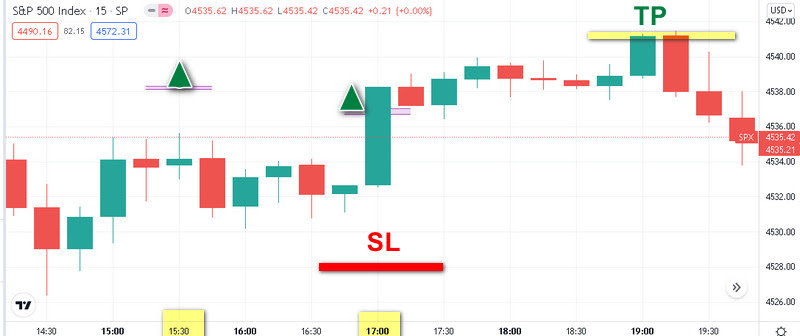
Usually on news, traders “catch” a currency pair in both directions by placing pending orders Buy Stop and Sell Stop, but in the case of index trading it is worth limiting yourself to only the Buy Stop, set 0,1% above the closing price of the M15 candle before the release of the news.
After the order is triggered (in our example, only the second order worked), we set the SL 0,1% below the candle’s opening level and the TP 0,1% above the entry level.
The trade is closed by take profit or at the end of the session. Using a trailing stop after the price has risen by 0,05% is acceptable.
Linda Raschke writes in the book “Trading Sardines”:
“I take into account trend days and consolidation days, as Taylor taught. On an ideal trend day, you need to enter long positions and stay in them until the end of the day, scalping every pattern of trend continuation. Exit is at the close of the day. Trend days happen about once a month, and it is like Christmas.
Consolidation days are traded in exactly the opposite way. Any thrust of the market upward or downward means we enter in the opposite direction. The market is “noisy,” waiting for tomorrow’s FOMC release or another important economic report, so we enter in the opposite direction. A test on a low-volume day means we enter in the opposite direction... But real money is still made on trend days and on days with large volumes.”

How to catch a trending day?
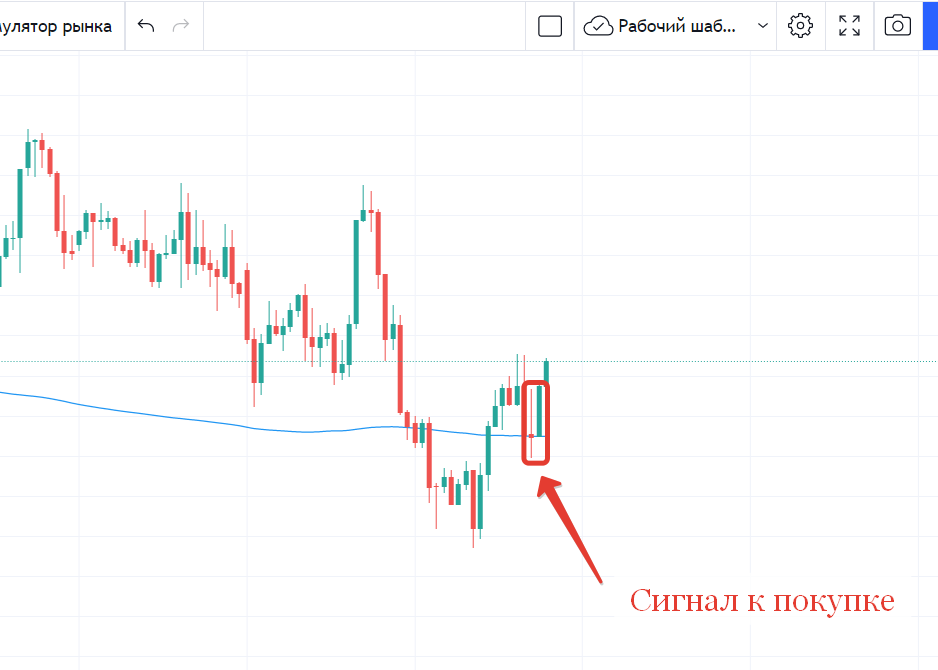
As a rule, SP&500 continues the movement of the last hour or two of trading at the end of the day.
At 19:00 MSK we look at the last two candles and open in the direction of the movement (if the movement is unclear, it is better not to enter).
And we hold the position until midnight. In some cases you will get a small profit, less often a small loss, and sometimes you will get that very profitable trend day.
Alternatively, you can only take buy signals. You'll miss out on some of the profitable bear days, but you'll increase your overall win rate.
Consolidation days trade in exactly the opposite manner. Any attack market up or down – we enter in the opposite direction. The market is “noisy”, waiting for tomorrow’s release FOMC or another important economic report - we enter in the opposite direction. Testing on a day of low volumes - we enter in the opposite direction... But real money are still done on trend days and on days with large volumes.»
The US stock market has been trading for two centuries. During this time, many books have been written where you can easily find a wide variety of strategies. A trader can choose any of these trading systems, but the purpose of this article is to convey a simple point.
Unlike commodities, currencies and any other instruments, shares should rise a priori. This is the main purpose of these securities, which they fulfill, as shown by the historical trend S&P500, which “absorbed” 80% of the US stock market.
This means that the success of a trading strategy will be achieved by a system that avoids systemic crises. All other market failures will be bought up by investors at the astonishing speed that smartphone trading apps are capable of.
Particularly high demand for shares is formed during periods of rising inflation. Today it is breaking all records, forcing investors to flee from defensive instruments to the stock market. The inflation factor largely explains the current mega-growth, for which no end is in sight over the next several years.
Conclusion

The US stock market has been trading for two centuries. During this time, many were writtenbooks, where you can easily find a wide varietystrategies. Tradercan choose any of these trading systems, but the purpose of this article is to convey a simple point.
Unlike commodities, currencies and any other instruments,shares should rise a priori. This is the main purpose of these securities, which they fulfill, as the historical trend S shows&P500, which “absorbed” 80% of the US stock market.
This means that the success of a trading strategy will be achieved by a system that avoids systemic crises. All other market failures will be bought up by investors at the astonishing speed that smartphone trading apps are capable of.
Particularly high demand for shares is formed during periods of rising inflation.. Today it is breaking all records, forcing investors to flee from protective instruments to the stock market. The inflation factor largely explains the current mega-growth, which has no end in sight for several years.
Sincerely, Ivan Petrov and Pavel Vlasov
Tlap.io
