Lifehack: how to know the Fed and Bank of England rate before it appears in the news feed

Once every month and a half, our minds are stirred by such events as meetings of the U.S. Federal Reserve System, the Bank of England, the European Central Bank, and many other banks whose currencies are part of our investment portfolios. In this short article I want to tell you a little secret: how to know almost for sure how the Fed and Bank of England meeting will end: whether they will raise, cut, or leave the interest rate unchanged. I will say right away that the lifehack described below works only for these two banks. You will soon understand why.
What is the discount rate: a simple take on something complex
What is the discount rate? It is the interest rate at which the central bank funds commercial banks. In theory, and usually in practice as well, a rate cut stimulates lending, while a hike, on the contrary, slows it down. Increased lending raises economic activity, which can lead to higher inflation and faster depreciation of money. Therefore, the central bank's policy looks like this: a cut is followed by a hike, which is followed by a cut. In general, it is an ordinary system with regulating feedback. A toilet cistern in a restroom works the same way. Below I will show how it works.
Every time you press the toilet button, the inlet valve opens inside. Water leaves faster than new water arrives, so the valve opens more and more until all the water is gone. When interest rates are high, there is no inflow of fresh money, the economy stagnates, because it is hard to expand production and stimulate demand. But as soon as the central bank lowers the toilet button, I mean lowers rates, an inflow of new cheap money begins immediately.
When all the old water is gone, the new water arrives with great force, because the valve is fully open. At this time we observe financial bubbles in the economy, lending to anyone and everyone, and more than enough money. In short, rates are low, economic activity grows, and with it inflation.
The water in the tank gradually rises, which means rates begin to rise in the economy, that is, the valve starts to close. The economy slows down, and the inflow of water slows too.
The water has risen, the valve has closed: the rate is at its maximum, the economy needs cheap money, and businesses are suffocating without loans. It is time to cut the rate, that is, to drain the water again. And so it goes every time.
I hope this simple comparison helped you understand how the countercyclical policy of central banks is structured. Of course, everything is a little more complicated (for example, the water flow strengthens for some time during the drain, and the central bank, in turn, cuts the rate for some time, that is, this is procyclical policy), but we do not need to know more than that.
I hope I explained clearly enough how the central bank regulates economic activity through the rate.
The role of the Chicago exchange in changes to U.S. Fed rates: how it really works

Central bank policy is watched not only by forex traders with a hundred bucks in their account, but also by such serious ladies and gentlemen that they are not even shown on TV, yet they manage funds with capital of tens of billions of dollars. The former hope to ride fifty points after the news, and maybe even 150 in half an hour. For the latter, the return on investments depends on the interest rate, where a 0.5% change in the funding rate can turn an extremely profitable business into a losing one (it is long and complicated to explain, just take my word for it).
Central banks try to take into account the interests of serious ladies and gentlemen, but they do it very elegantly. To talk in more detail about this symbiosis of big business and the state, we need to understand the role of the largest exchange platform in the world, CME Group. CME Group includes exchanges such as CME (Chicago Mercantile Exchange), CBOT (Chicago Board of Trade), NYMEX (New York Mercantile Exchange), and COMEX (New York Mercantile Exchange): the largest American, and therefore global, commodity and futures exchanges.
Thus, its specialization is the derivatives market. The derivatives market is the market for futures and options on futures. Futures can be currency, commodity, index, and others.
If from the main page of the CME Group website you go to the Interest Rates tab, on the right you can find two links in the Interest Rate Tool section: CME FedWatch and CME BoEWatch. This is what interests us. It is an open secret that is now also known to Tradelikeapro readers. By clicking these links, you will land on pages where, in real time (though that is not required), you can watch how investors' sentiment about the rate changes for the nearest and more distant meetings.
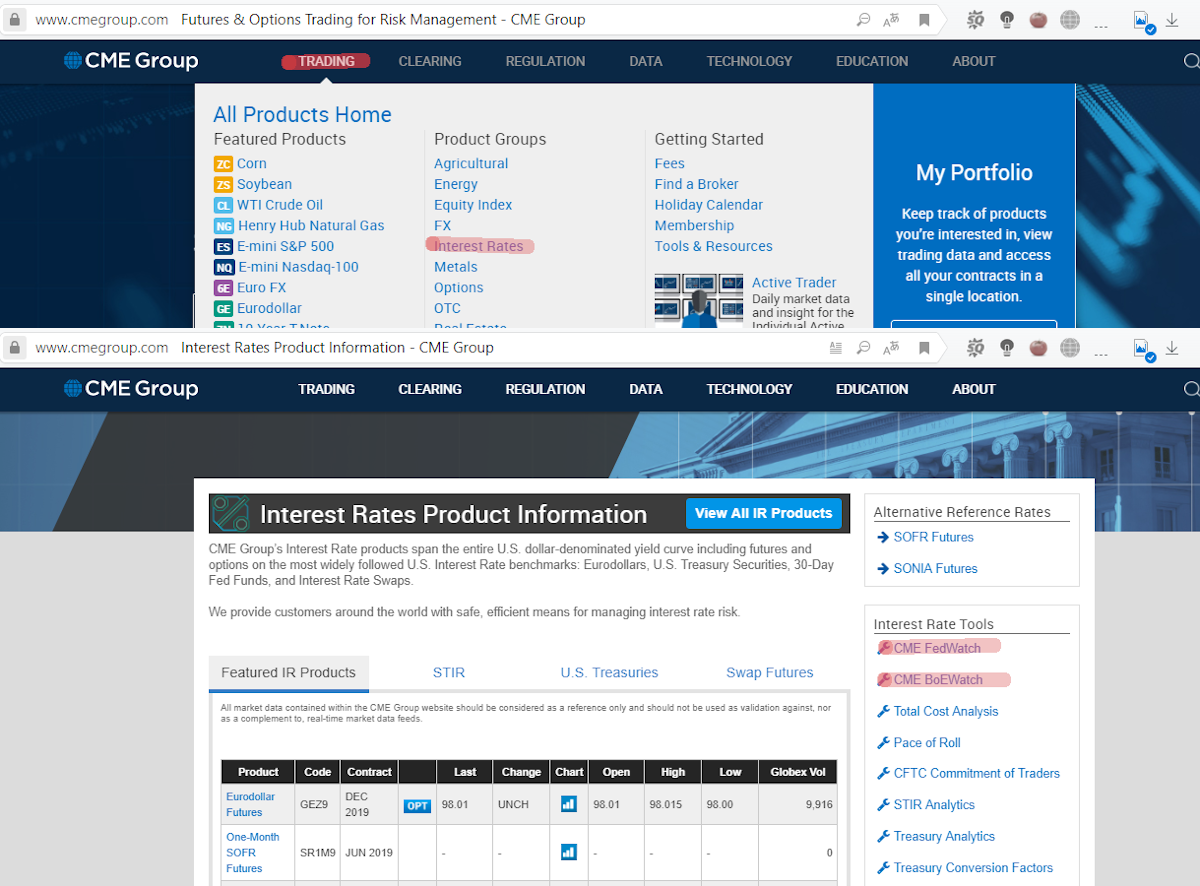
A full description of the FEDWatch and BoEWatch calculation methodology can be found on the CME website. But everything there is in English, and the built-in translator does not translate quite correctly. You do not have to follow the link if you do not need to know how CME Group calculates expectations.
The main assumptions are as follows:
The probability of a rate hike is calculated by summing the probabilities of all target rate levels above the current target rate;
The probabilities of possible Fed target rates are based on prices of Fed futures contracts, assuming that a rate hike is 0.25% (25 basis points) and that the effective Fed rate (FFER) will respond by a similar amount;
The probabilities of FOMC meetings are derived from the corresponding CME Group Fed futures contracts.
So, both the Fed and the Bank of England take into account what the market expects from them. In the entire history of trading such futures, and that is more than 50 years, they have never once gone against the market. But the market also changes its expectations, analyzing the same data as the Fed, that is, at the same time as Fed officials. Therefore, market expectations change. This is yet another system with feedback. The Fed does not change the rate until the market shows its readiness for it. The market shows its readiness for a rate change when the Fed really needs it. Here one can draw an analogy with a mercury thermometer and an antipyretic. When the temperature rises, mercury expands; when it cools, it contracts. In the confined space of a thermometer, this looks like the mercury column rising and falling. If the temperature is high, the patient starts taking fever reducers. It is the same here.
When the economy worsens (it does not matter how, because deterioration in terms of business activity leads to lower rates, while deterioration in terms of inflation leads to higher rates), the Fed and other institutions send signals (raise the temperature in the media) that the rate should be changed sooner or later. Therefore, investors in the market (exchange mercury) take certain actions (what exactly can be read in the link to the calculation methodology given above, but that is not necessary), which ultimately lead to changes in expectations of a rate change. At some point in time, the market becomes ready for the change (that is, more than 70-80% of investors expect a change), and then it becomes inevitable (a high temperature of expectations implies taking a fever reducer). If the market is undecided (about 50% expect a rate change, about 50% expect the rate to remain unchanged), then the Fed is also more likely not to change policy than to change it. But in the comments it will hint at what it is going to do in 1.5 months if conditions do not change during that time, that is, it will bring clarity to the situation. And this will lead to a change in the balance of rate expectations for the next meeting.
I will repeat the idea once again: the Fed does not change the rate just because, because the business of very serious people depends on it. If, however, we move away from conspiracy theories toward bureaucracy and economic management (the Fed's mandate also implies influence on unemployment, and rates affect the level of unemployment through a decrease/increase in business activity), then we can say that the stability of the financial system implies minimizing systemic risks as much as possible, therefore any actions of the regulator simply must be predictable, even in an unpredictably changing environment.
FEDWatchtool and BoEWatchtool: how to use them

To use these tools, you need to have some basic skills.
The ability to read tables and charts, as well as use the proposed toolkit;
Understanding the principle of distribution of investors' expectation probabilities;
The ability to compare tables, charts, and changes in the information on them over the long term.
Learning to read the chart
Here is a screenshot of the page, and now we will examine the meaning of all the buttons we need.

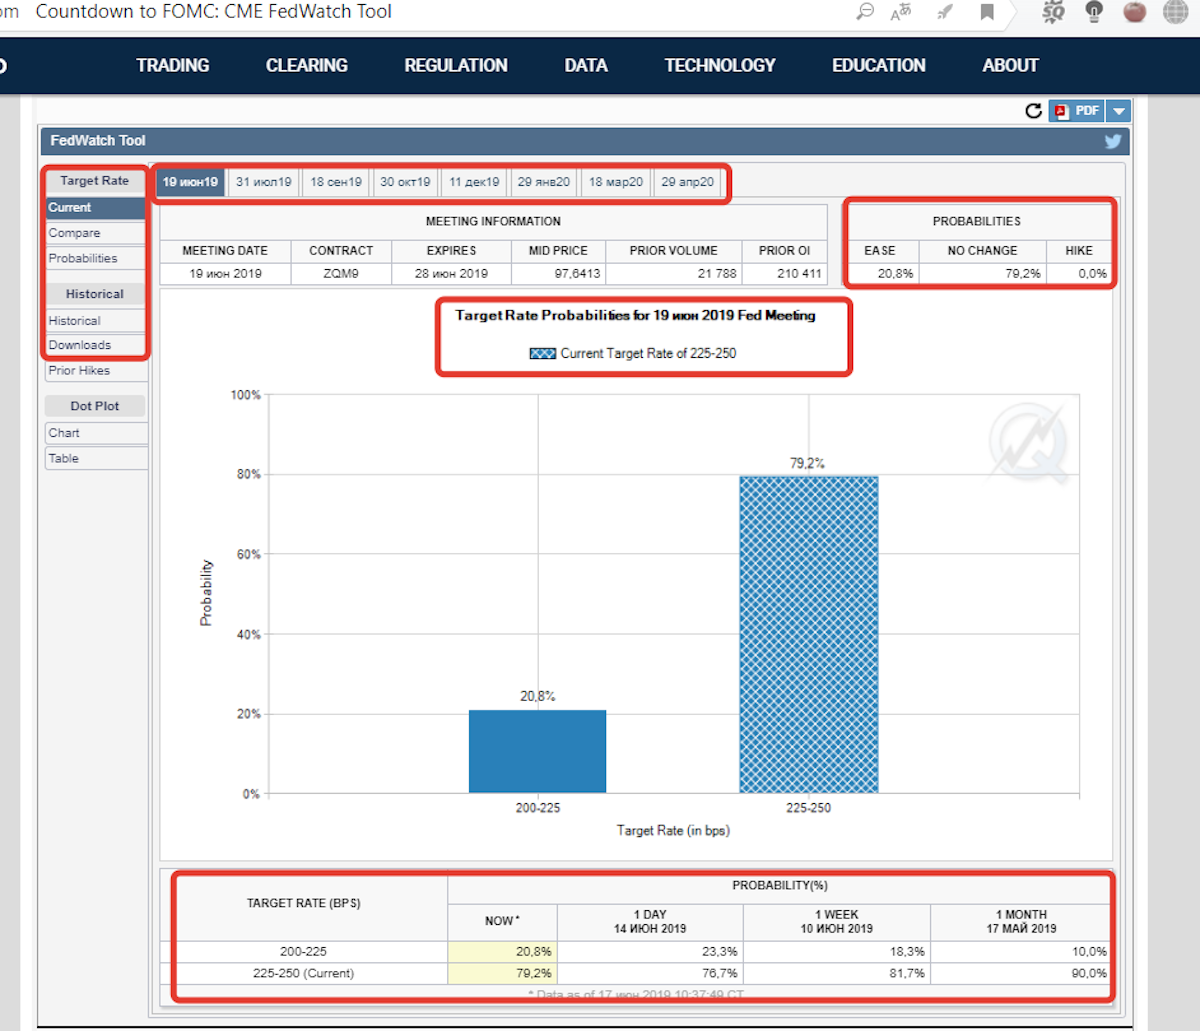
With red rectangles I highlighted the areas that are most important for us.
At the top we see a menu with links to expectations for the nearest 8 meetings. Literally tomorrow (June 19) the next meeting will take place, so we will learn using it, as well as using expectations for the July 31 meeting.
On the left we see a menu in which I will describe the following buttons: current, compare, probabilities, historical. By and large, for most readers the current button alone will be enough.
In the Meeting information section we see all the information about the futures contract linked to the rate expectation calculations. In general, that information does not matter much to us.
But the Probabilities section is very useful indeed. In essence, it reflects in compressed form the information shown on the chart. By “compressed” I mean the following. The table has only three options: cut, unchanged, and hike. But the chart may have more options, because a cut may be 0.25% or 0.5 percentage points.
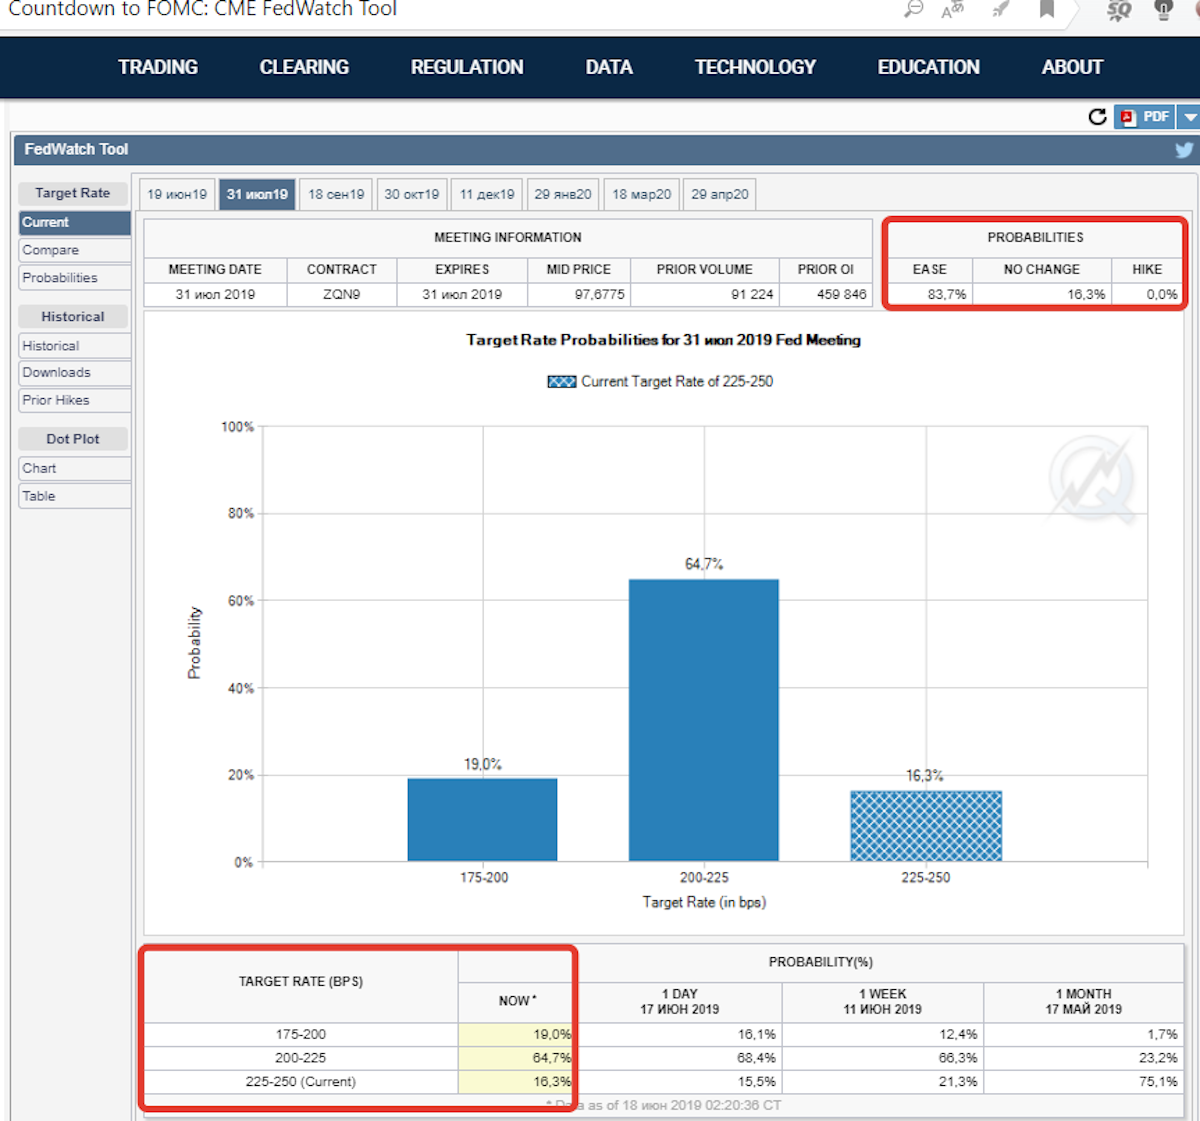
Here, for example, are the expectations for the July meeting. Right now we see that the probability of a cut is 83.7%. That is very high. But how are these expectations really distributed, since we literally read yesterday or the day before that GoldmanSachs denies a sharp rate cut. On the chart we see that with a probability of 64.7% there will be a 0.25% cut, which is the minimum step. And a “sharp” cut, that is, an immediate 0.5% cut, can happen only with a probability of 19.0%. This probability, by the way, is in fact equal to the probability of leaving rates unchanged on July 31 (16.3%). The same information is presented in the table below the chart, which we will examine in detail a little later.
After the Probabilities section, we should probably examine the chart. But we have already examined it. Each bar is the probability of one event or another. I do not think there is any need to explain more. Let me just remind you once again that for a simple understanding of the situation, it is necessary to track how much the probability of an overall rate change exceeds the probability of keeping it unchanged. The most interesting situation is when the market expects a change, but the size of the change is unclear. It is in such situations that sharp moves occur in the market.
In short, tomorrow the rate will definitely not be changed, and in July it will be changed unless something changes over 1.5 months. But the probability is small.
There is another table below the chart. In the first column (target rate), the rate ranges that are relevant one way or another at this meeting are indicated. And in the next 4 columns, data are shown for rates on the current date, 1 day before the current date, a week before, and a month before the current date. Thus, this table allows us to analyze the dynamics of expectations for changes in the Fed rate. In the figure devoted to the July meeting, it is clearly visible that over a month expectations changed to the exact opposite, that is, an inversion of expectations occurred. There are still 1.5 months until the July meeting itself, during which there will be the June meeting, the G20 meeting, and a number of other events, the sum of which may change expectations in one direction or another. So expectations should be monitored at least once every two weeks in order to stay in the same information field as the real financial sharks.
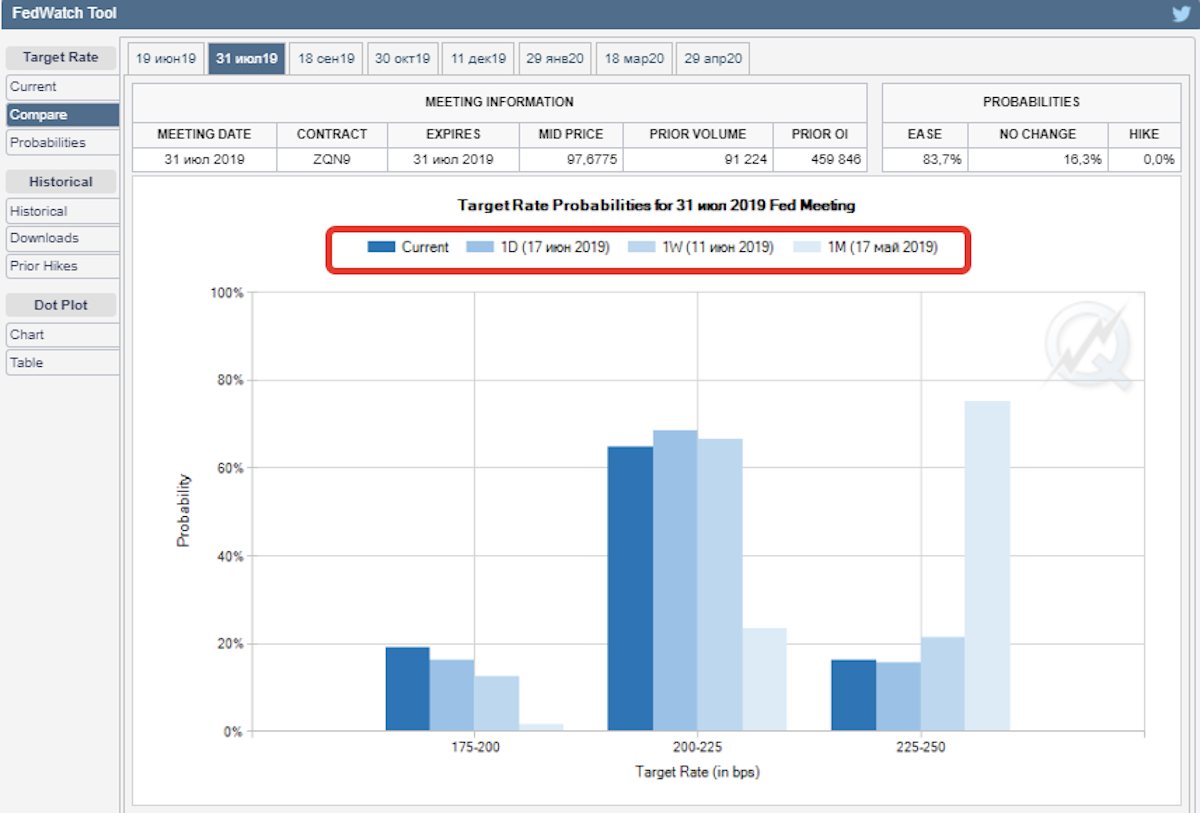
It is time to move on to the next sections of the left menu. Click the Compare button and we get a chart like this for the current rate. What does it show us? In essence, nothing new. It is simply a table of expectations for today, yesterday, a week ago, and a month ago expressed in graphic form. In general, everything is simple and clear. Once again I recommend assessing how radically expectations for the July meeting changed over a month.

The next link in the menu is Probabilities.
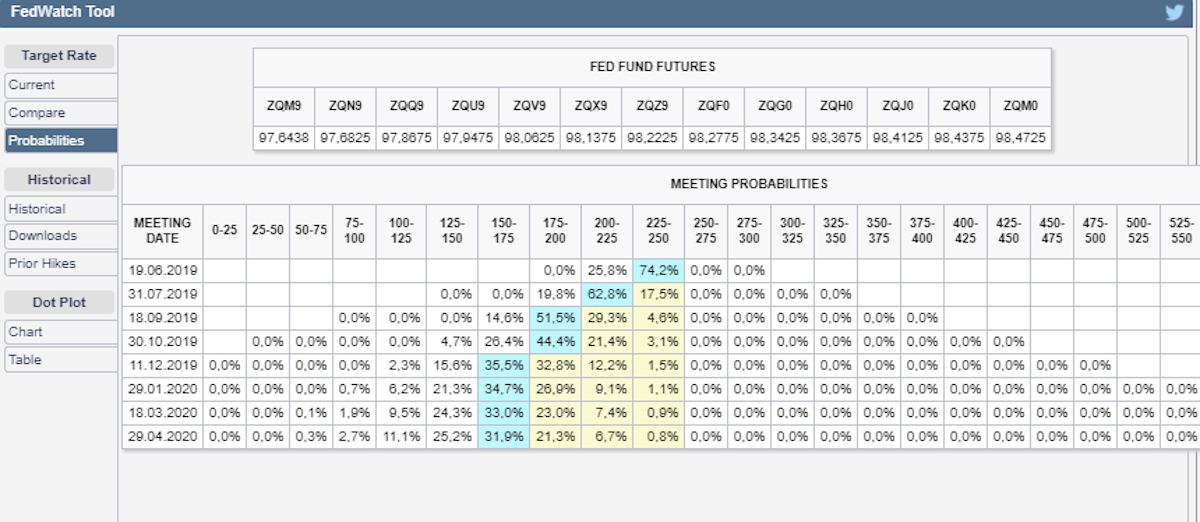
This is quite an informative table with the distribution of rate probabilities for the nearest 8 meetings, that is, for a year ahead. Naturally, the probabilities of rate changes change, but if you have correctly understood the Fed's mandate, on the one hand, and the principle for calculating these probabilities, on the other hand, then this table will show you the REAL EXPECTATIONS OF LARGE TRANSNATIONAL BUSINESS regarding the prospects of the American and global economy. Right now expectations are such that by the end of the year the rate will be 0.5%, and maybe even 0.75%, below the current one. Clear?
The last two links that interest us are Historical and Downloads. By following the first link and selecting the meeting of interest (July 31, because it is at that meeting that the rate will most likely be cut), you can see the change in rate expectations for that meeting over a year.
Remember what was happening in the first third of December 2018? Do not remember? Too bad, you should remember such things if you trade on the exchange. That was when the stock market collapsed and, in general, everything was bad, bad. And that was exactly when the markets reacted with a sharp change in expectations. And the Fed had not yet said anything specific, and was even hinting at a hike. Remember the thermometer? Well, that was it. In short, at that time investors completely forgot about rate hikes, but from mid-March they began to think about cuts.
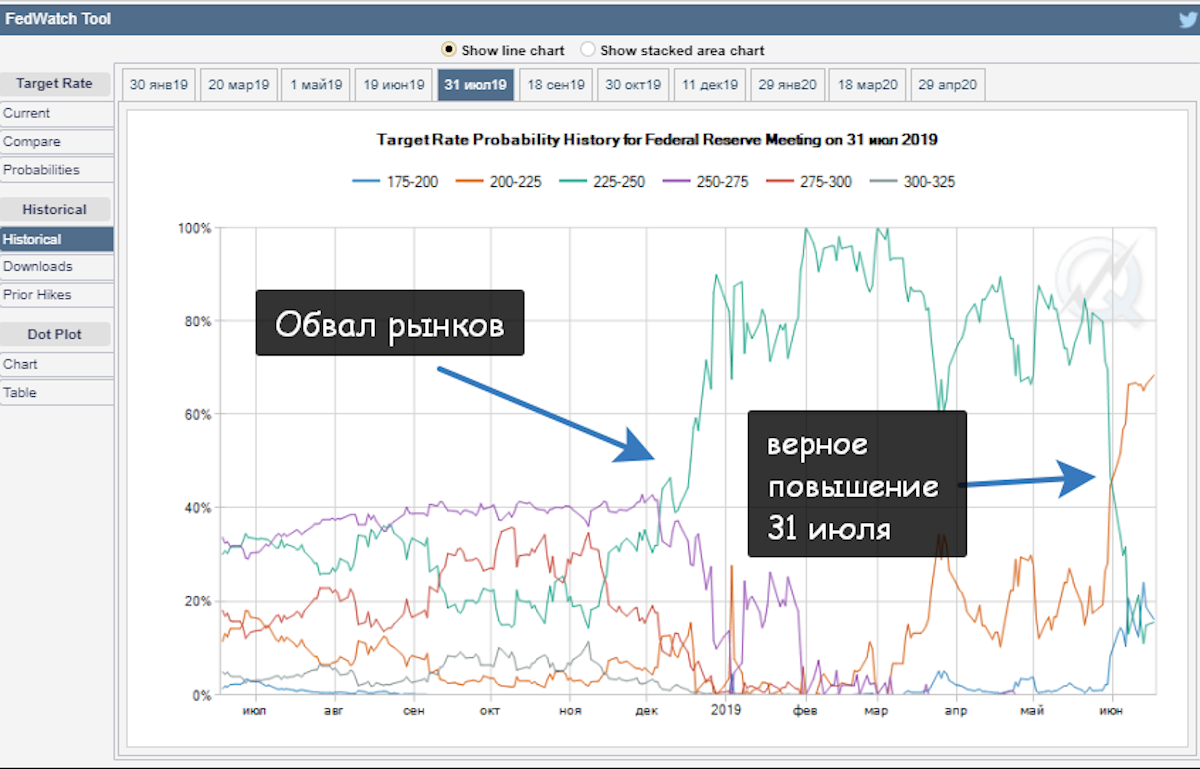
And literally in recent days (since the end of May), there is no longer even the slightest talk of keeping the rate unchanged. Interesting, right?
Let us move to the last link that interests us, Downloads. This is, in essence, the same as the Historical link, only here you can download this information in a convenient format and analyze it in the way you need. But do you need that? I do not think so. But monitoring expectations, absolutely.
But just the other day (since the end of May) there was no longer any talk of keeping the rate unchanged. Isn't that interesting?
Let's move on to the last link we are interested in - Downloads. This is essentially the same as the Historical link, only here you can download this information in a convenient format and analyze it the way you need. Do you need it? I don't think so. But monitoring expectations is more than enough.
What's on the Bank of England's agenda?

The day after the Fed meeting there will be a meeting of the Bank of England. I won't say anything about him. Just follow the link to BoEWatchTool that I gave above, or find this link yourself and look at investors’ expectations for the rate. When and how is the Bank of England policy expected to change? That's it. Oh, and be sure to watch for changes in expectations after Thursday's meeting.
Conclusion

Best regards, Ivan Rusin
Tlap.io