
How to determine the real value of a national currency?

Hello, fellow traders and readers interested in the topic of currency speculation!
The exchange rate of the national currency is a topic close to everyone who has lived through an economic crisis or a default. During periods of rapidly changing frightening numbers on exchange office boards, many of us criticized the Central Bank for its "clumsy" policy of managing the value of the national currency.
After reading the article, you will be able to quickly and easily calculate the real exchange rate of the national currency on your own or determine it for any pair on the Forex market.
Algorithms for calculating the national currency rate

In the 21st century, the type of exchange rate is determined by the recommendations of the International Monetary Fund to local Central Banks. The methodology includes 10 algorithms for determining the value of money, divided into three main regimes:
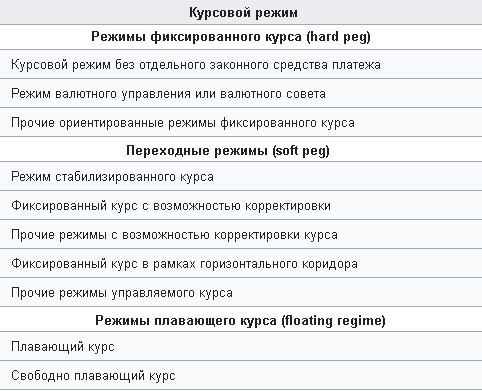
If a country's money has the status of being freely convertible, its value is determined by the laws of supply and demand on the international Forex currency market, where it is compared with the U.S. dollar. The American currency was chosen as the basic measure of the value of any other national currency by the decision of the G7 Jamaica Conference held in 1976.
A floating regime means that every participant with access to the interbank market can buy or sell such a currency in any volume 24 hours a day, except on weekends, but this does not remove the influence of the Central Bank from it.
Floating mode means that each participant with access to the interbank market can buy or sell such currency in any volume 24 hours a day, exceptweekends, however, this does not remove the influence of the Central Bank from it.
Nominal and real exchange rates of the national currency

In addition to the named external factors of regulating the flow of goods, the main bank of any country is obliged to stimulate the domestic economy, fight inflation, ensure affordable loans, etc. The totality of these measures is called monetary policy, which determines the nominal rate, often far from the real valuation.
The nominal exchange rate of the national currency is the Forex market rate for the floating regime of freely convertible currencies or its value on the local currency exchange, limited by some conditional price corridor or determined in a discrete trading regime.
The real exchange rate of the national currency is determined by its purchasing power abroad. In theory, it is calculated through a sample of identical goods. It is enough to estimate how much some conditional consumer basket costs at home and compare it with the amount spent in another country. By comparing the final results in foreign and national currency, we obtain the real exchange rate, which does not always coincide with the nominal value.
This method is called determining purchasing power parity, and economic theory offers five models for determining the real exchange rate of the national currency. Before diving into theory and formulas, it is important to understand why this knowledge is needed.
This method is called determining consumer value parity; economic theory offers five models for determining the real exchange rate of the national currency. Before diving into the theory and formulas, it is important to understand why this knowledge is needed.
Why do you need to know the rate determination mode and the real value of national currencies?

Knowing the pricing regime, it is possible to determine a strategy for entries at the boundaries of the basket's value. Examples of trading such currency pairs with the help of currency corridors are presented below.
Determining the real value of national currencies is a tool of medium-term and long-term arbitrage strategies. As has already been shown above, the Central Bank is a hostage of the current economic situation: inflation, foreign trade turnover and balance, sanctions, the policy of the government, the president, etc.
If a currency speculator has determined the presence of a strong distortion between the nominal and real value, he can count on the failure of the state's monetary policy.
Despite all the power of the Central Bank, the possibilities for manipulation or artificial restraint of the value of the national currency are not limitless. In the end, large players-arbitrageurs will throw quotes back to levels of "fair" or real value, and it will be possible to earn a decent profit from the distortion.
The most striking example of such a development is the confrontation between George Soros and the Bank of England, which was mistaken in its ability to maintain the pound sterling's peg to the ecu, the predecessor of the euro.
Such collapses are a rare phenomenon, but in the medium term deviations often make it possible to "catch" future reversals or continuations of the trend for 400-600 points.
Such collapses are a rare occurrence, but in the medium term, deviations often make it possible to “catch” future reversals or continuationstrend400-600 eachpoints.
Trading at the boundaries of the nominal value of national currencies under fixed and transitional regimes

When checking the list of fixed and transitional rates against the pairs available from a broker, try to choose the national currencies of developed states with stable economies. As an example, let us consider several currency pairs and the principles of arbitrage work.
By checking the list of fixed and transitional rates with the available pairs frombroker, try to choose the national currencies of developed countries with stable economies. As an example, let's look at several currency pairs and the principles of arbitrage work.
Danish krone (DKK)

These figures indicate the parameters of money management: a trader should build in a durability reserve for the deposit up to a 20% drawdown. Consequently, the leverage for the USDDKK pair should not exceed 1 to 5.
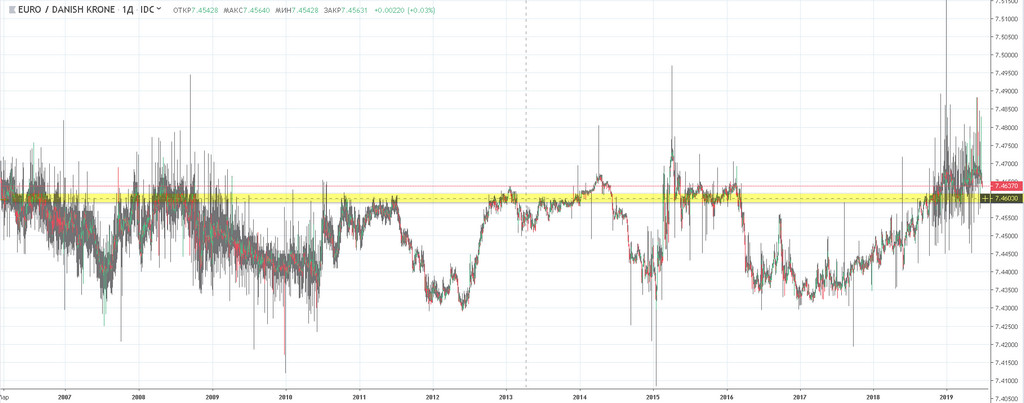
To ensure yourself a large number of trades, it is better to determine the market entry signal when a 0,25% divergence in EURDKK occurs at the moment the daily candle closes or during the session. By adding and subtracting this value from the peg coefficient of 7,46038, the trader will obtain a corridor bounded above and below by the levels 7,48 and 7,44.
The entry direction will be determined by divergence and the position of the Danish krone relative to the euro. However, the trader should take into account that Forex brokers only offer the USDDKK pair. If the DKK rate is overvalued, it is worth opening a long on the USDDKK pair (note the reverse quote); a rate value below 0,25% is a reason to open a short.
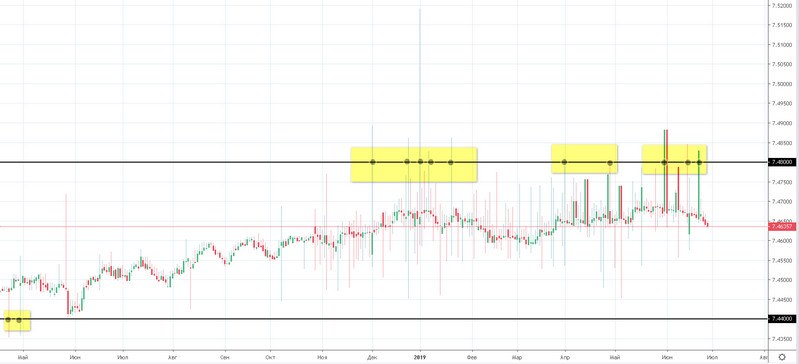
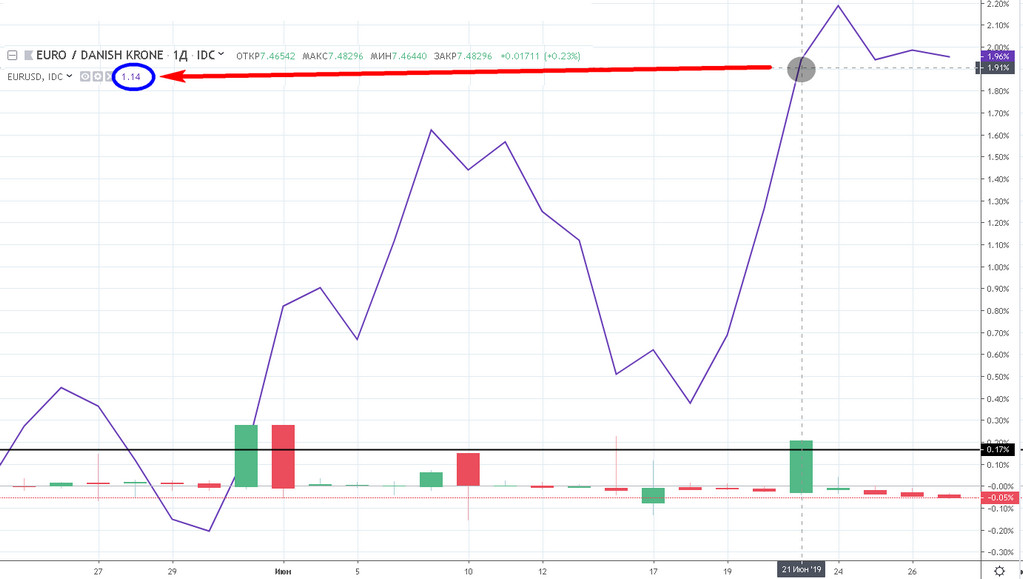
In order not to perform calculations every time, you can use a visual method for determining divergences by using EURDKK charts in the TraidingView service. As soon as the quotes cross the signal line, switch to the USDDKK chart.
To calculate the Danish krone rate in dollars, use the reverse euro quote and the peg coefficient. For example, at the start of the day on May 24, the value of the euro (we calculate it in reverse quotation against the dollar!) was Open Price 1/1,11799=0,8944. Knowing that the peg coefficient is 7,46038, we determine the nominal DKK rate = 0,8944*7,46038 =6,6725.
Let us consider an example of entering a trade on the signal of the TraidingView EURDKK chart. As can be seen from the screenshot, on June 21 the value of the krone exceeded the threshold value we established, which gave a signal to sell DKK at the end of the session.
To reliably calculate the USDDKK rate, let us add the EURUSD comparison line to the chart from the same quote data provider as EURDKK (in our case, this is ICE). Note that the pair's rise occurred with EURUSD at 1,14.
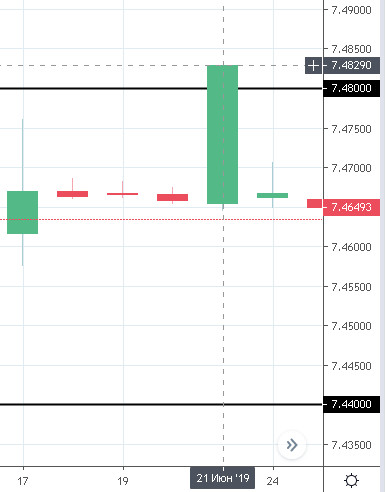
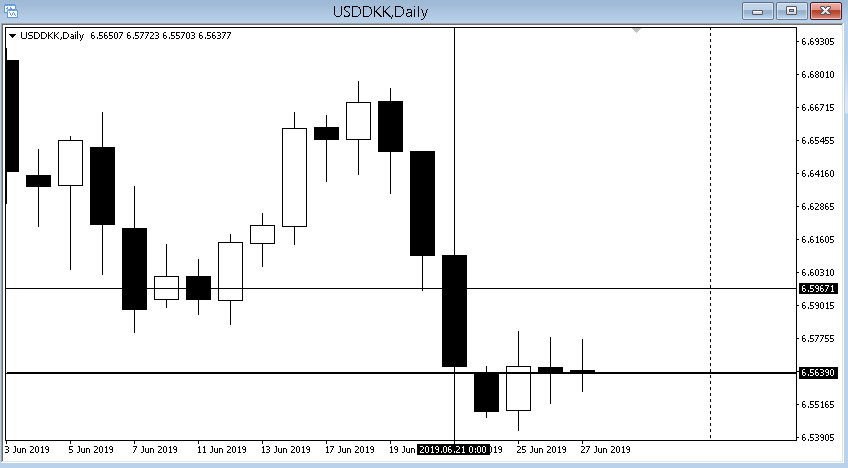
Let us calculate the level for opening a USDDKK long: 1/1,14 (EURUSD rate) = 0,87719*7,48290 = 6,5639. As can be seen from the Alpari broker chart, quotes reached such a level only after the weekend on June 24. Thus, our long was opened later and brought profit only on June 25.
Let's calculate the long opening level USDDKK 1/1.14 (EURUSD rate) = 0.87719*7.48290 = 6.5639. As can be seen from the chart of the Alpari broker, quotes reached this level only after the weekend of June 24. Thus, our long was opened later and broughtprofitonly June 25th.
UAE Dirham (AED)

As a result, the chart of the UAE national currency looks like a series of candles with long tails, above and below the boundaries of which it is worth placing pending orders.
The figure shows a chart of weekly candles, where possible trade levels are visible at first glance, but there are nuances in such trading. First, there are only two brokers ready to provide access to the USDAED pair; second, they ask for a minimum deposit of $10 000; third, the maximum leverage on this currency is 1 to 5.
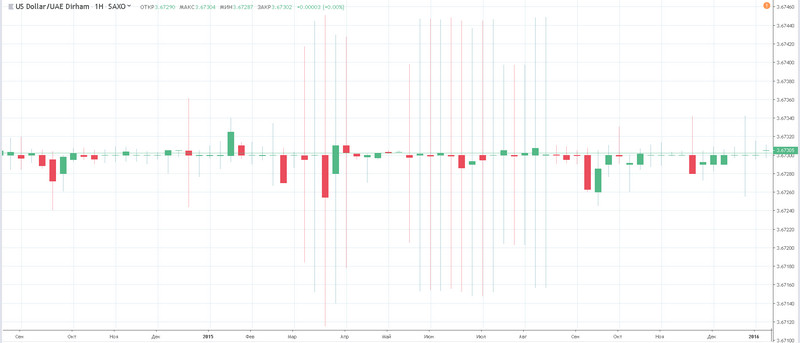
The figure shows a chart of weekly candles, where possible transaction levels are visible at first glance, but there are nuances in such trading. Firstly, there are only two brokers willing to provide access to the USDAED pair; secondly, they ask for a minimum deposit of $10,000; thirdly, the maximum leverage on this currency is 1 to 5.
Models for determining real exchange rates

The purchasing power of a national currency relative to any other currency is determined in four ways, which we will discuss below.
The purchasing power of a national currency relative to any other currency is determined in four ways, which we will discuss below.
Law of One Price - comparing the cost of the same product in different countries

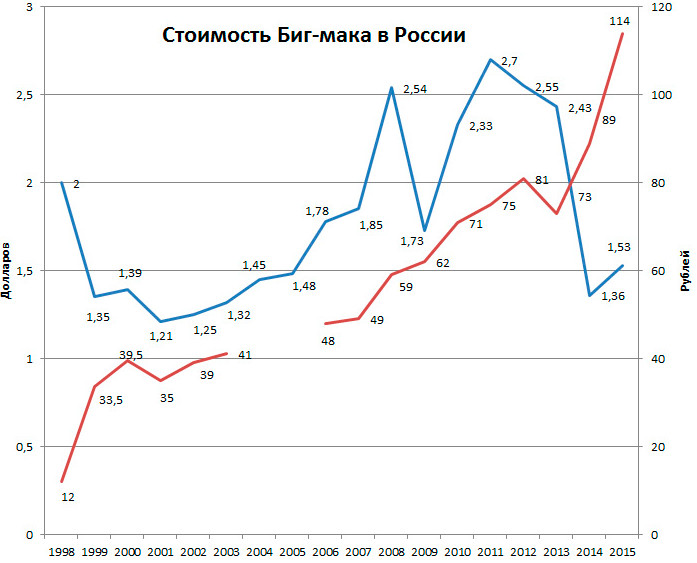
The most popular and well-known way of using this formula is the Big Mac Index, which compares the cost of a standard McDonald's sandwich in different countries of the world.
According to data from a specialized website, a Big Mac in Russia cost 130 rubles in January 2019, while in the USA the cost was 5,58 USD.
130=66,91 (Central Bank of the Russian Federation rate)* 5,58;
66,91=130/5,58 = 23,29.
The formula shows that the national currency rate is lowered, or undervalued, by more than two times. Such a difference almost coincides with the size of the gap that formed at the "zero point" of reference, the moment the first McDonald's opened in Moscow. Exactly one year later, an economic and political crisis broke out.
In 2009, the gap between American and Russian prices for the famous sandwich shrank to 30%, but then began to grow constantly, reaching 50,8% in 2014. It can be assumed that the current value of the Big Mac Index points to a new round of crisis phenomena in the economy. Take advantage of the moment of the "cheap dollar"; perhaps, with the ruble strengthening, it makes sense to increase the share of savings in this currency.
In 2009, the gap between American and Russian prices for the famous sandwich decreased to 30%, but then began to constantly grow, reaching 50.8% in 2014. It can be assumed that the current value of the Big Mac index indicates a new round of crisis phenomena in the economy. Take advantage of the “cheap dollar” moment; perhaps, as the ruble strengthens, it makes sense to increase the share of savings in this currency.
Absolute purchasing power parity

For example, in Australia the subsistence minimum amounted to 600 AUD in 2017, whereas in the European Union it was equal to: in Germany 1240 euros, in France 1254, in Italy 855.
The euro is a common currency for 26 states, so the three largest EU economies were chosen in order to use the average value (1240+1255+855)/3= 1117 in the formula.
If 1117 is the average EU subsistence minimum and 600 is Australia's subsistence minimum, then by solving this expression we get 1117/600 =1,86.
In 2017, the EURAUD rate was 1,38. As can be seen from the currency pair chart, the arbitrage correctly predicted the trend toward euro strengthening.
In 2019, the difference in subsistence minimum levels was reduced almost to zero, so those who hold a long position in this cross should be careful.
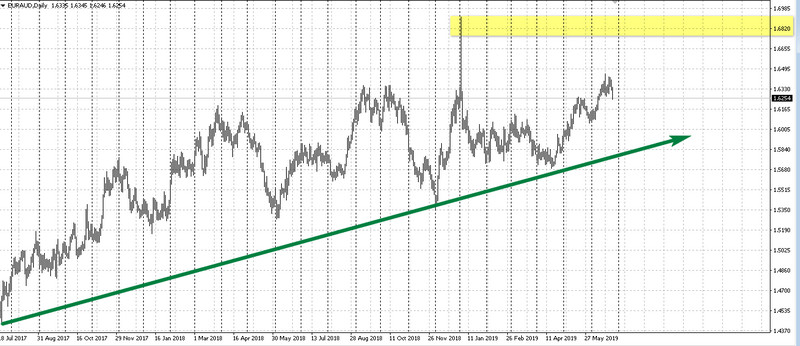
In 2019, the difference in cost of living levels was reduced to almost zero, so those who hold a long position in this cross, be careful.
Relative trade parity

For example, the consumer price index in the USA in 2012 was equal to 119,4 and rose to 121 by 2013. During this period, the EU CPI showed values of 118,3 and 120,1. The EURUSD rate changed from 1,30 to 1,36.
Using the formula, let us calculate the real euro exchange rate by taking the 2012 value of 1.30 and sequentially multiplying it by the fraction of the relative values of the American CPI 121/119,4 and the European 120,1/118,3:
1,3* (121/119,4) *(120,1/118,3) = 1,3374.
As can be seen from the formula, the euro rate turned out to be undervalued, which led to the collapse of 2014, where parity was leveled due to the monetary measures taken by the ECB and the Fed.
The consumer price index is essentially an indicator of inflation, which Central Banks primarily focus on when making decisions on the size of the discount rate. In economic statistics, you rarely encounter publication of this indicator in relative units; everywhere there is a percentage change, which can also be used in another model.
The consumer price index, in essence, is an inflation indicator that central banks primarily focus on when making decisions on the size ofdiscount rate. In economic statistics you rarely see the publication of this indicator in relative units; everywhere there is a percentage change, which can also be used in another model.
Relative inflation parity

The current exchange rate of a currency pair can be represented as equal to (1+annual inflation of one state/1+annual inflation of another country) * the current rate of the pair on the Forex market.
Let us calculate the EURUSD rate in 2015. At the end of this period, U.S. inflation was 0,73%, whereas in the Eurozone it was equal to 0,08%.
The real EURUSD rate at the end of 2015 = (1 +0,0083)/(1+0,073)*1,0565= 0,992.
EURUSD quotes at the beginning of 2016 turned out to be undervalued, and the rate-hike policy adopted by the Fed did not immediately save the situation: the market saw values close to 1.02 before the value of the European currency began to rise.
This formula can be used to forecast the exchange rate if future inflation is substituted into it, which Central Banks rely on in the reports they publish at each monthly meeting.
This formula can be used to forecast the exchange rate if we substitute future inflation into it, which Central Banks count on in published reports at each monthly meeting.
Conclusion

However, any beginner trader can assess with sufficient accuracy the overbought or oversold state of an exchange rate using simple mathematical constructions based on real current economic indicators. Sometimes the resulting models will predict the future behavior of the rate more accurately than the economic polynomials of the Central Banks.
Respectfully, Ivan Petrov
Tlap.io
Best regards, Ivan Petrov
Tlap.io
