
How to Apply Cycle Theory on Forex?
 Greetings, fellow Forex traders!
Most technical analysis tools consider prices as the main starting point. But any trading instrument has one more characteristic. It is time.
Of course, any technical analysis tool also takes into account time, but its value is simply implied. Today we will look at time as the main tool of analysis. A rather philosophical topic of time and its application in trading awaits you.
Cycle Analysis

We will talk about so-called cycles. Experts involved in such analysis believe that only cyclicality as a feature of market development is an explanation for the rise and fall of prices. We will supplement the list of the most important technical tools for market analysis with a time parameter and will be able to answer not only the question in which direction and how far the market will develop, but also when it will get there and when this movement will begin.
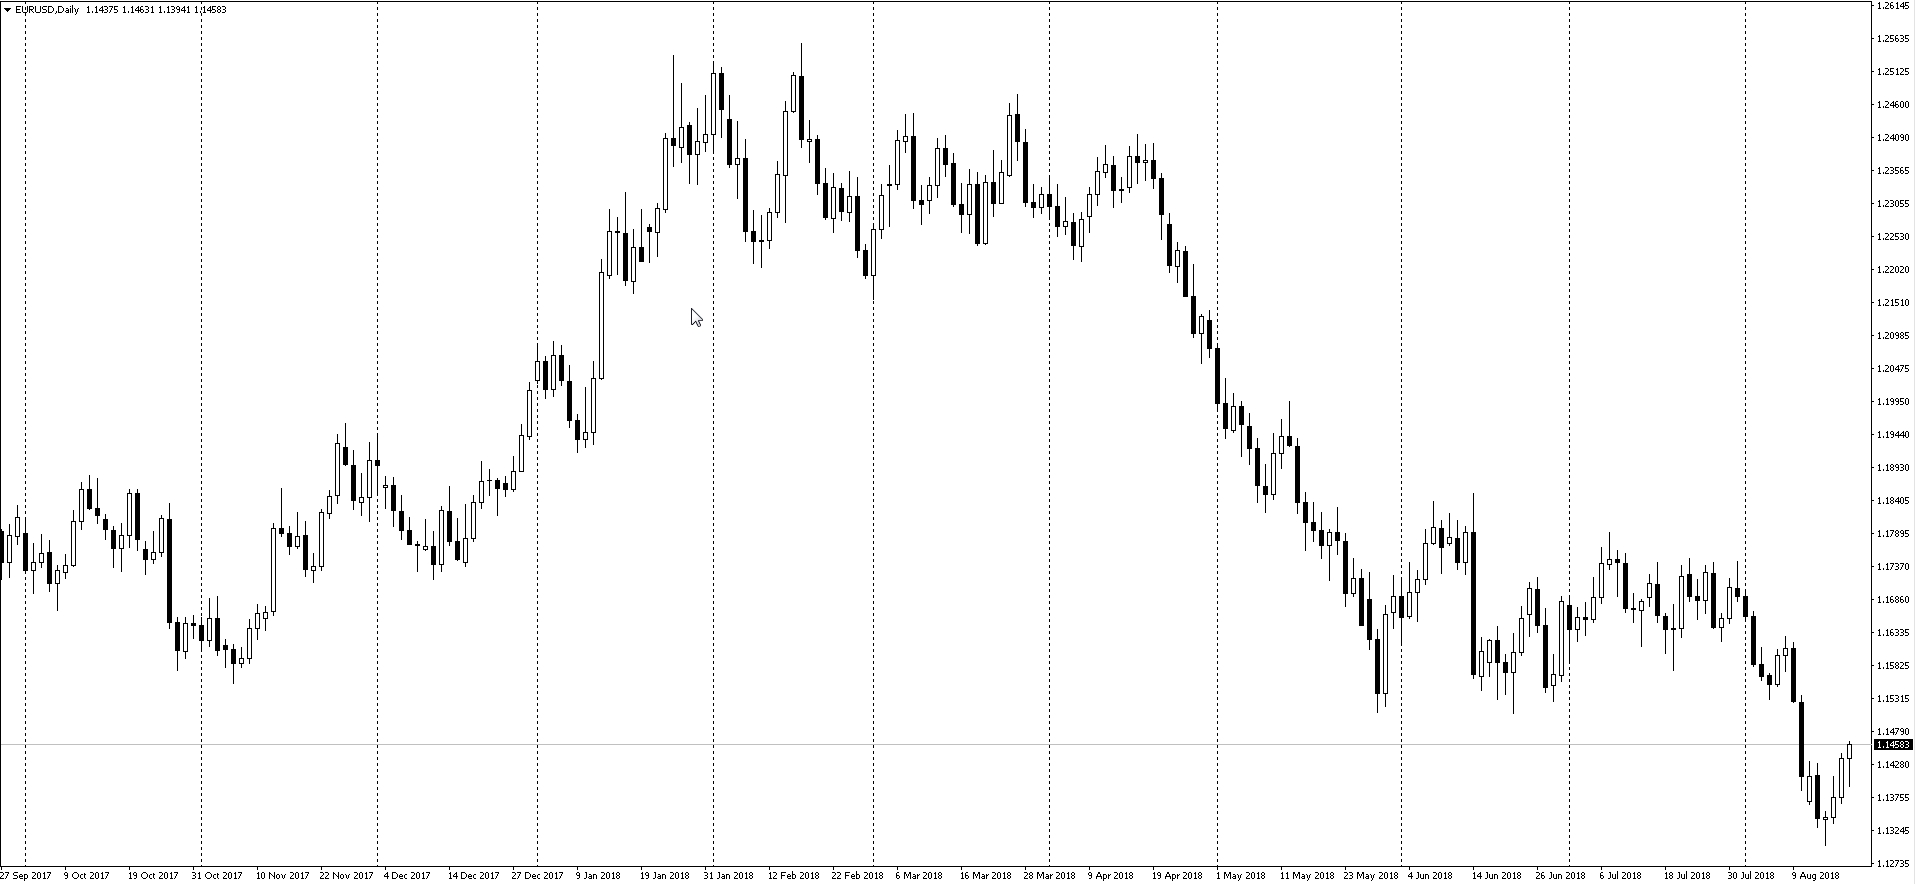 Let's look at the usual daily chart of pairs EURUSD. The price scale is located along the vertical axis. This indicator gives us only half of the necessary picture. The time scale is located along the horizontal axis. Thus, graph is actually a chart of not only price, but also time. However, many traders analyze exclusively price data, completely ignoring the time factor.

When we study graphical models, we understand that there is a connection between the time during which this or that configuration is formed and the potential for further market movement. The longer the trend lines or support or resistance levels, the more they become significant. The time factor is also very important when using moving average as an analytical tool, for which it is very important to choose the appropriate time period. Even when working with oscillators, you have to make decisions regarding the number of days that make up the calculation period.
It becomes clear that any method of technical analysis to one degree or another depends on the time factor. At the same time, the use of time indicators is not always consistent. To increase the efficiency of technical analysis, taking into account the time factor, cyclic analysis is used.
The work of any technical indicator can be significantly improved if cyclical analysis is included in its structure. For example, by linking moving averages and oscillators to dominant market cycles, their performance can be optimized. Cycle analysis can also improve the accuracy of trend line analysis by indicating which lines are significant and which are not. When combined with peaks and troughs in cycles, the ability to analyze price patterns can be greatly enhanced. Using "time windows" you can filter price movements in such a way that unnecessary signals will be cut off, and priority attention will be paid only to the moments of the most important tops and bottoms of cycles.
Predicting the Future and Cycles

Can you predict the future? I can. For example, tomorrow my train will leave at exactly 10:00. Sunset tomorrow will be exactly at 19:51, and sunrise at 5:11. Do you want to bet that this is not so and my predictions will not come true? I think not. What am I actually doing – predicting the future or not?
First of all, we actually predict the future every day. At least in the field of natural or astronomical phenomena.
Secondly, the greater accuracy of our predictions is explained by the fact that there are clearly defined repeating cycles.
However, the presence of cycles in our lives has become so commonplace that we do not attach much importance to predictions based on them. We simply project cycles into the future, assuming that they will repeat.
What do you think of the idea that, in general, a person’s entire life is a repeating cycle of events? I got up in the morning, went to work, and worked. I came, had fun in chat for traders, and went to bed. And so on day after day. What if there are certain cycles in entrepreneurial activity? Then there must also be securities markets. Can there be economic cycles within an entire country? They can.
Quite a lot of literature is devoted to the cyclical nature of our entire lives. For example, an excess of Atlantic salmon occurs every 9.6 years. Every 22.2 years, a military conflict occurs in the world. Sunspots appear with an amplitude of 11.11 years. The real estate market has cycles of 18.33 years. On the securities market – 9.2 years.
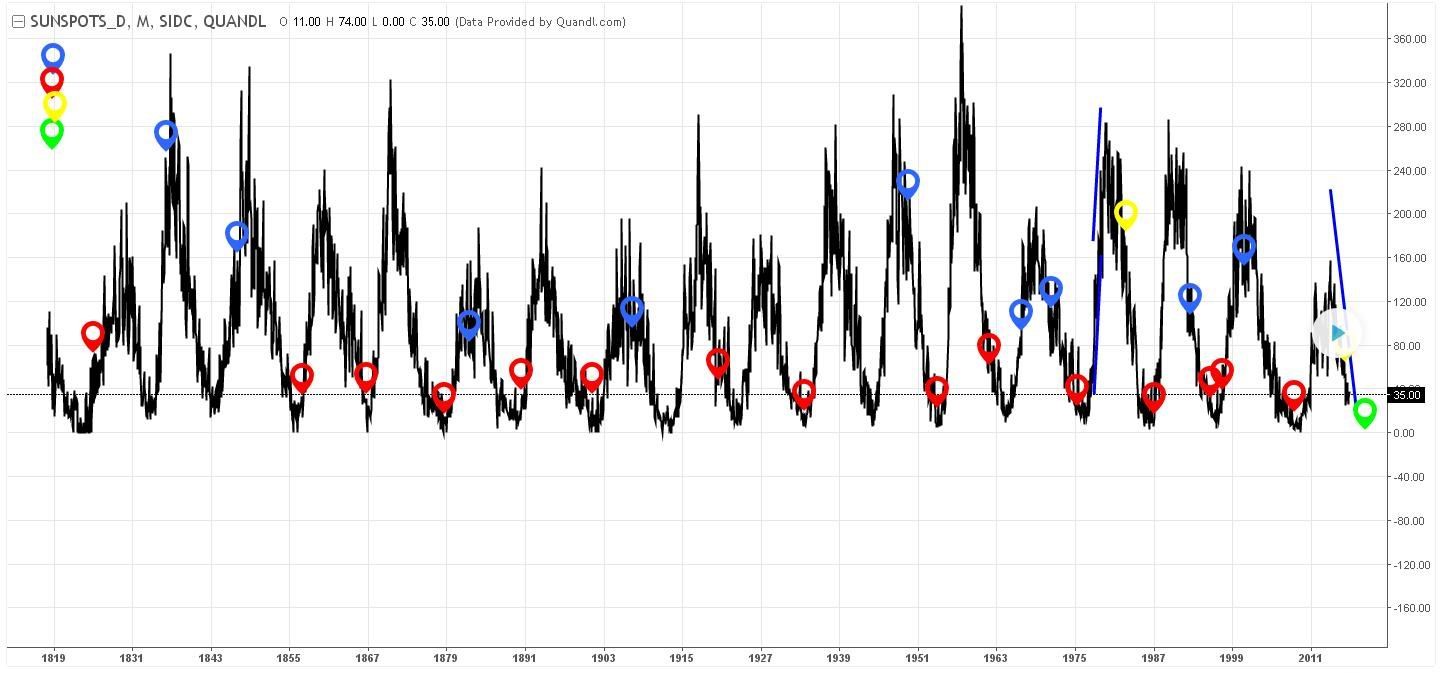 The picture above shows solar activity cycles. Blue circles indicate local crises. Red - world ones. Yellow - oil. Here is a link to this chart in tradingview. Judge for yourself.
The following drawing will generally bring you a lot of thought:
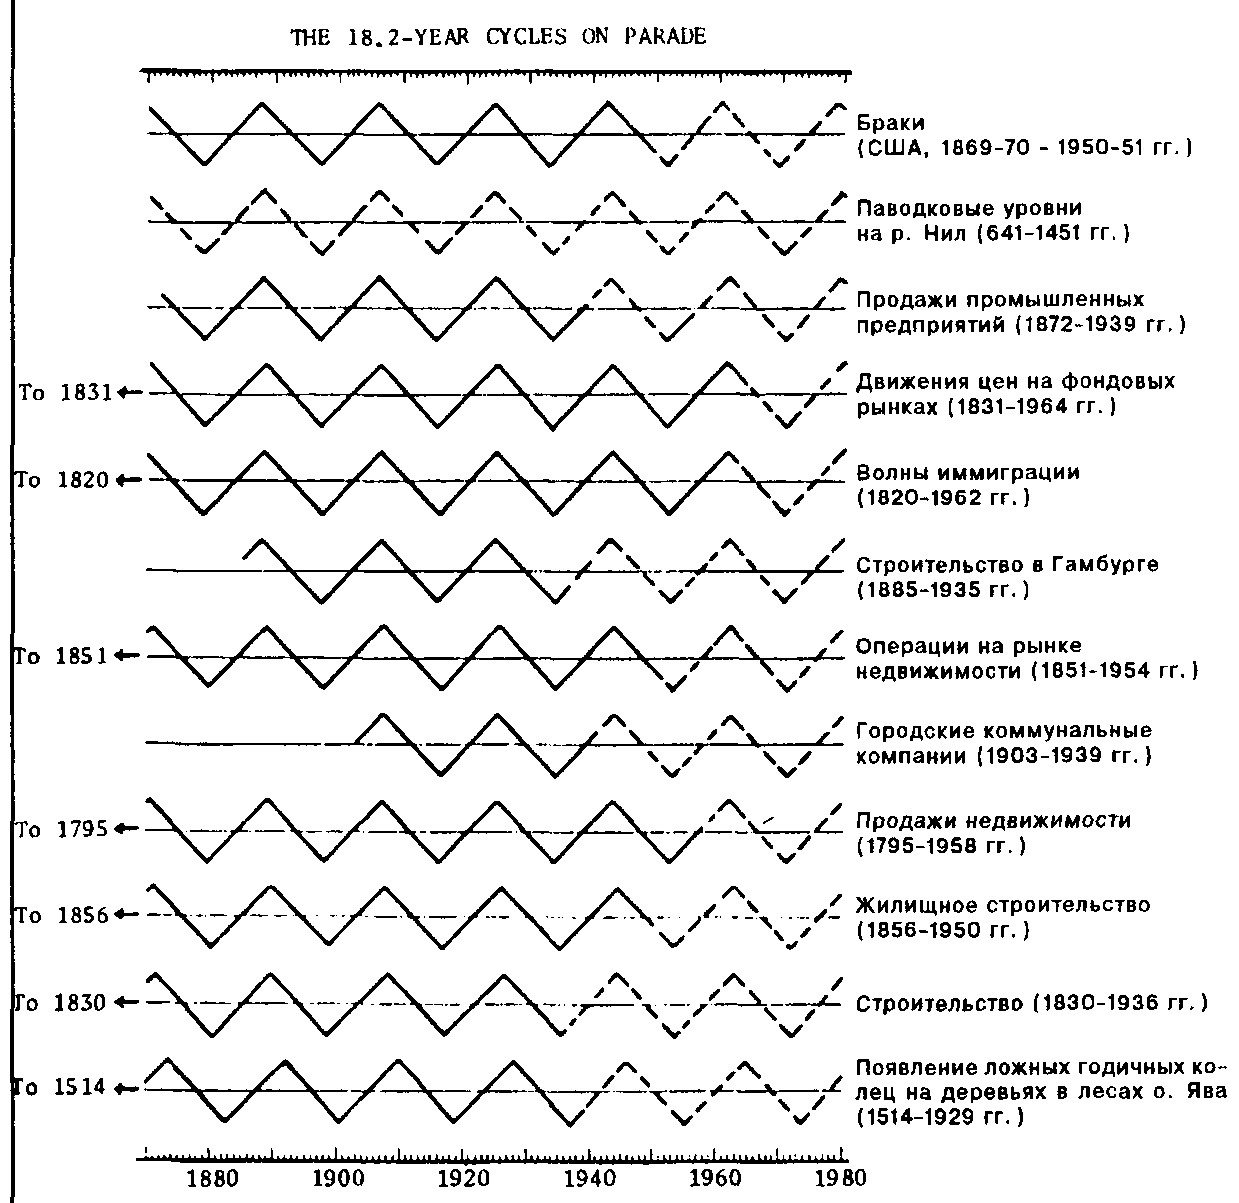 As you can see, cycles really exist, this is undeniable fact. All that remains is to figure out how to use them.
Basic concepts of cyclic analysis

In 1970, J. Hurst published a book called "The Mysterious Art of Timely Operations in the Stock Markets." Although the book is mainly devoted to cycles that determine the functioning of stock markets, it represents the most complete and accessible exposition of cycle theory. Three years after the book was released, Cycletech Services published a training course on cycle analysis based on Hurst's book. Unlike Hurst's book, this course also covers the analysis of cyclicality in several other areas, in particular in commodity futures markets.
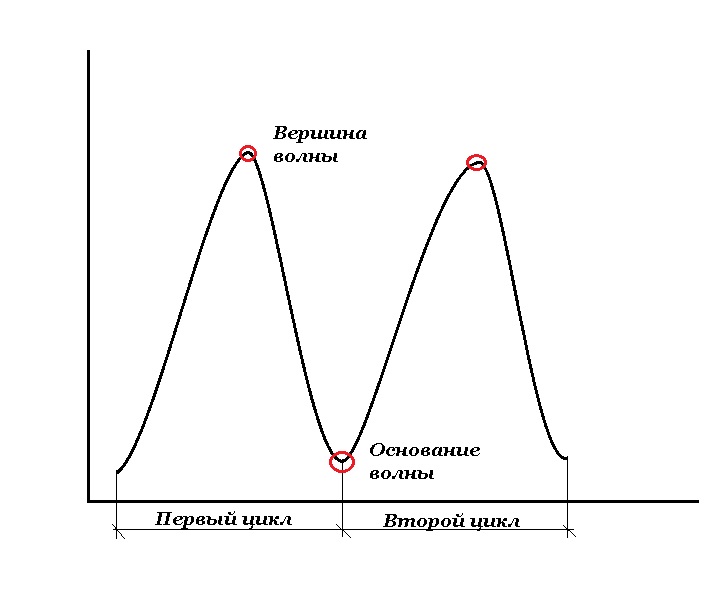 The example above shows two repetitions of a price cycle. The lower point of the cycle's development is called the trough, and the upper point the crest. Note that the two waves shown in the example are measured from trough to trough. In cycle analysis, it is customary to measure the length of cycles between the lower points. It is possible to measure the distance between crests, but the parameters obtained in this way are considered unstable and therefore not as reliable. Thus, the most common way of determining the beginning and end of a cycle is to measure the cyclical wave at its lower points.
The main characteristics of a cycle are amplitude, period and phase. Amplitude measures height and is expressed in dollars, cents or points. The period of a wave measures the time passing between the lowest points.
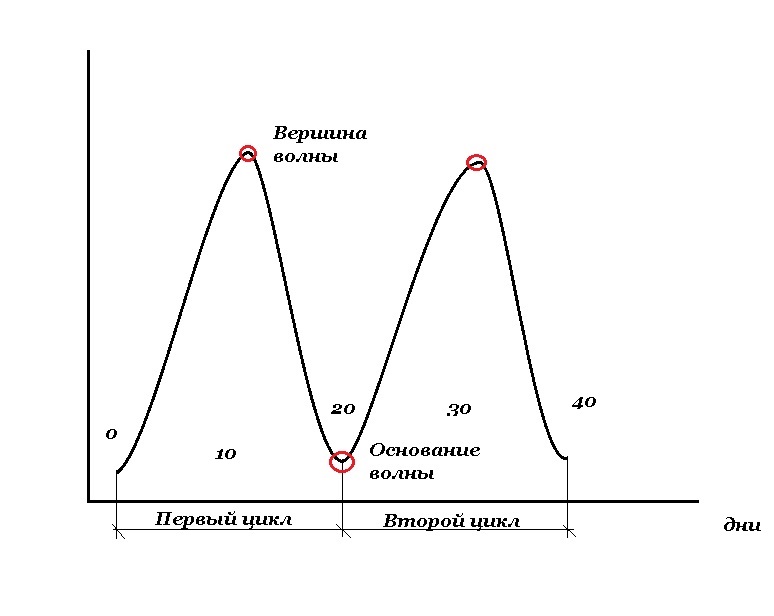
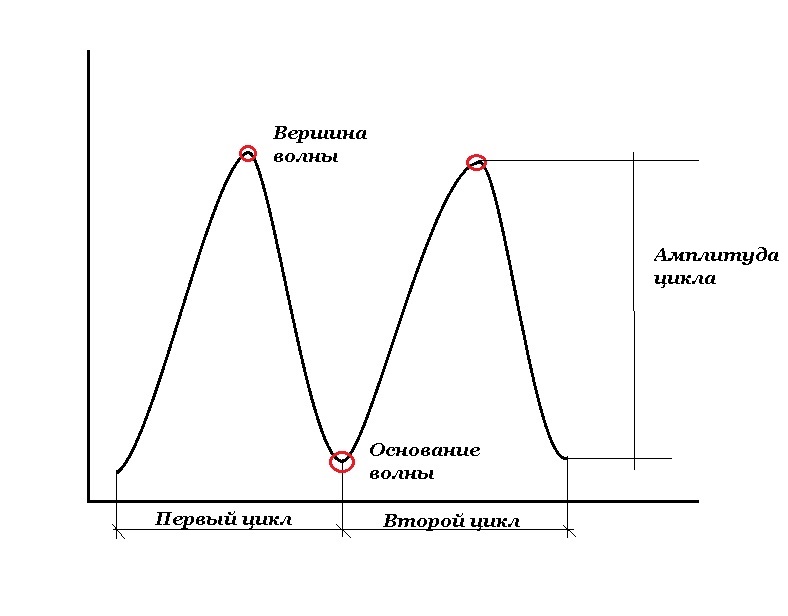 In the example below, the period is twenty days. The phase is usually called the temporary position of the base of the wave.
 The example below shows the phase difference between two waves:
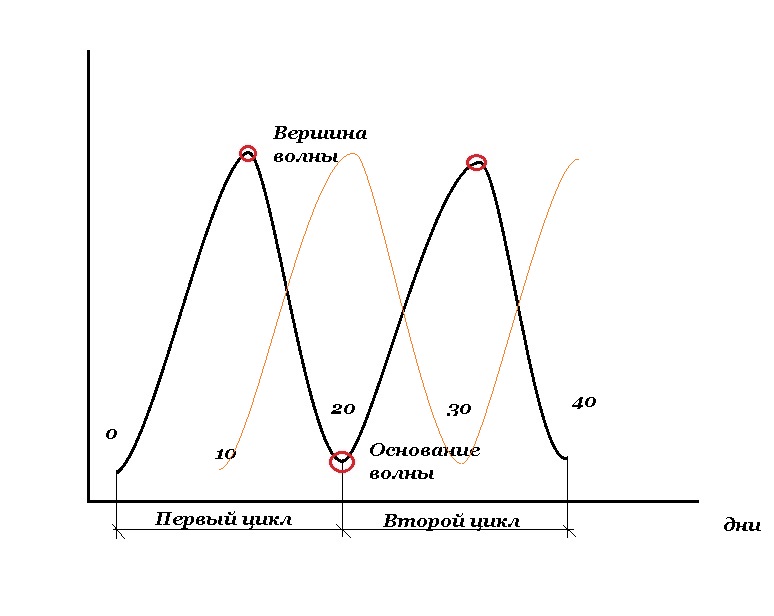 Since several cycles always develop simultaneously at the same time, phase analysis makes it possible to identify relationships between cycles of different lengths, as well as determine the time it takes for a cycle to pass through the lowest point. If, for example, we know when a twenty-day cycle passed its low point (say ten days ago), then we can easily determine when it will happen again. Once the amplitude, period and phase of the cycle are determined, it is theoretically possible to extrapolate the cycle into the future. If we can assume that the characteristics of the cycle will remain more or less unchanged, then the future low and high points of its development can be determined. This is the basis of cyclic analysis in its simplest form.
Principles of Cyclic Analysis
 Let us consider some principles that form the basis of cycle theory. The most significant among them are the principles of summation, harmonicity, synchronicity, and proportionality.
The principle of summation is that all price movements are a simple addition of all active cycles. The example in the figure below demonstrates that the price pattern at the top of the market is formed by simply adding two different cycles at the bottom of the chart:
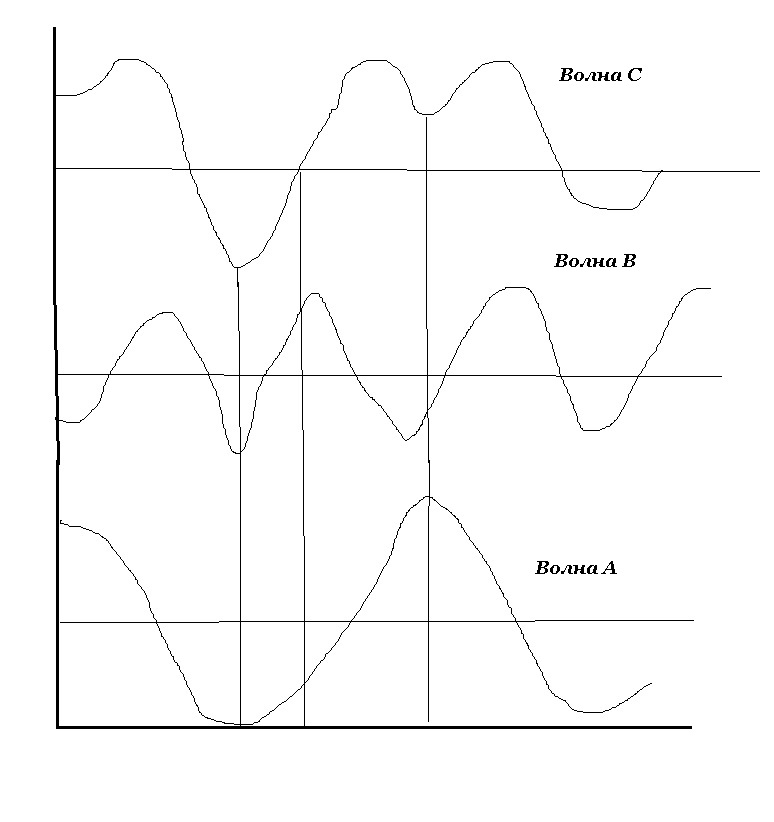 Pay special attention to the fact that in the composite wave C double top appears. According to cyclicality theory, all price patterns are formed as a result of the interaction of two or more different cycles. Thus, the principle of summation helps to understand the logic of forecasting market development using cyclical analysis. Let us assume that any price movement is the sum of cycles of varying lengths. Let us further assume that each of these cycles can be isolated and measured. Finally, let's assume that each of them continues into the future. Then you can simply continue all the cycles, projecting them into the future, and add them up again, thereby obtaining the future trend of the market. In any case, the theory of cyclicity speaks about this possibility.

The principle of harmonicity implies that the ratio of adjacent waves is determined by a small integer, usually "2". For example, the next smaller cycle, adjacent to the twenty-day one, will be ten-day - that is, half as long. The next in increasing order will be forty days, that is, twice as long.
The principle of synchronicity is intended to explain the strong tendency of waves of different lengths to reach the base almost simultaneously. The example demonstrates both principles - harmony and synchronicity:
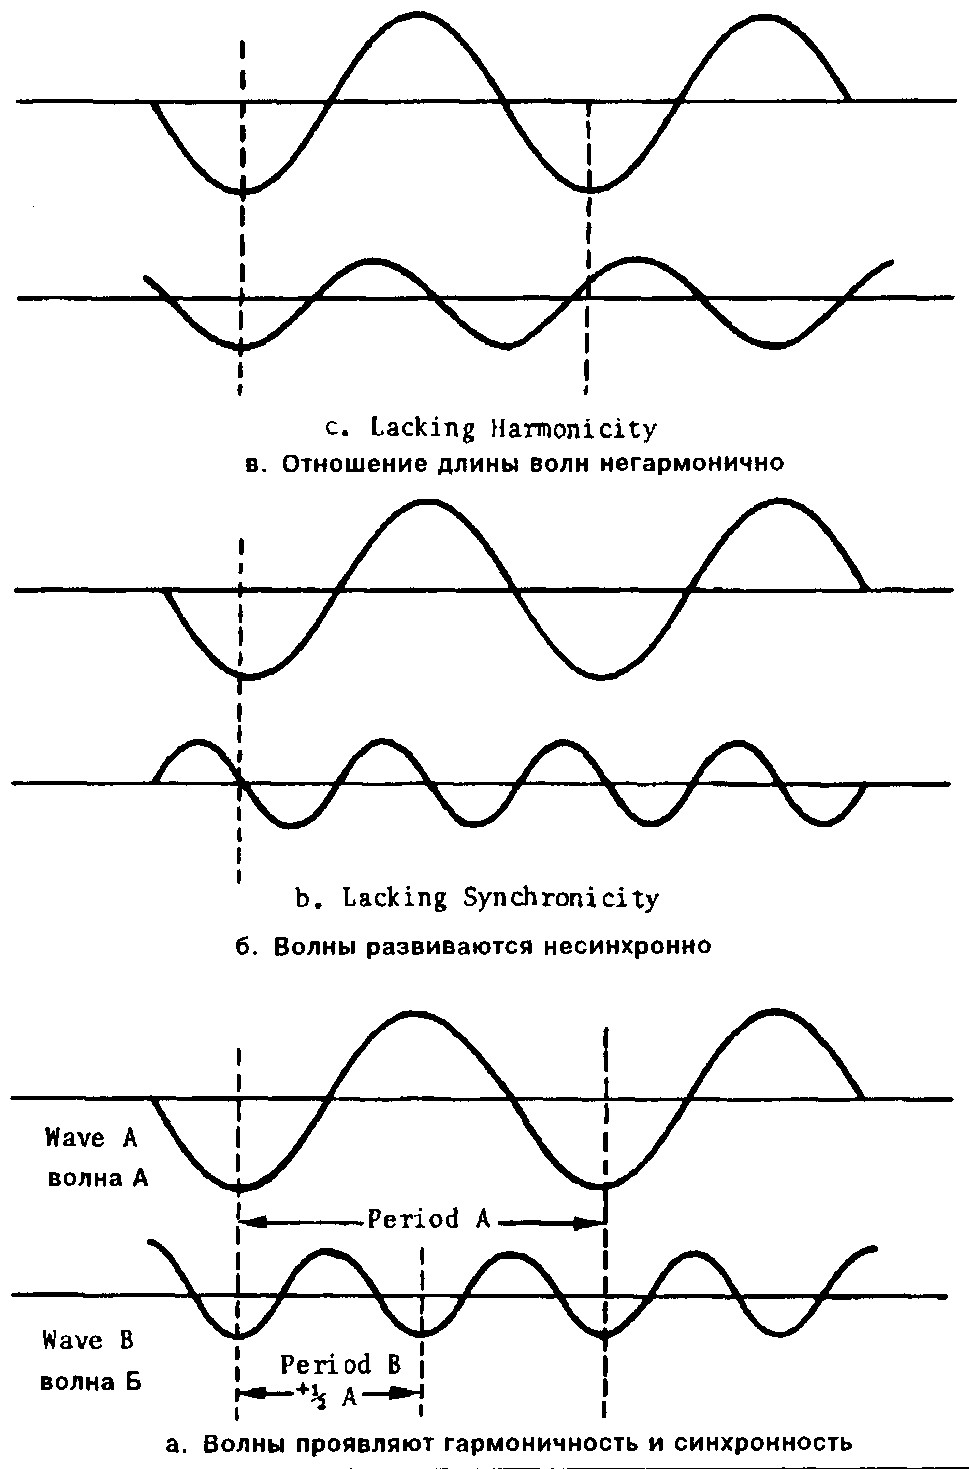 Wave B, which is located at the bottom of the chart, is half as long waves A. Wave A includes two repetitions of the smaller wave B, demonstrating a harmonious relationship between the two waves. Notice that when wave A bottoms out, wave B also bottoms out, demonstrating the synchronicity that exists between the two waves. The principle of synchronicity also means that cycles of the same length in different markets also tend to reach extremes at the same time.
The principle of proportionality is used to describe the relationship between the period and amplitude of a cycle. A cycle with a larger period should have a proportionally larger amplitude. The amplitude (or height) of a forty-day cycle, for example, should be approximately twice the amplitude of a twenty-day cycle.
Principles of Variation and Nominality

There are two more principles of cyclicity theory that describe the functioning of cycles in more general forms. These are the principles of variation and nominality.
The principle of variation is a recognition of the fact that all of the principles already mentioned (summation, harmony, synchronicity and proportionality) can be called stable trends rather than rules. In real life, some "variations" should and do occur.
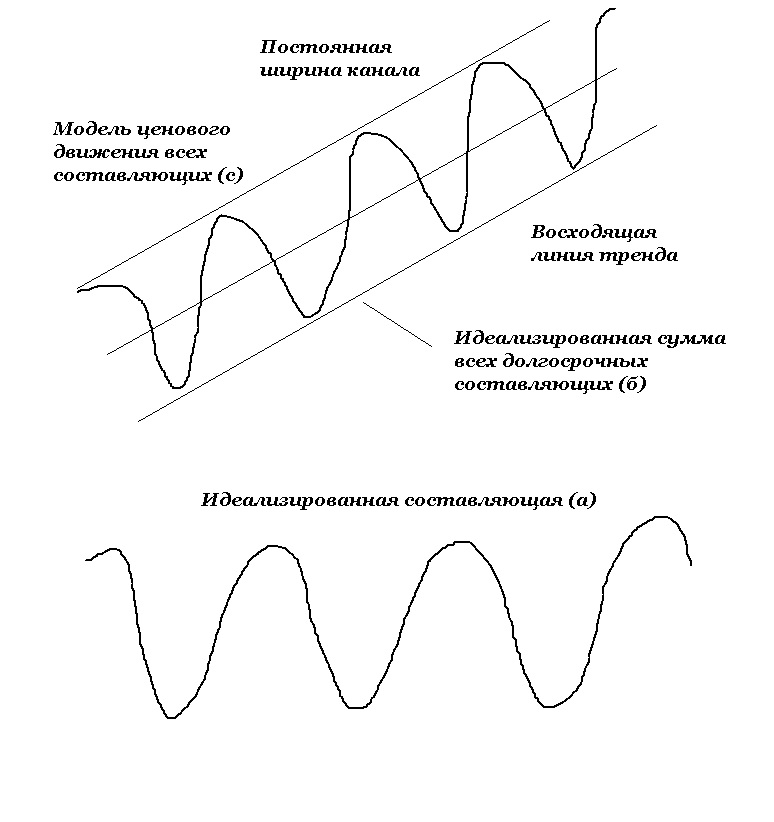 The principle of nominality is based on the assumption that, despite Based on the characteristics of different markets and some differences in the application of cyclical principles, there is a so-called nominal set of harmoniously correlated cycles that are characteristic of all markets without exception. It follows that the nominal cycle length model can be used as a starting point in the analysis of any market. The example above represents a simplified nominal model.
Dominant cycles

The dynamics of market prices are influenced by various cycles. However, for forecasting purposes, only the so-called dominant cycles, which have a permanent impact on prices and can be clearly identified, are of real value. Most markets have at least five dominant cycles.
The correct procedure would be the one in which the study begins with long-term dominant cycles whose duration reaches several years. Then one moves on to the analysis of medium cycles lasting several weeks or months. And finally, ultra-short cycles, whose duration is limited to several hours or days, are used to determine the most favorable moment for entering the market or exiting it, and also for confirming the turning points of long-term cycles.
Specialists in cyclic analysis do not have a consensus on the principles of classification of cycles, as well as their length, but we will still try to identify the main categories of cycles. They are:
- long-term cycles (long-term) (lasting two years or more);
- seasonal cycles (seasonal) (one year);
- primary cycles (primary);
- intermediate cycles (intermediate) (from nine to twenty-six weeks), and trading cycles (trading) (four weeks).
These are the main cycles, but there are others. In some markets, between the main and trading cycles there is a cycle that is half the primary cycle. The trading cycle can be divided into two shorter cycles - alpha and beta, each of which lasts on average for two weeks (the terms “main”, “trading”, “alpha” and “beta” were first introduced to describe cycles by W. Bresser).
Kondratieff Wave

However, market development is also determined by cycles of longer duration. Probably the most famous is the fifty-four-year Kondratieff cycle. The cycle, which determines economic development over a long period and is named after the Russian economist Nikolai Kondratiev who discovered it in the twenties of the last century, has caused and continues to cause a lot of controversy.
Nevertheless, the cycle really does exert a strong influence on the development of literally all securities markets and commodity futures markets. In particular, the fifty-four-year cycle was identified in fluctuations in interest rates, in the prices of copper, cotton, wheat, and stocks, and in wholesale prices on commodity markets. Kondratieff traced the development of his cycle beginning in 1789 on such indicators as commodity prices, the level of pig iron production, the wages of agricultural workers in England, and so on.
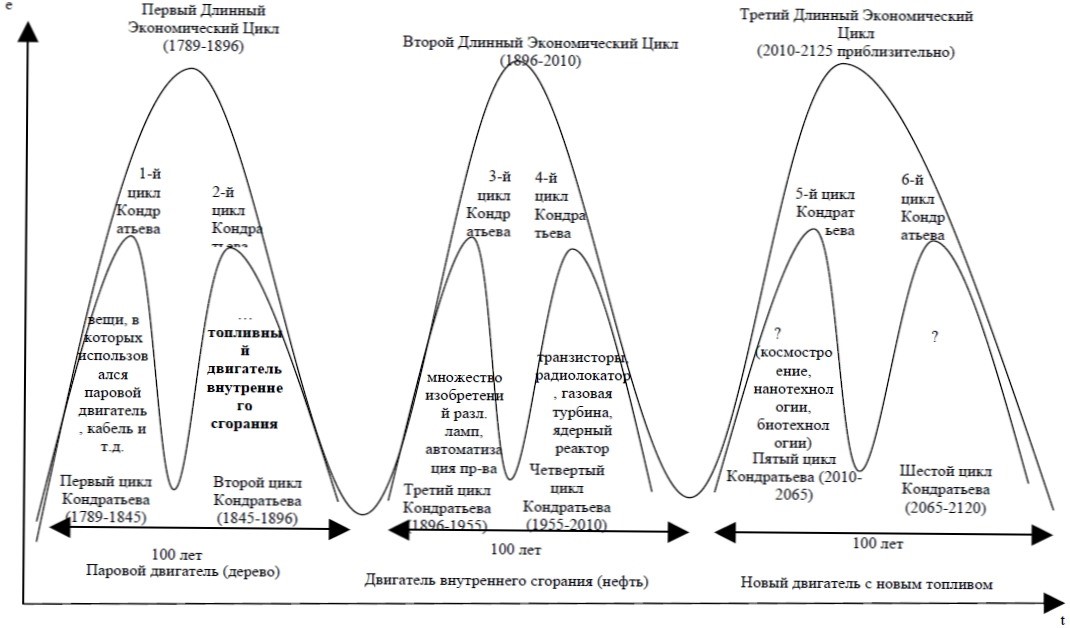 In recent years, interest in the Kondratieff cycle has increased sharply again. This is explained by the fact that, according to the theory of the Russian scientist, the next low point in economic activity occurs in 2010.
Combination of cycles of different lengths

According to the general rule, the main trend of market development is determined by long-term and seasonal cycles. When a two-year market cycle reaches its bottom, prices will rise for at least one year (measuring the cycle from bottom to top). Thus, long-term cycles influence the main direction of market movement. Market development also follows annual seasonal cycles, in other words, the market reaches a top or bottom at a certain time of the year. For example, in grain markets, prices fall to minimum values during the harvest period, after which they begin to rise. Seasonal movements usually last for several months.
The main weekly cycle is of greatest interest. The three to six month major cycle is the equivalent of an intermediate trend and allows you to determine which side of the market to take positions on. Then, in decreasing order, there follows a four-week trading cycle, with the help of which entry and exit points from the market are established - in accordance with the prevailing trend in the market. If the main trend is upward, then long positions should be opened at the bottom of the trading cycle. In a downward trend, when the cycle reaches the top, a sale should be made. To determine the timing of transactions even more accurately, you can use ten-day alpha and beta cycles.
Trend

According to one of the basic rules of technical analysis, all operations should be carried out exclusively in the direction of the existing trend. Short-term price declines should be used to open long positions if the market as a whole is determined by an intermediate upward trend, and conversely, short positions should be taken when prices surge against the background of a general decline.
Thus, when analyzing a short-term trend in order to determine the best moment to enter (or exit) the market, it is first necessary to establish the direction of a longer trend at the next level and open positions in accordance with it. The direction of development of the cycle is determined by the direction of the next ascending cycle. In other words, the direction of the short cycle cannot be established until the direction of the longer one becomes clear.
Twenty-eight day trading cycle

There is another important short-term cycle that determines the development of most commodity markets - the twenty-eight-day trading cycle. Many markets do tend to follow a trading cycle that bottoms out every four weeks. One possible explanation for this persistent cyclicality observed in almost all markets may be the lunar cycle. In the thirties of the last century, the twenty-eight-day cycle of development of the wheat market was studied by B. Pew.
The researcher came to the conclusion that the development of lunar phases has some influence on the turns of these markets, and even made the following conclusion: wheat should be bought during the full moon, and sold at the birth of a new moon. At the same time, B. Pugh recognized that the effect of lunar phases is relatively weak and is often overlapped by the influence of longer cycles or major events of an economic or other nature.
Whether the moon has anything to do with it or not, the average twenty-eight day cycle does exist and explains the prevalence of many numbers used in the creation of short-term indicators and trading systems. Firstly, the twenty-eight day cycle is based on the calendar structure of the month - it corresponds to four weeks. If we take into account only working or trading days, then it becomes already twenty days. Five-, ten- and twenty-day moving averages, as well as their derivatives - four-, nine- and eighteen-day ones, are very popular.
The existence of a four-week trading cycle explains the popularity of this number and helps us understand why the “four-week rule” has worked so successfully for many years. When the market exceeds the previous maximum price set within four weeks, the principle of cyclicality tells us that the next, ascending eight-week cycle has at least reached its lower point and turned upward.
Left and Right Shift

Left (or right) shift refers to the shift of cycle peaks to the left (or right) from the ideal center. For example, a twenty-day trading cycle is measured from low to low. The ideal peak of a given cycle is thus located ten days from its beginning, or strictly in the middle. With this construction, the cycle consists of a ten-day rise in prices, followed by a ten-day fall. However, ideal cycle development is extremely rare. It should be remembered that any deviation in cyclic development from the ideal occurs at the top of the cycle, and not at the bottom. Therefore, the lower points of the cycles are considered more reliable parameters and are used to measure the length of the cycle.
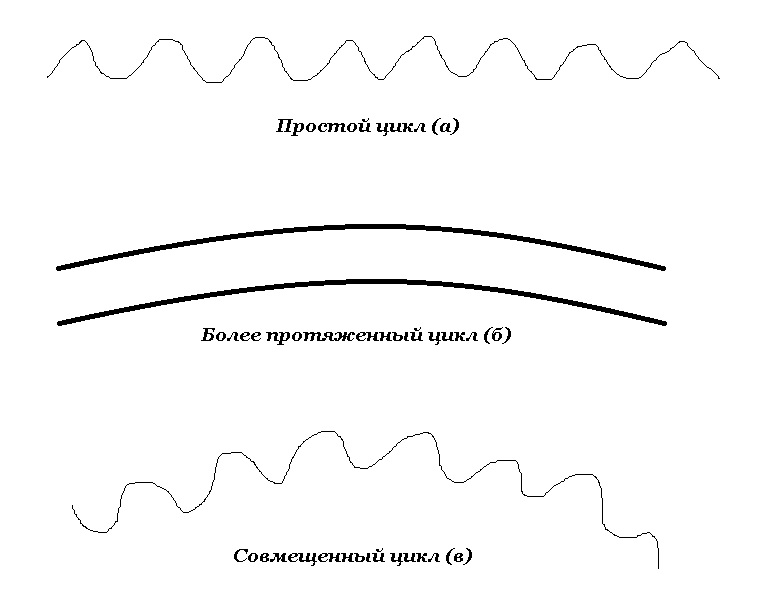 The location of the upper points of the cycle can be different and depends on the direction of development of the next ascending cycle. If the longer trend is defined as upward, then the top of the cycle moves to the right of the ideal center, that is, a rightward shift occurs. In a downtrend, the top moves to the left of center, causing a leftward shift. Thus, a right bias is a manifestation of a bull market, and a left bias is a bearish market. In a bullish market, price increases last longer than prices fall. With bearish development, the opposite happens. Doesn't that remind you of the basic definition of a trend - with one exception: we're talking about time here, not price.
You will, of course, remember that an uptrend is defined as a series of successively increasing peaks and troughs. A downward trend is a series of successively decreasing peaks and troughs. In the peaks and troughs of a trend, the upper and lower points of the cycle’s development are easily recognized. Now we can try to combine the concepts of trend and bias, as in the figure above. As peak and trough levels increase (that is, prices rise steadily), cycle peaks move to the right of the ideal center.
As peaks and troughs decrease (that is, prices fall steadily), the cycle passes the peaks earlier, that is, to the left of the ideal center. Only in one case does the top of the cycle coincide with the ideal center - when there is no clearly defined trend in the market and prices move within a horizontal “trading” corridor, indicating that the forces of bulls and bears are in balance.
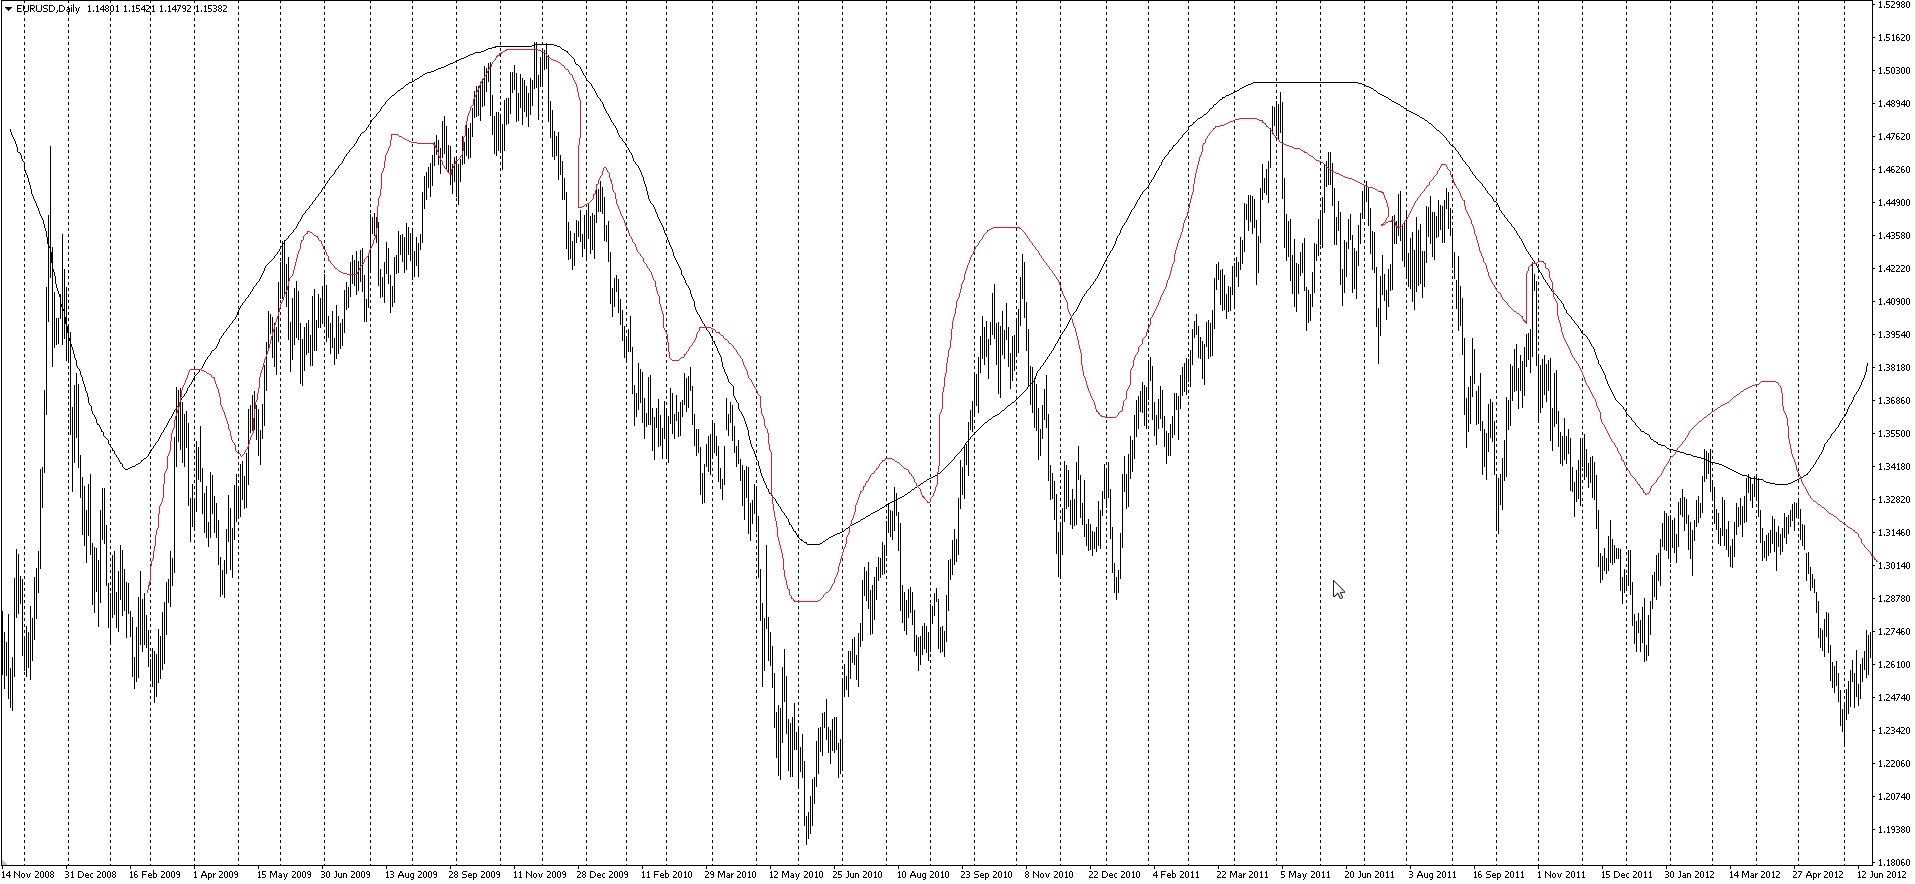 Now let's look at the predictive capabilities that the right and left offset. Let's start with the fact that based on the location of the cycle peak relative to the ideal center, one can fairly accurately judge the direction of market development. So, if the peak shifts to the right, that is, if the last period of rising prices is longer than the last segment of falling prices, then we can expect that the upward trend will continue.
When the top moves to the left, this can be regarded as an early signal of a trend change. In relation to daily charts it is very simple to analyze the displacement of the top of the cycle - just compare the number of days during which the market went up and down, respectively. Using the same principle, you can analyze weekly and monthly charts.
For example, if the market is in a downward trend and the last period of price decline was twelve days, then the subsequent market recovery is unlikely to last more than twelve days. From this we can draw two important conclusions. First, if the market rally continues as the twelve-day period draws to a close, we can predict with a high degree of probability the exact day on which the market will turn if the downtrend is to resume. If the recovery extends beyond the twelve-day period, this indicates a reversal of the trend.
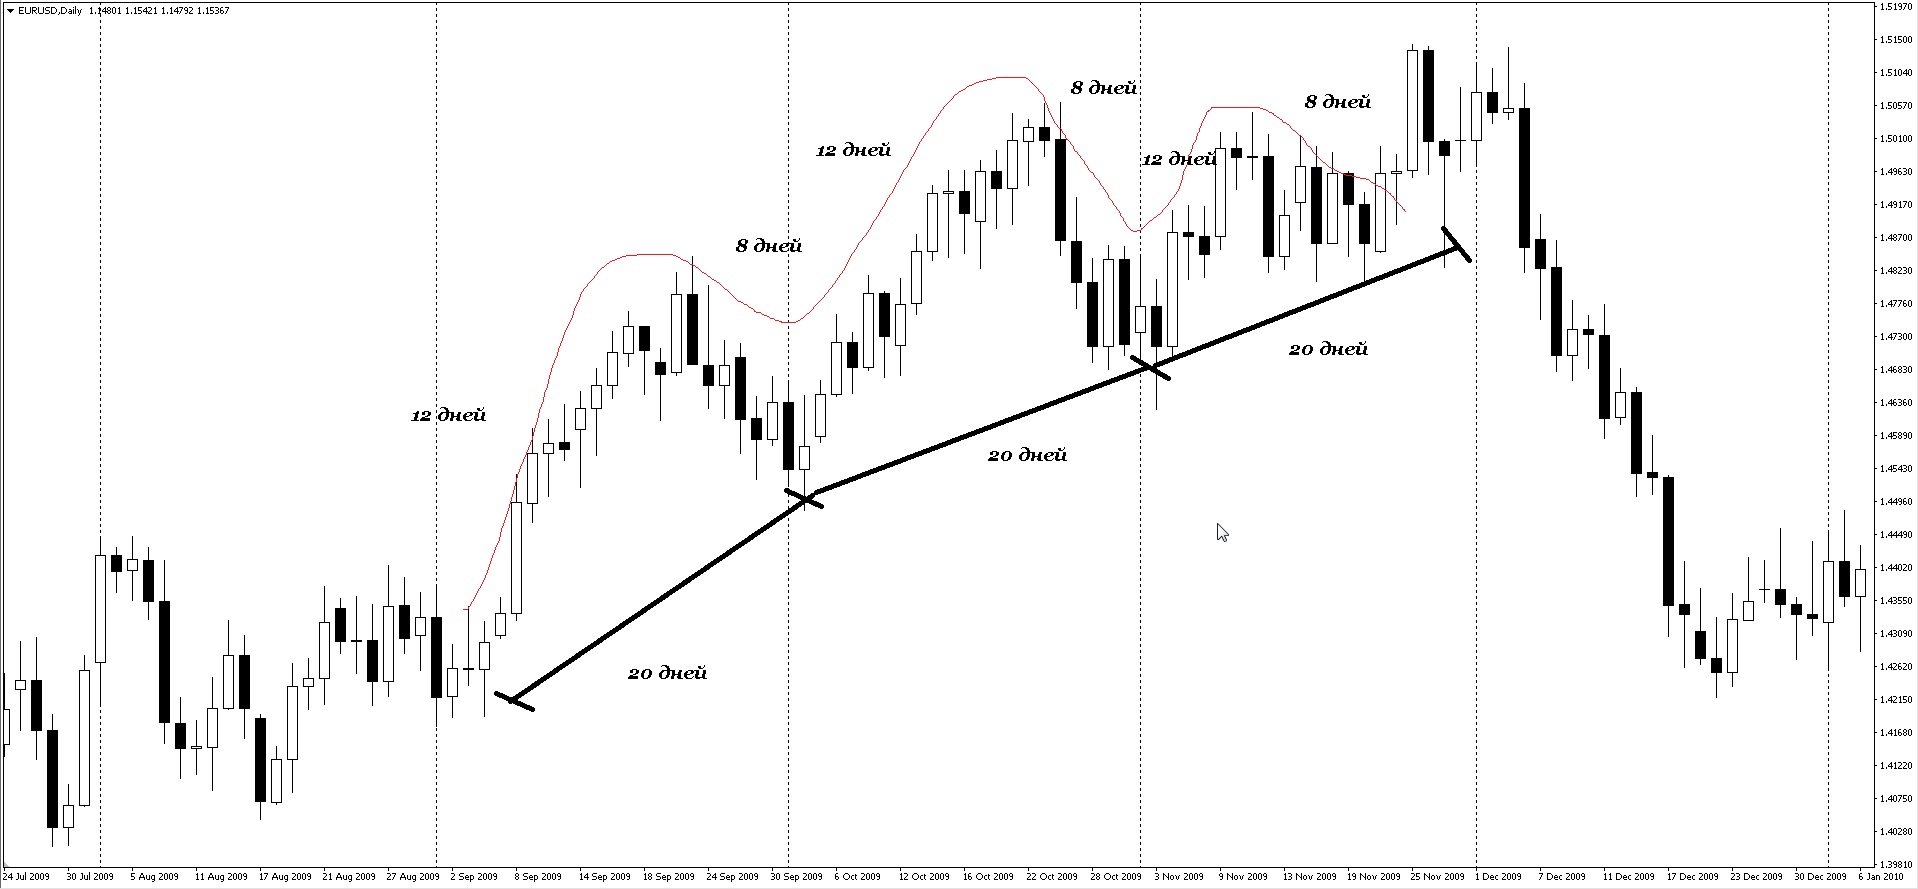 Exactly the same technique is used in the analysis of weekly charts. Let's assume that prices rise steadily. The market covered the distance from the bottom to the top point of the last upward price movement in seven weeks. This means that any downward price correction or horizontal consolidation should not last more than seven weeks. This time limit can be combined with certain price parameters. The maximum price correction downwards is usually from 50% to 66% of the previous increase.
Seasonal cycles

Almost all commodity futures markets are subject to varying degrees of annual seasonal cycles. When we talk about a seasonal cycle or seasonal pattern, we are talking about the tendency of markets to move in a particular direction at certain times of the year.
The most striking example of such an impact is the dynamics of prices in grain markets. Prices invariably fall during the harvest period, when the maximum amount of grain appears on the market. For example, in soybean markets, 70% of all seasonal price highs occur between April and July, and 75% of all seasonal price lows occur between August and November. Once the maximum or minimum seasonal price has been reached, prices begin to fall (or rise accordingly). The seasonal decline (or rise) usually lasts for several months. Thus, knowledge of the features of seasonal price dynamics is a good help in developing a trading strategy.
The reasons for seasonal influences on price dynamics, leading to tops and bottoms at certain times of the year, are especially evident in agricultural markets. However, almost all markets are influenced by seasonal factors. One of the most common patterns that applies to all markets is that a breakout of the January high is a bullish signal.
Metal markets can also serve as examples of the effect of seasonal factors on price dynamics. For example, in the copper market, a strong and steady seasonal rise in prices begins in January-February and tends to reach its peak in March or April. In the gold market, seasonal growth also begins in January, while prices reach another bottom in August. Silver prices usually fall to their minimum in January, after which they rise steadily until March.
Analysis of the frequency of seasonal market movements over previous years allows one to draw up graphs of seasonal trends. With their help, you can determine the probability of occurrence of certain seasonal patterns for each month and each week of the year. By the way, the site has an excellent tool for identifying seasonal trends.
In some years, prices refuse to follow the expected seasonal trend, and trader should closely monitor the appearance of signals of this kind. The ability to notice violations of seasonal patterns in price movements as early as possible is of great importance, allowing the trader to reconsider the trading strategy in time. Failure of the market to follow a seasonal trend usually means that significant price movements in the opposite direction should be expected. The ability to find out as early as possible that you have made a wrong move is one of the main advantages of technical analysis in general and seasonal cycle analysis in particular.
Using cycles and technical analysis

Analysts who study market cycles emphasize that in order to confirm the advisability of opening a particular position, the results of cyclical analysis must be combined with signals from other technical instruments. For example, an analyst can get an idea of when a cycle turn should occur using time windows or timing bands, which are types of time filters that can “screen out” insignificant price movements.
However, once prices enter the time window, the trader must resort to more traditional technical tools that can confirm that the cycle has turned, thereby providing a signal for action. The choice of specific techniques that allow determining the most favorable moments for entering and exiting the market remains up to the trader, who prefers to rely on his favorite, most familiar tools.
Time windows have no meaning unless used in conjunction with specific technical signals. Among the signals considered most important are breakouts of trend lines plotted through closing prices, key break days, and close breakouts of the highest or lowest closing price recorded within the last three days (or other units of time). For example, a buy signal at the bottom of a cycle will occur when the closing price reaches a value greater than the highest closing price in the last three days (or three weeks for a weekly chart).
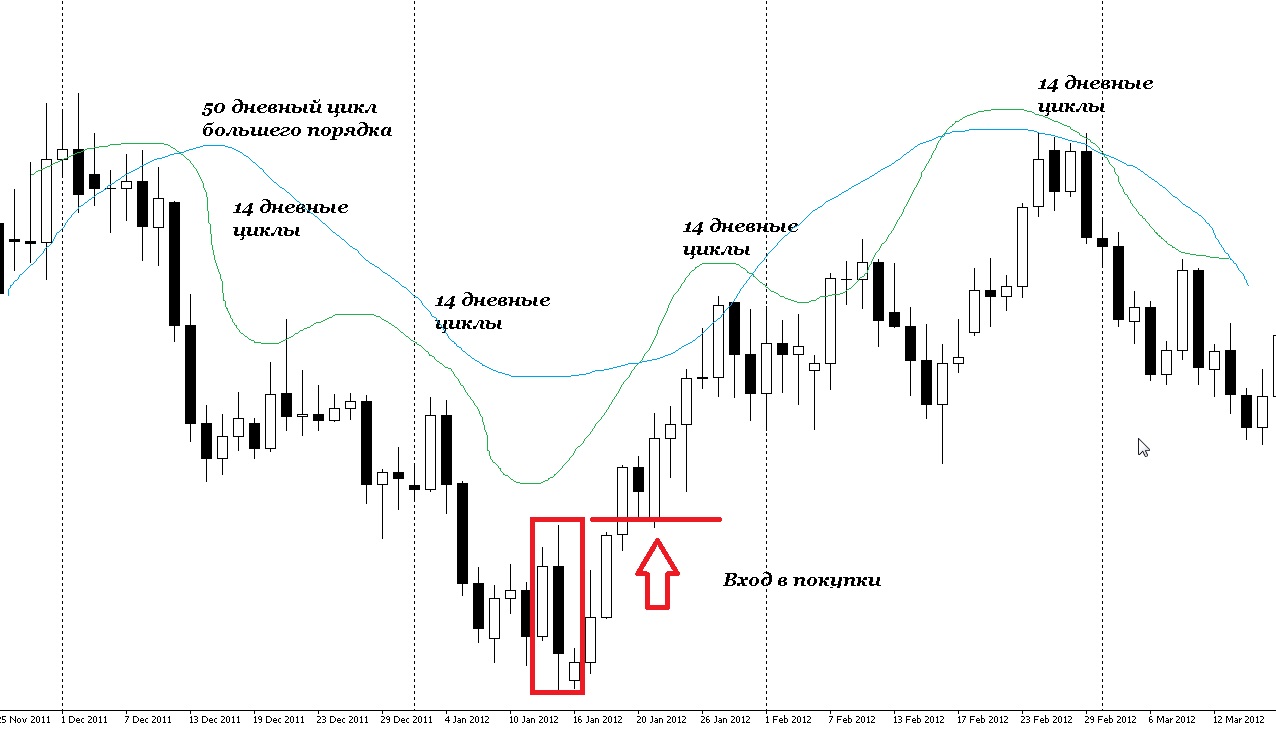 Bresser's HAL Market Cycles company uses the concept of time and price windows, which are marked on charts by small rectangles. The time guidelines are based on seventy-percent time bands that are determined separately for cycles of each length. The idea is that in 70% of cases a cycle turn will occur within such a band.
Combined analysis of price and time targets according to Bresser involves the use of various technical methods, including determining the price target by a pause at the central point of the cycle (midcycle pause price objective) (a technique similar to determining price targets using the “measured move” method, which we already talked about earlier), sixty to forty percent ratios of the correction length, analysis of support and resistance levels, trend lines. Bresser emphasizes the need to harmonize these techniques with the basic principles of the theory of cyclicity.
For example, the methods of pausing at the central point of the cycle and percentage ratios of the correction length are reliable only if, firstly, the length of the analyzed cycle coincides with the prescribed one, and secondly, if the trend expressed by the next ascending cycle continues.
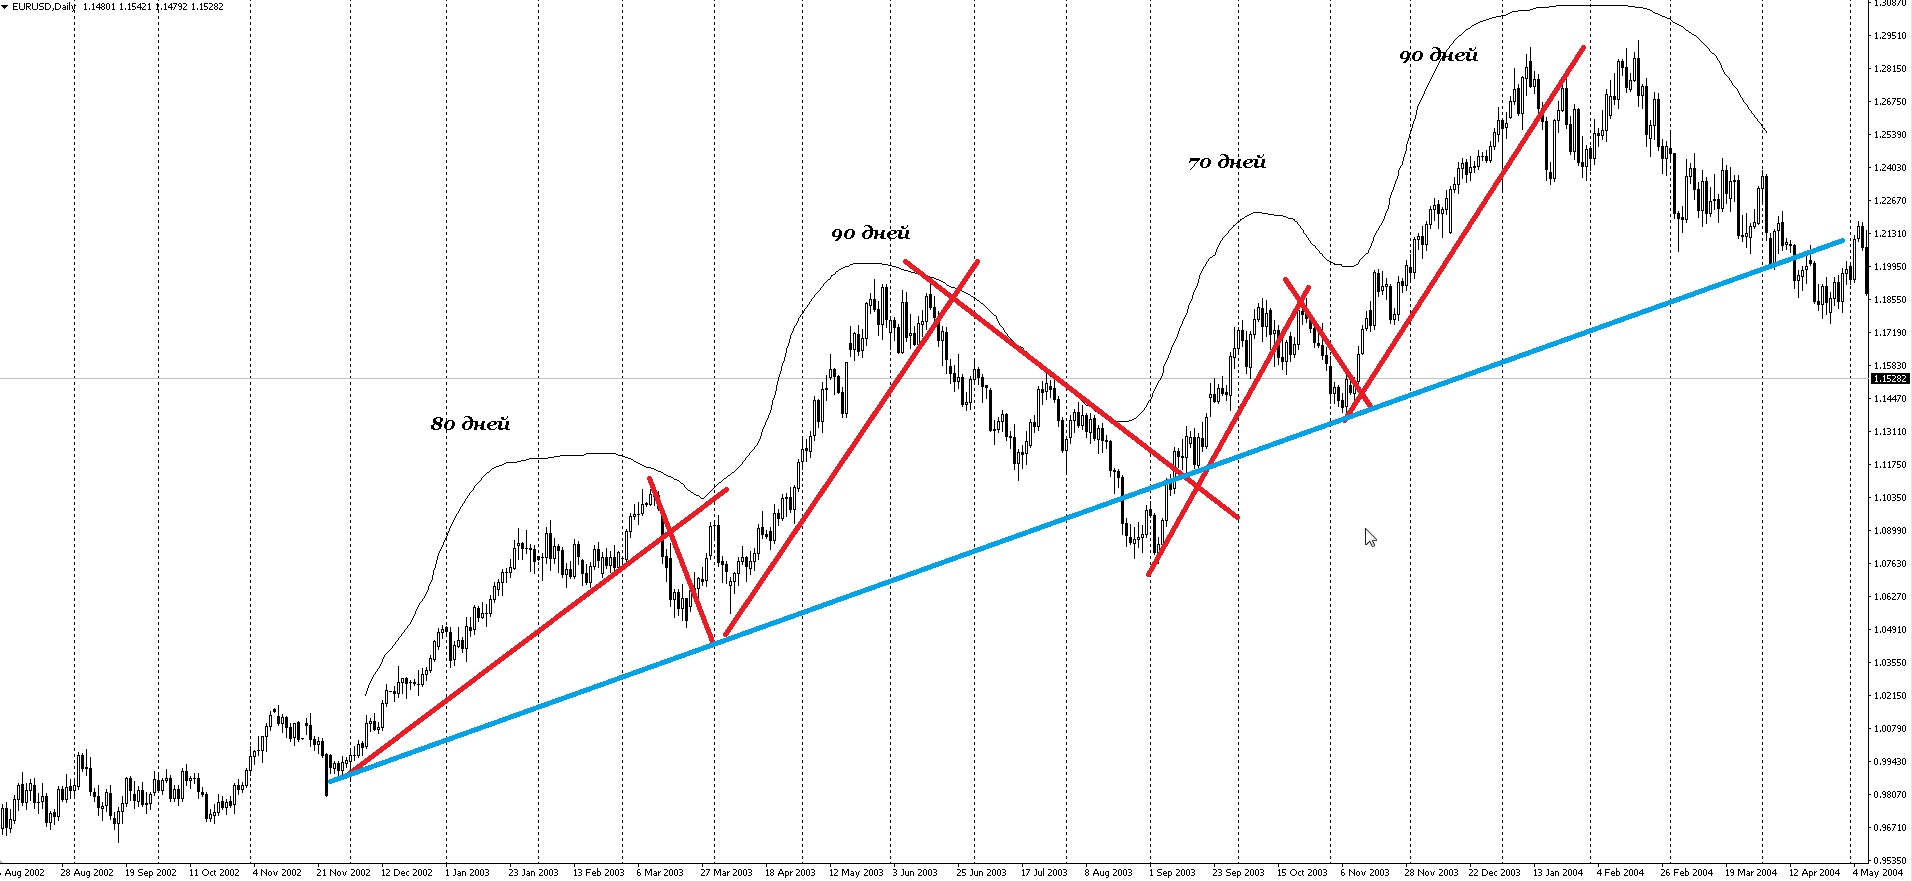 Trend lines are most reliable when they connect tops or bases of cycles of the same length. For example, trend lines need to be constructed to connect the highs or lows of two trading cycles or adjacent alpha or beta cycles, which are typically the same length. A break through a trend line connecting cycles of equal length is a signal that a turn in the next ascending cycle has occurred.
So, if the market crosses the downward trend line drawn through the tops of the alpha and beta cycles, this means that the longer trading cycle has reached its bottom.
Using cycles and oscillators

One of the most interesting areas where cycles can be used in conjunction with other more traditional methods of technical analysis is the linking of oscillators to current cycles. Experts believe that the efficiency of oscillators can be significantly improved if the time periods used for their calculation are determined taking into account the length of the current market cycles.
The Hal Blue Book, W.J. Bressert and J.H. Jones, describes in detail how market cycles combine with the overbought-oversold index and the momentum index (momentum). Both oscillators are taken from Larry Williams' book, How I Made a Million Dollars Last Year in the Commodity Futures Market, published in 1973. The overbought-oversold index is a modification of the %R Williams oscillator, and the second oscillator is a simple momentum index that can be constructed by measuring the price difference between two time periods.
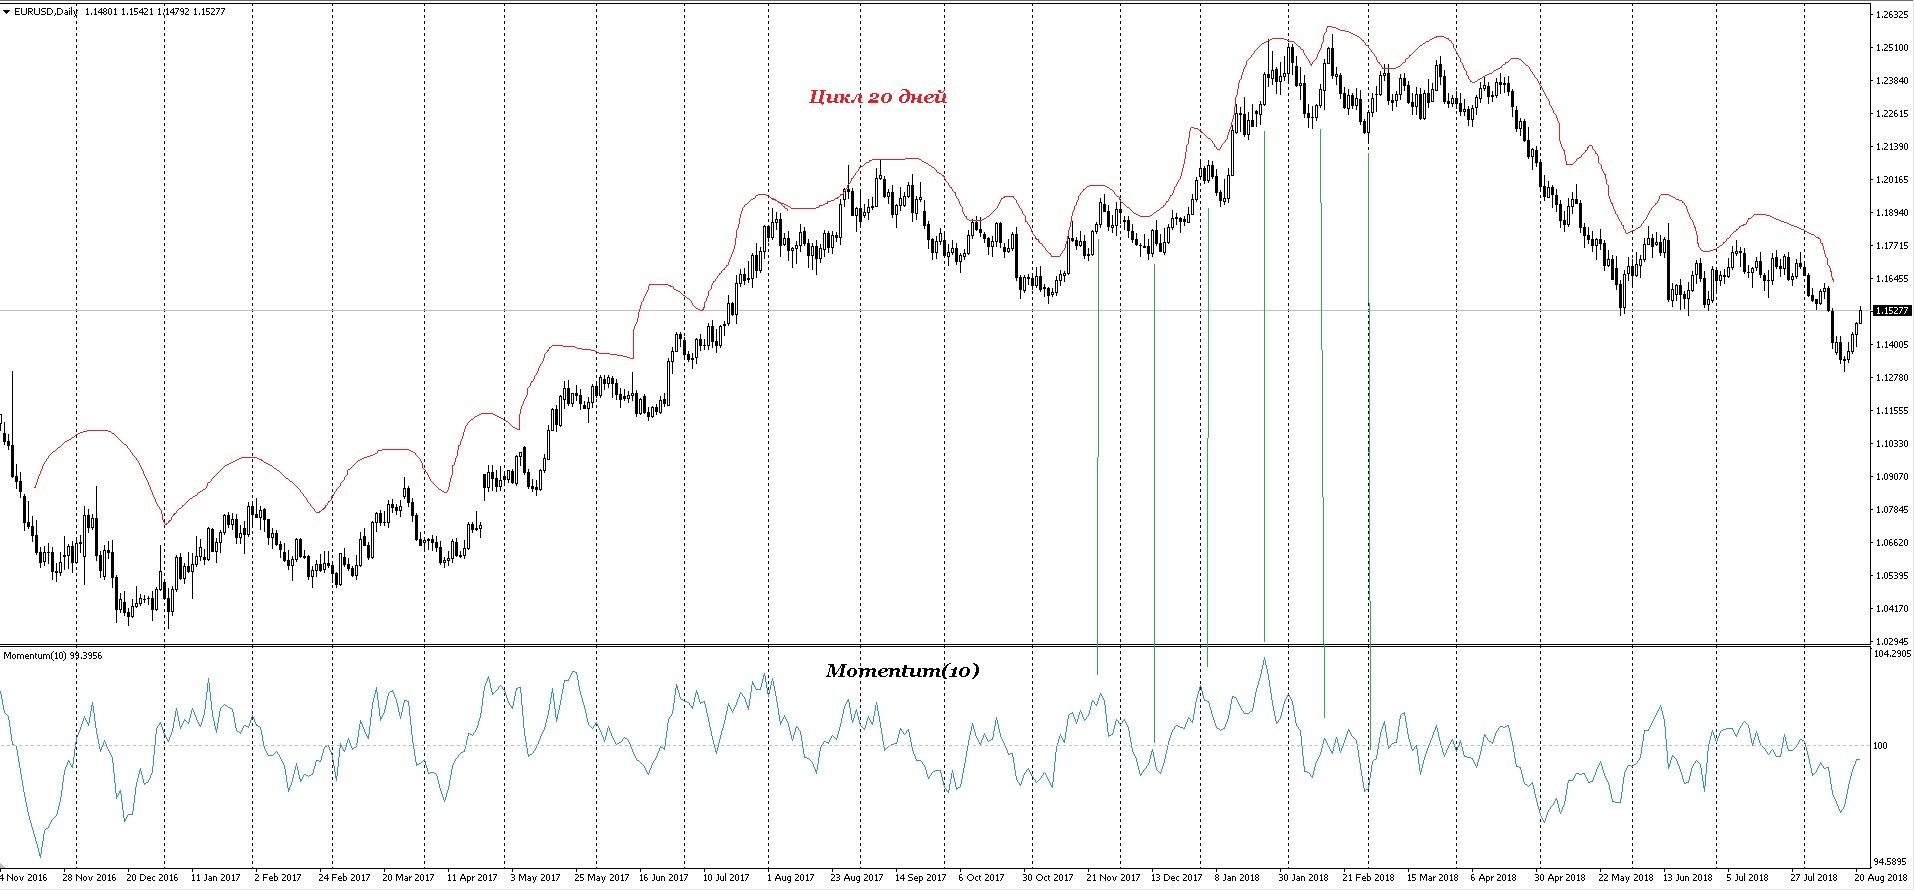
The main thing is to tie the calculation period of the oscillator to the length of the cycles. Let's start by determining the number of working days that make up the trading cycle. Let's assume that the average trading cycle is 28 calendar days. However, of these, there are only twenty working days. When we use an oscillator to try to identify turns of a cycle, it is necessary to calculate it by taking a period equal to half the length of this cycle. In the example below, we used a period of ten days:
 The Hal method involves constructing three oscillators based on three cycles of varying lengths: trading (twenty days), alpha-beta (ten days) and long (usually twice as long as the trading one, that is, forty days). Of course, we are talking about cycles of average length, and it is always necessary to take into account the actual length of the cycle in each individual market. When constructing oscillators, in each of the three cases, a period is taken that corresponds to half a cycle of each type. In our example, these will be the following values: 20, 10 and 5:
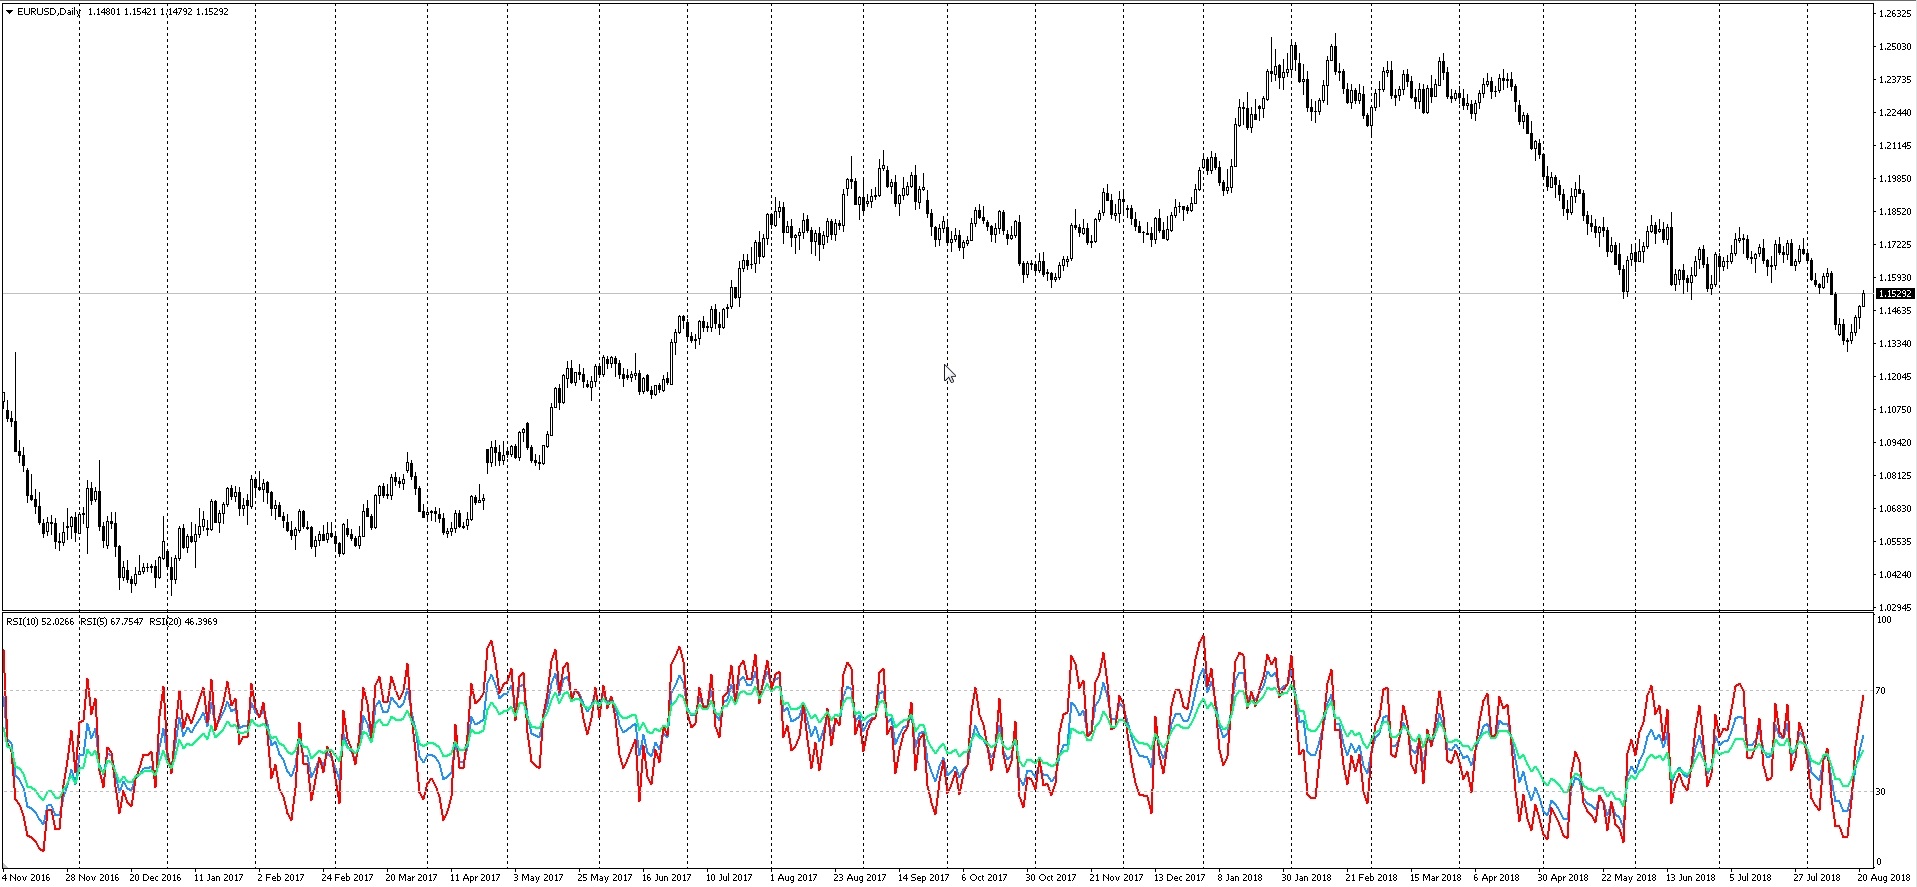 Oscillators built on the basis of these three values can be plotted on one chart or on different charts. The interaction of oscillators of different lengths can provide the trader with very valuable information.
Another way of combining oscillators with cycles is to use time bands as a filter. In this case, it is especially important to watch the oscillator carefully for signs of a top or a bottom at those moments when prices enter the limits of the time band, thereby indicating that the cycle is approaching its upper or lower point.
The principle of “tying” oscillators to the length of cycles can be used in the construction of almost any type of oscillators by inserting the corresponding value into their formulas.
Conclusion

Today we took a detailed look at the opportunities that time cycle analysis provides a trader. It doesn't take an expert in cycle analysis to see the benefits we get from incorporating the time dimension into our forecasts. To do this, as we found out, is quite simple. In combination with cycle analysis, for example, you can use those technical analysis methods that you regularly use. Cyclical analysis specialists believe that only with the help of cycles can one see in advance in which direction the market will go. Whether this is true or not, one thing is certain: cycle analysis can indeed improve the effectiveness of market forecasting.
The bottom of a cycle is considered more reliable in analysis than the top, and therefore cyclical changes are measured from bottom to bottom. That is why the analyst pays attention primarily to the bottoms of cycles. Unfortunately, this leads to the analyst becoming obsessed with “catching the bottom” of the cycle and playing for a rise instead of calmly following the downward trend.
Knowing this feature of cyclical analysis, it is probably best to pay less attention to cycles during bearish phases of markets and return to them when prices begin to follow a confirmed bullish trend.
Sincerely, Dmitry aka Silentspec TradeLikeaPro.ru
