
How Not to Use the ADX Indicator
 Any beginner trader knows that trading in the direction of a strong trend reduces risks and increases profit potential. However, the main difficulty lies precisely in correctly determining the trend, its beginning and end. It is for this purpose that the Average Directional Index (ADX) indicator can be applied. In many cases it can serve as the ultimate tool in the work. In this article we will explore the value of ADX, look at the calculation formula, examine statistics for various strategies of its use in trading, and see the strengths and weaknesses of the indicator.
Directional movement, or the ADX system, is a concept that J. Welles Wilder Jr. first described in his book "New Concepts in Technical Trading System" in 1978 and which was later improved by analysts. The system consists of the Average Directional Index (ADX, average directional movement index) and the Directional Movement Indicator (DMI, directional movement index). The directional movement indicator itself is already a useful and versatile technical indicator; it is an excellent indicator of market direction. And ADX, one of the derivatives of DMI, not only makes it possible to identify markets that are in a trending state, but also provides a way to assess the strength of trends.
Indicator Characteristics
Platform: any
Currency pairs: any
Timeframe: preferably from H1 and higher (best of all D1)
Trading time: around the clock
Indicator type: classic trend-following
Recommended brokers: Alpari, Exness, Instaforex
The Meaning of the ADX Indicator

The ADX indicator is present in all trading terminals and market technical analysis programs. The indicator looks like three lines fluctuating in the range from 0 to 100 in a separate window, typical of all oscillators.
First, two lines are generated that measure buying and selling pressure. They are called +DI (positive directional indicator) and -DI (negative directional indicator). A bullish environment exists when the +DI line is greater than the -DI line. From these two lines a third is created, called the "average directional movement line" (ADX). A rising ADX line tells us that the market is in a trending mode. A falling or flat horizontal ADX line reflects a trading range environment.
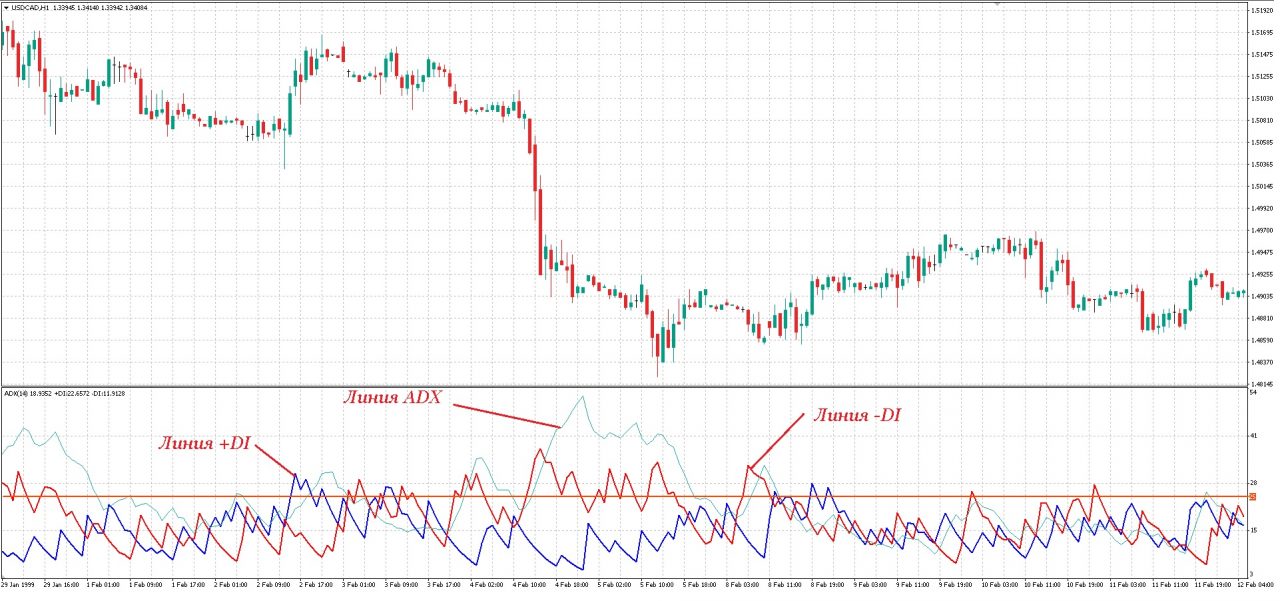 Despite the fact that ADX indicator readings are located in the range from 0 to 100, they very rarely climb above the 60 mark. An ADX value below 20 signals a weak trend, and above 40 a strong one. Readings above the 40 mark indicate the presence of a strong trend, both downward and upward. When the indicator is below 20, this indicates the absence of a pronounced trend.
If there is any tendency in the market, bullish or bearish, the distance between the DI signal lines begins to increase and ADX itself starts to rise; and vice versa, when activity in the market decreases, the distance between the DI signal lines begins to shrink, and ADX falls.
ADX works best after a period of consolidation and shows unreliable results after V-shaped market reversals and sharp moves against the main trend.
ADX Indicator Settings

The ADX indicator is used to quantify trend strength. Its calculation is based on the Moving Average of the expansion of the price range over a specified period of time.
By default, a period of 14 bars is used, although, naturally, other time periods can also be used. The use of 12-, 18-, and 21-period ADX is also encountered. As a guideline, when setting parameters traders usually use values in the range from 7 to 30. As a result of increasing the period, you get more reliable information about trends, but finding them will take more time; you may miss a substantial part of the trend by the time the indicator reports it. Using lower calculation periods will allow you to receive information about many trends more quickly, but some of these "trends" may turn out to be false.
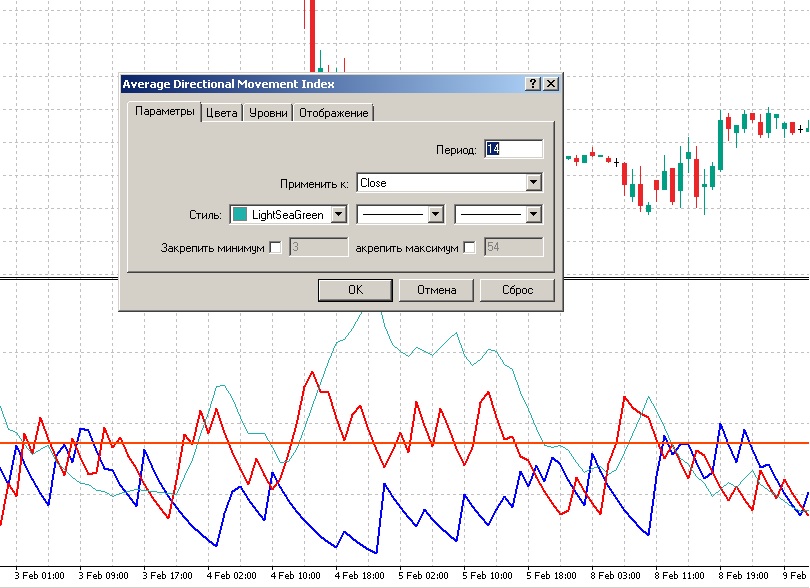 You can use any prices to calculate ADX values, but I recommend choosing closing prices; this is the classical approach to calculating indicator readings proposed by the author.
Also, as usual, you can customize the colors and display styles of the indicator lines (in the parameters window, styles for the ADX line; in the colors tab, for the DMI lines), and also set reference lines.
The ADX indicator can be successfully applied in various markets, including stocks, futures, currencies, mutual funds, and others.
Construction of the ADX Indicator

The Average Directional Index is derived from two other indicators also developed by Welles Wilder: the Positive Directional Indicator (sometimes denoted as +DI or +DMI) and the Negative Directional Indicator (denoted as -DI or -DMI).
The algorithm for calculating ADX indicator readings can be broken down into four stages.
- A parameter called Delta or DM (directional movement) is calculated. The parameter has two values: +DM and -DM.
+DM=High-High, where
High is the high of the current candle
High is the high of the previous candle
At the same time, if High<High, then the parameter is not calculated.
-DM=Low- Low , where
Low - the low of the current candle
Low - the low of the previous candle
At the same time, if Low > Low , then the parameter is not calculated.
Thus, the +DM and -DM parameters are always either positive or equal to zero. One value shows how much the current bar high is above the previous high, and the other how much the current low is below the previous one.
Then the absolute values of +DM and -DM are compared and the smaller of them is set equal to zero. That is, for any candle one of the values will be equal to zero. The only exception is the Inside Bar pattern (Internal Day) - on the inside candle the High is below the previous one, and the Low is above the previous one, and both values (+DM and -DM) are equal to zero.
- A parameter called the true range (True Range, TR) is calculated. In this case, the maximum value of the following three quantities is taken:
High - Low - the size of the current bar
High - Close, where Close is the closing price of the previous bar
Low
The last two quantities are rather necessary for the stock market, where gaps occur very often.
- The DM/TR value is calculated, after which an exponential moving average is taken from this value. The resulting parameter is called the Directional Movement Index (DMI). This value is shown on the chart as two lines: +DMI and -DMI.
+DMI = EMA(+DM/TR, Period)
-DMI=EMA(-DM/TR, Period).
Also, in the literature, another calculation variant is sometimes found, when +DM or -DM are smoothed separately, and only then divided by the likewise separately smoothed true range. That is, the formula takes the following form:
+DMI = EMA(+DM, Period)/ EMA(TR, Period)
-DMI=EMA(-DM, Period) / EMA(TR, Period)
- The Average Directional Index (ADX) is calculated. It is an exponential moving average with the same period as in the previous step of a value called the Directional Index (DX):
DX = ((+DMI)-(-DMI))/((+DMI)+(-DMI))
ADX=EMA(DX, Period)
Thus we obtained the third line of the indicator. As I already said, all three lines are plotted in one separate window and fluctuate within the range from 0 to 100%. Although in practice none of them ever reaches either the zero line or the 100 level.
Ways to Use ADX

The problem with describing various signals from classic (and not only) indicators is the lack of statistics on the use of these signals. As a result, when recommending some signal for use, it often turns out that the author himself is not sure about the profitability of using it. I will try to avoid such an awkward situation and from now on, when writing this and subsequent articles, I will carefully study the effectiveness of a particular signal so that you can decide for yourselves whether it is worth using a particular indicator in your trading. Besides, would it not be interesting for you yourselves to know how much more effective one or another indicator is than a simple coin toss? Yes, this is a difficult and extensive task that has never been set before the authors of books and articles from the web, and because of that such information will be much more valuable. I will give you not only the maximum number of different options for using one or another indicator that can be found in the literature and on the web (and even those that cannot be found), but also statistics on the use of these signals in the real market, advice, and conclusions about the effectiveness of these signals. So, let us begin.
Coin Toss Signal

First of all, let us generate absolutely random expert advisor results, as if we were tossing a coin. With these results we will compare the signals generated by the ADX indicator and evaluate its effectiveness.
Research Method
Using a random number generator, I will generate a random number from 0 to 1. If the number turns out to be less than 0.5, the expert advisor will enter sells. If it is greater than 0.5, it will enter buys. The results for each pair are recorded in a separate table. At the same time, the performance of the expert advisor is evaluated separately when closed on the 1st to 12th candle after opening.
Studied periods: M1 - D1
Results
The goal of our research was not exactly this, but it is still worth paying attention to the impact of costs on trade results. The trading results from the coin toss signal are shown in the picture below. On the D1 period of each pair, the number of profitable trades was indeed distributed within 50% with an error of about 2-3%. But the lower the period, the fewer profitable trades there are. On the M1 period, the average number of profitable trades is from 20 to 30%, and this is not a typo or a mistake. This is the effect of the spread and slippage on the overall trading results. What does this mean? In order to trade at breakeven on the D1 period with an equal size of stop and take, it is enough to have a percentage of profitable trades of about 50%. To trade at breakeven on the M1 period, you will need 70-80% profitable trades! That is how great an influence trading costs have on the result, and this must always be kept in mind. Just look at the results for the H1 period: even there, to get a final zero, you need to have at least 55% profitable trades. Makes you think, does it not?
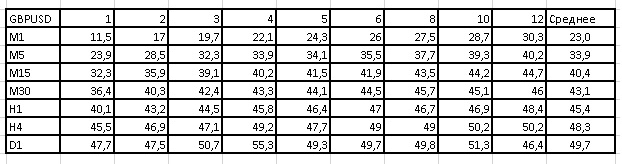
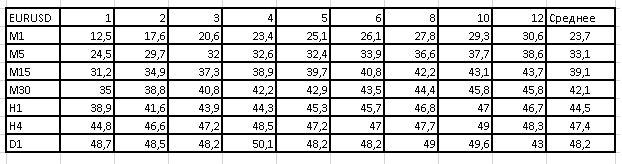
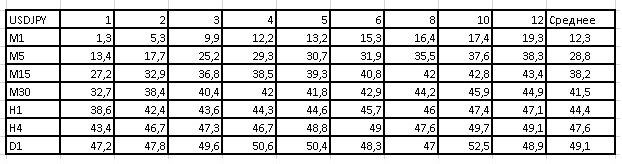
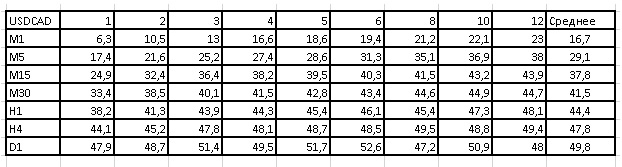
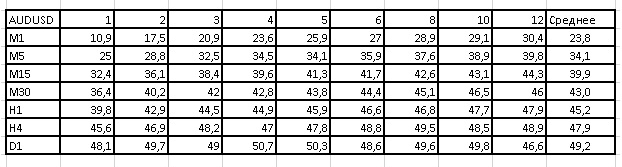
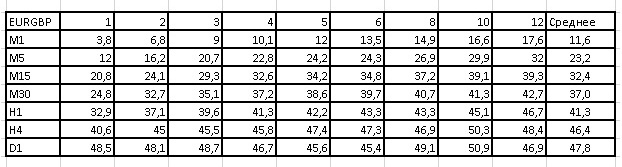
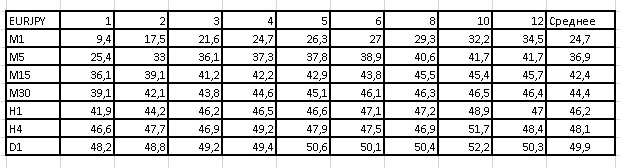
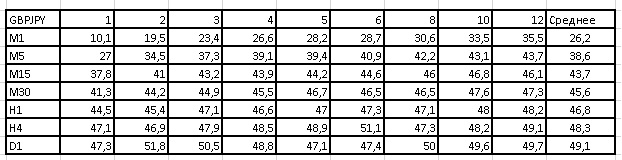 But that was not the point. We have now obtained a benchmark against which we will compare trading based on the indicator's signals. If, based on the indicator's signal, the percentages of profitable trades turn out to be higher, we can conclude that such a signal is effective. At the same time, by calculating the average number of profitable trades, it is possible to quantitatively determine this very effectiveness by finding the difference in average percentages between the indicator's signal and a coin toss.
Crossings of the +DI and -DI Lines During ADX Growth

Let us begin, perhaps, with the following entry signal: the crossing of the +DI and -DI lines during the growth of the ADX index, which is located above DI. In theory, their crossing should mean a change in the current tendency, the beginning of a new trend. ADX growth also speaks of the emergence of a new trend, and its being above DI indicates the end of a flat.
Research method
This time we will test the effectiveness of this signal as follows. When a signal appears, we will look at how the first, second, third, and subsequent candles closed. In this way, we will determine the predictive qualities of the signal.
We will check up to 12 candles from the moment the signal appears. Once again, we will run the tests on all major currency pairs, on all timeframes from 2000 to 2017.
The ADX indicator period is 14.
Studied periods: M1 - D1
Studied currency pairs: USDCHF, GBPUSD, EURUSD, USDJPY, USDCAD, AUDUSD, EURGBP, EURJPY, GBPJPY
Results
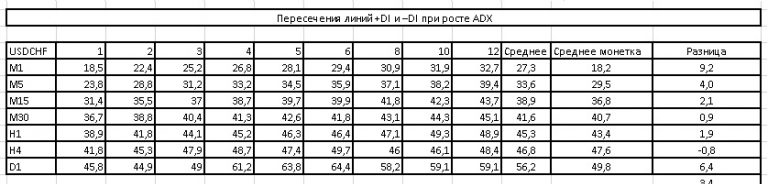


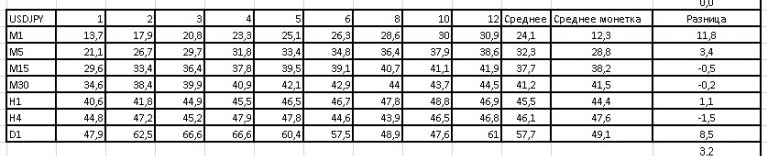
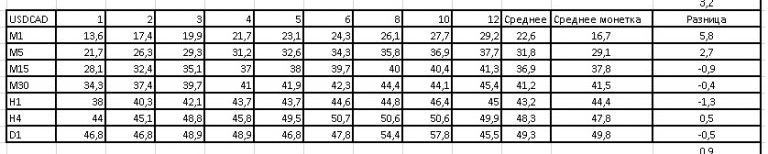
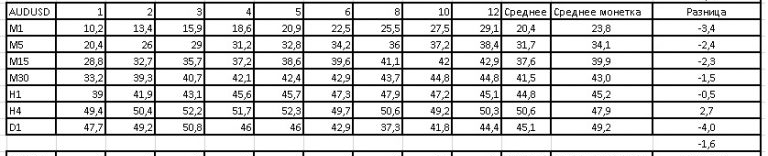
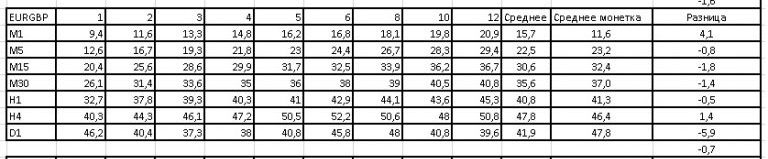
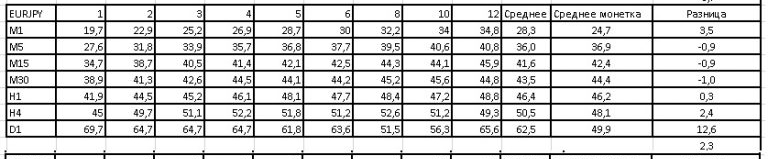
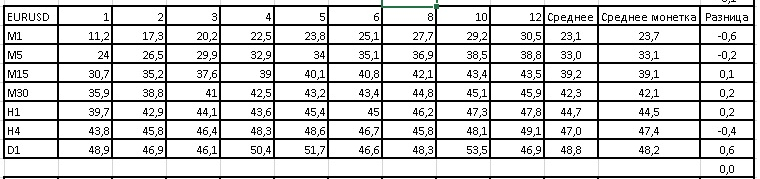
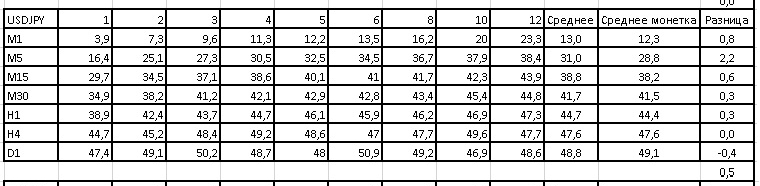
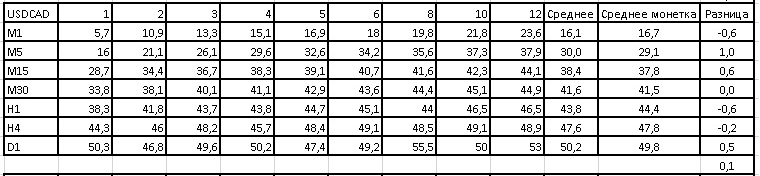
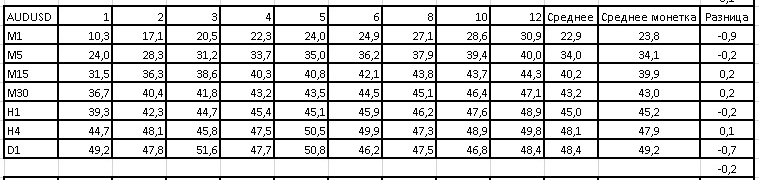
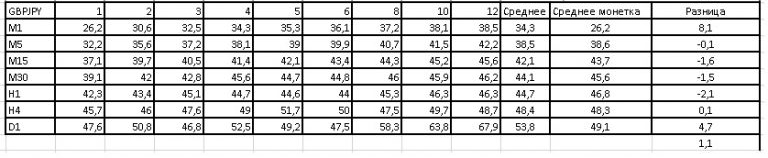 The picture above shows tables for each currency pair. The numbers in the columns are the number of candles, the rows are timeframes, and at the intersection is the number of profitable signals, those for which, when they occurred, the signal was justified, if only by a couple of points. At the same time, the tables contain three additional columns: the average number of profitable trades by timeframe, the average number of profitable trades by timeframe for the coin toss, and the difference between them. Below is the average number of profitable trades across all timeframes for a specific pair.
Conclusions
As can be seen from the table, the predictive abilities of this signal leave much to be desired. There is no correlation whatsoever between the crossing of the -DI and +DI lines during a simultaneous increase in the ADX readings and the behavior of price. Perhaps this makes sense in exchange-traded markets, but not in the forex market. As you noticed, the row for the D1 period has fairly good results. Still, no special attention should be paid to them, since the sample of trades was too small: 40-70 trades for the period from 2000 to 2017. On the timeframes on which trading is very difficult because of high trading costs, the percentage of profitable signals from the indicator is higher. At the same time, signals on the most popular tfs (M15-H1), as a rule, are inferior to a coin toss. Thus, we become convinced of the advisability of using such a signal from the ADX indicator on periods from H4 and higher, provided that the profit-to-loss ratio is above one.
The Position of +DI and -DI Relative to Each Other

The previous signal was complex, and now we will try to test something simpler. For example, a simple crossing of the +DI and -DI lines.
Research method
It is no different from the previous one
Results
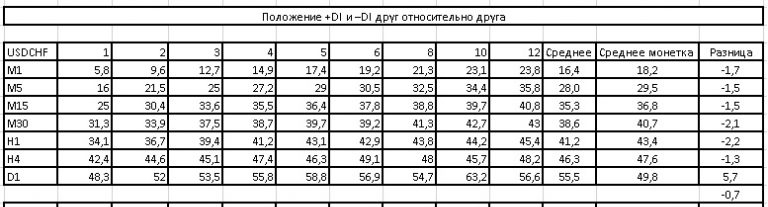
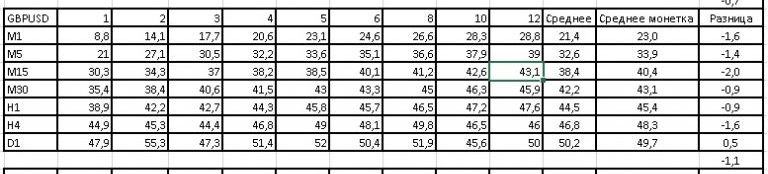
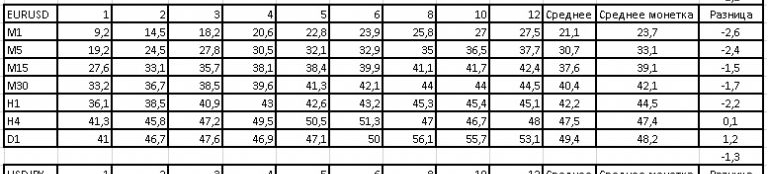
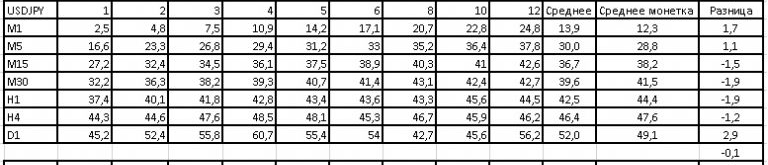
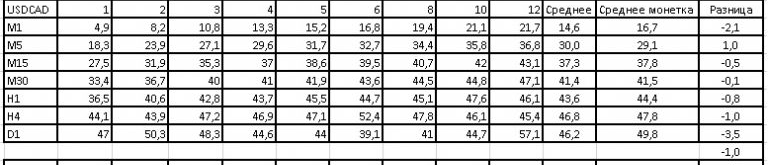
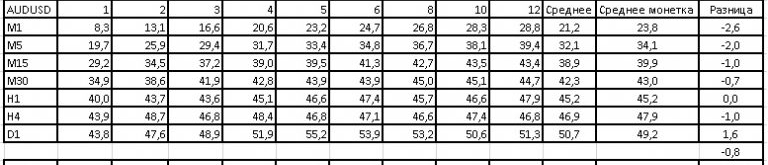
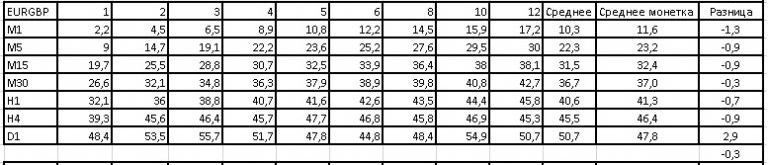
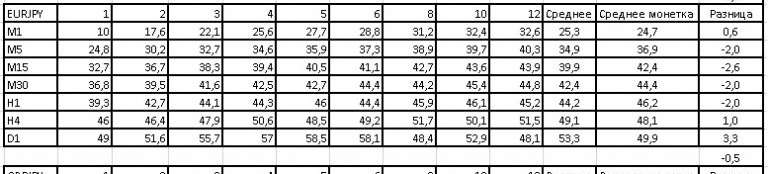
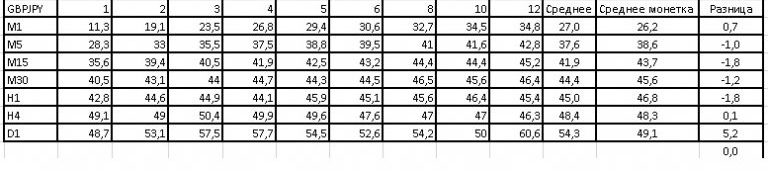 The picture above shows tables for each currency pair. The structure of the tables is the same as in the previous version.
Conclusions
Once again, we are convinced of the advisability of using the +DI and -DI line crossover signal of the ADX indicator on periods from H4 and higher, provided that the profit-to-loss ratio is above one.
Using the ADX Indicator as a Trend Filter. Option 1.

In this study, we will examine the effectiveness of the ADX indicator as a trend filter. We will take as a basis a trading system based on coin-flip signals, but we will enter trades only if the ADX indicator is rising and above 20.
Results and conclusions
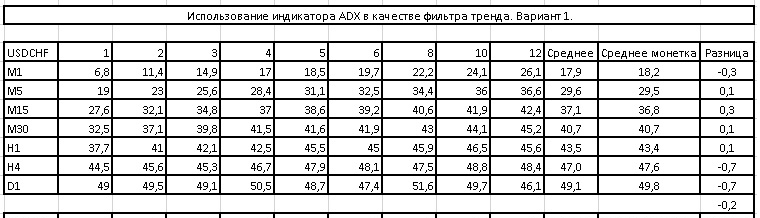
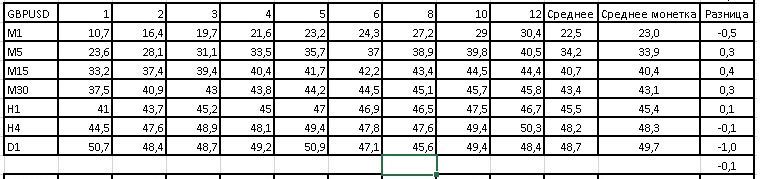
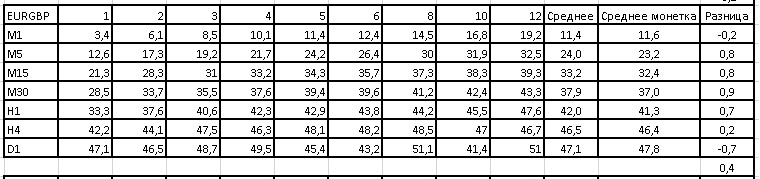
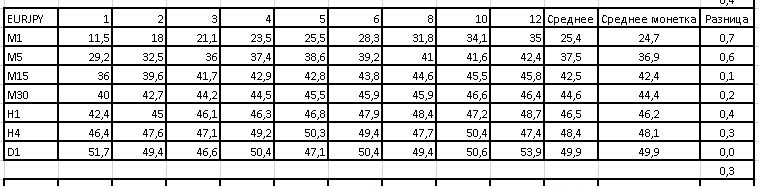
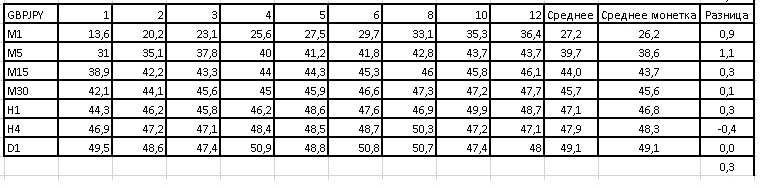 The results can be seen in the picture above. This approach to filtering trades improved the result only slightly. But the magnitude of the improvement is so small that the use of such a filter does not seem advisable.
Using the ADX Indicator as a Trend Filter. Option 2.

There is another interesting approach to using the ADX indicator as a trend filter that would be worth testing. It is as follows: while ADX is above 25, trend-following systems can be used; as soon as ADX falls below it, channel trading systems come into play.
Research method
To begin with, we will create two simplest systems, a trend-following one and a countertrend one. The first will use the crossings of two moving averages to enter and exit positions, while the second will use overbought and oversold zones to enter and exit. At the same time, only one position can be open at any given moment. Since we are measuring the effectiveness of trend determination by the ADX indicator, in the first case we will determine the presence or absence of a trend in a completely random way. The random number generator, that is, the coin flip, will help us again. If a number below 0.5 comes up, we use the channel system. If it is above, the trend-following one. In the second option, we will connect ADX as a trend filter instead of the coin flip and see how much the results improve. As the trend/flat threshold, we will use the level 25 recommended in all reference books and books.
Studied periods: M1 - D1
Studied currency pairs: USDCHF, GBPUSD, EURUSD, USDJPY, USDCAD, AUDUSD, EURGBP, EURJPY, GBPJPY
Indicators:
Trend-following system: entry/exit on the EMA13 and EMA21 crossover
Countertrend system: entry/exit when the WPR14 indicator enters the -10 and -90 zones
Trend/flat switching: coin flip and ADX14 with level 25.
Results and conclusions
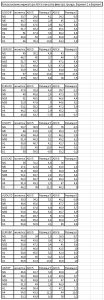
The results can be seen in the picture above. Curiously, the approach to trend filtering by ADX indicator readings recommended in a huge amount of literature turned out to be considerably worse for this task than using a coin flip. If the previous ways of using ADX are justified when the risk-to-reward ratio is above 1 to 2, then this method of trend filtering clearly should not be used in trading. It showed its inefficiency on any period and any currency pairs.
Using the ADX Indicator as a Trend Filter. Option 3.

Another way to use ADX indicator readings to determine the market condition is the position of ADX relative to +DI and -DI. I like this approach because it is not tied to a specific level like 25 in the previous option. If ADX is above +DI and -DI, it means the market is trending; if it is below one of the lines or both, it is flat.
Research method
As in the previous case, we will compare the performance of two systems, the coin flip and ADX. Moreover, we already have the coin flip readings.
Studied periods: M1 - D1
Studied currency pairs: USDCHF, GBPUSD, EURUSD, USDJPY, USDCAD, AUDUSD, EURGBP, EURJPY, GBPJPY
Indicators:
Trend-following system: entry/exit on the EMA13 and EMA21 crossover
Counter-trend system: entry/exit when the WPR14 indicator enters the -10 and -90 zones
Trend/flat switch: coin toss and ADX14 (above +DI and -DI).
Results and conclusions
The results can be seen in the picture above. The "ADX 6" column records the readings of our filtering system using ADX, while the "Difference 6" column shows the difference in readings compared to the "coin toss." And once again the "coin toss" won, although this time not by such a large margin.
Using the ADX Indicator as a Trend Filter. Option 4.

Some time ago, while browsing the web, I found several newsletters devoted to the ADX indicator. One of the topics widely discussed in them was entering a trade in a trend-following system only if the ADX reading is higher than on the previous candle.
Research method
We will use the simplest trend-following system that we came up with while checking the previous signals: the crossover of exponential moving averages with periods 13 and 21. We will run two tests: in the first we will trade at every moving average crossover, and in the second only on the condition that ADX is rising.
Timeframes studied: M1 - D1
Currency pairs studied: USDCHF, GBPUSD, EURUSD, USDJPY, USDCAD, AUDUSD, EURGBP, EURJPY, GBPJPY
Indicators:
entry/exit on the EMA13 and EMA21 crossover
Trend/flat switch: none and ADX2<ADX1.
Results and conclusions
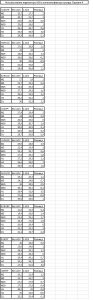
The results can be seen in the picture above. As you can see, this way of using the ADX indicator pays off, increasing the probability of getting a profitable trade by a couple of percentage points. Moreover, this signal works best on timeframes up to H1, so this way of filtering trades may be useful for intraday traders.
Using the ADX Indicator as an Exit Condition. Option 1.

When ADX rises above both directional lines, in theory this indicates market overheating. When ADX begins to move downward while remaining above both lines, this is a signal that the dominant trend may reverse or end. In principle, this is a good moment to take profits or lock in part of the position. Well then, let us test it.
Research method
We will take as a basis the trend-following system from the previous study and add one more exit condition to it: ADX is above +DI and -DI and begins to decline.
Timeframes studied: M1 - D1
Currency pairs studied: USDCHF, GBPUSD, EURUSD, USDJPY, USDCAD, AUDUSD, EURGBP, EURJPY, GBPJPY
Indicators:
Entry on the EMA13 and EMA21 crossover
Trend/flat switching: no
Exit on the reverse crossing of EMA13 and EMA21 or when ADX, located above +DI and -DI, declines
Results and conclusions
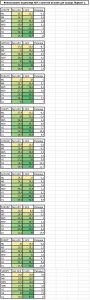
The results can be seen in the picture above. As can be seen, this exit method significantly improved the results of the basic system on all instruments for periods from M15 and above. It is recommended to take note of this exit option for use in trend trading systems.
Using the ADX Indicator as an Exit Condition. Option 2.

Another option that can be found online is to exit a position when the ADX falls below level 42. I like this option less, because there is a numerical level here that will not change along with market changes.
Research method
As a basis, we will again take the trend system from the previous research and add another exit condition to it: ADX crosses levels 42 and 25 from top to bottom. Thus we will obtain data for two levels.
Studied periods: M1 - D1
Studied currency pairs: USDCHF, GBPUSD, EURUSD, USDJPY, USDCAD, AUDUSD, EURGBP, EURJPY, GBPJPY
Indicators:
Entry on the crossing of EMA13 and EMA21
Trend/flat switching: no
Exit on the reverse crossing of EMA13 and EMA21 or when ADX falls below 42 (25).
Results and conclusions
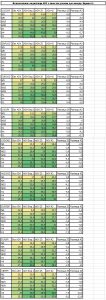
The results can be seen in the picture above. As expected, the results depend heavily on the market. Level 25 performs better on the H1 period and above, whereas level 42 performed well on periods below one hour. Nevertheless, it is clearly visible that on the H1 period it is more expedient to use the exit method considered slightly above.
DMI Divergence

This is a situation when DMI and price diverge or do not confirm each other. For example, when price makes a new high, but the corresponding high in +DMI is lower. Divergence, as a rule, is a warning to tighten risk control because it signals a change in the strength of the fluctuation and usually precedes a pullback or reversal.
A series of peaks in the ADX indicator is also a visual representation of the overall momentum of the trend. The dynamics of ADX indicate when the trend is gaining or losing momentum. Momentum represents price acceleration. A series of higher ADX peaks means that trend momentum is increasing. A series of lower ADX peaks indicates a decrease in trend momentum.
Testing the divergence signal is quite difficult, since determining the presence of divergence requires trader intervention.
Shortcomings of the ADX Indicator

ADX can still be quite a valuable tool, as we were convinced while studying ways to exit positions and filter entries using this indicator. Nevertheless, there are several features of the indicator that are important to know about.
First, ADX is a slow indicator. We have already examined the formula for calculating this indicator, and you clearly saw that the smoothing of the output data occurs twice. On the one hand, this reduces the number of false signals, but on the other hand, the indicator is sometimes just too lagging.
Second, the ADX indicator has another, much more serious shortcoming. The fact is that the very logic of calculating the indicator makes it very reliable when it comes to a prolonged trend and extremely unreliable during volatile movements without a definite direction. So, a rise in the ADX value is a reliable sign of a trend, but only if before this trend emerged there was a flat market. Why does this happen? Well, let us imagine that the market was flat for a long time and then an upward movement began to take shape. In this case, ADX will start to rise. If the trend continues long enough and then a reversal occurs (price simply draws a new high and collapses sharply, as often happens), ADX will fall. Despite the fact that the trend has already changed and price is rushing downward, ADX will be falling, indicating that a flat dominates the market. This will continue until most of the data where price was still rising drops out of the indicator calculation. As soon as that happens, ADX will start rising again, but by that moment half the trend, or even more of it, may already have passed. This is the main shortcoming of the ADX indicator that prevents it from achieving popularity in the FOREX market. Unlike exchange-traded markets, where prolonged trends are common, movements in the forex market are more saw-like in nature, precisely the kind the indicator dislikes so much. This same feature of the indicator, beginning to fall when the direction of price movement changes sharply, gave us a fairly good way to exit a position.
Trading System Based on the Crossing of +DI and -DI

The directional movement system is unique in that it shows you when a new trend is likely beginning. The most common advice online for trading the ADX indicator is as follows: buy if +DI crosses above -DI, ADX is above -DI and rising. Open sell positions if -DI crosses above +DI, ADX is above +DI and rising. When ADX starts falling and a reverse crossing of +DI or -DI occurs, it is worth thinking about closing positions. These are exactly the recommendations you can find in most books on technical analysis. Let us test them!
Research method
Trades are executed according to the rules described above with a standard lot of 0.1. Additional trades are not opened when the signal appears again (if we are already in a trade). Trading is conducted without stops and takes - only entry rules and exit rules. All actions are performed at the opening of a new candle. The test is carried out for all major currency pairs and timeframes for the period from 2000 to 2017.
Initial deposit 100 000$
ADX indicator period - 14.
Studied periods: M1 - D1
Studied currency pairs: USDCHF, GBPUSD, EURUSD, USDJPY, USDCAD, AUDUSD, EURGBP, EURAUD, EURCHF, EURJPY, GBPCHF, CADJPY, GBPJPY, AUDNZD, AUDCAD, AUDCHF, AUDJPY, CHFJPY, EURNZD, EURCAD, CADCHF, NZDJPY, NZDUSD, GBPAUD, GBPCAD, GBPNZD, NZDCAD, NZDCHF
Results
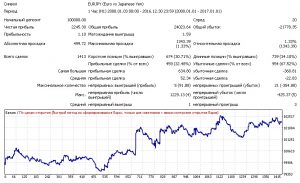
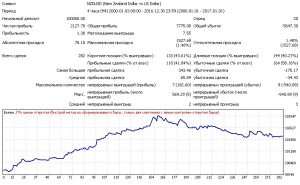
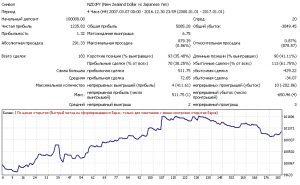
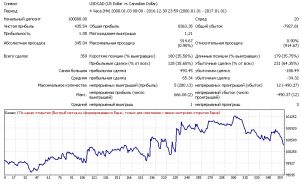
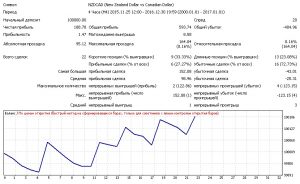
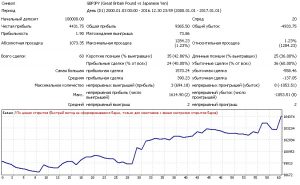
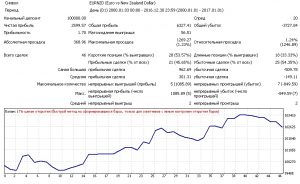
Quite a few positive results, mostly on periods above H1. Nevertheless, it is difficult to call such trading successful.
Conclusions
In trending markets such a trading system really does show a positive result; nevertheless, it can hardly be called a good one. At the same time, not a single currency pair produced a positive result on periods below H1. Overall, I think that in the stock market this approach may be more successful because of the more stable and prolonged trending states of those markets.
Wilder's Indicator System

The simplest trading method based on the directional movement system involves comparing two direction indicators, the 14-day +DI and the 14-day -DI. Wilder suggests buying if +DI rises above -DI, and selling when +DI falls below -DI. The author supplements these rules with the concept of "Extreme Points" (Extreme Point, EP). The idea is that if all the above conditions come together, then instead of entering a position we simply mark the high or low of the candle on which this happened. At the same time, if price fails to break through the extreme point, one should maintain the opposite position. That is, we get a reversal system with constant presence in the market on one side or the other. For trending markets this is quite good; let us check how things stand in the Forex market.
Initial deposit 100 000$
ADX indicator period - 14.
Studied periods: M1 - D1
Results and conclusions
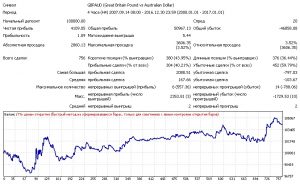
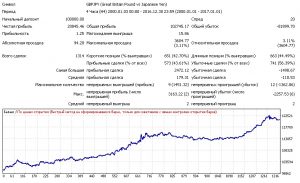
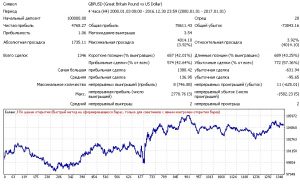
The system turned a profit on a small number of instruments: AUDJPY, EURCAD, GBPAUD, GBPJPY. These pairs are distinguished by good trends, which once again proves my conclusion: the ADX indicator is poorly suited for use in the Forex market.
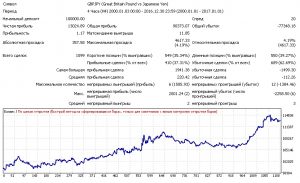
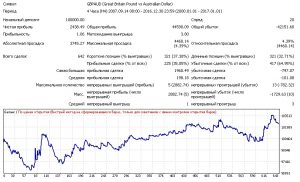
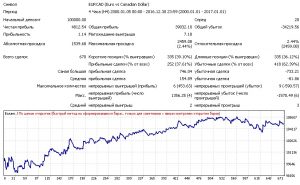
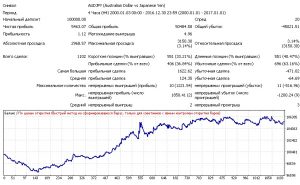
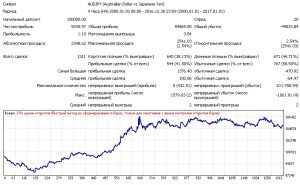
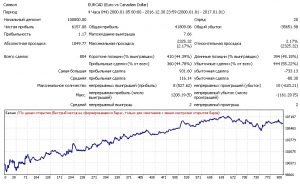
At the same time, adding the exit rule we found and tested based on the reverse crossing of level 42, discussed above, significantly improved the trading characteristics of the system.
Trading System on the Crossing of +DI and -DI According to Elder

If +DI is above -DI, play only to the upside, and if it is below, then only to the downside. The most suitable moment to enter an upside play is when both +DI and ADX are higher than -DI, while ADX is rising. This indicates strengthening of the trend. Play to the upside by placing a protective stop order below the recent low. The most suitable moment to enter a downside play is when both -DI and ADX are above +DI, while ADX is rising. This indicates strengthening of the bears. Play to the downside by placing a protective stop order above the recent high. A decline in ADX indicates weakening of the trend, and at that time one should not follow the trend.
Initial deposit 100 000$
ADX indicator period - 14
Studied periods: M1 - D1
Results and conclusions
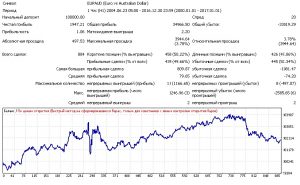
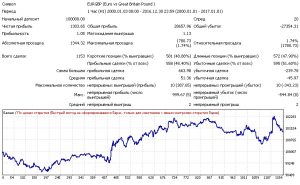
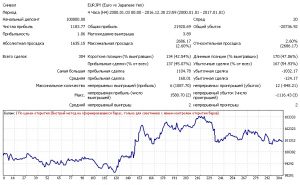
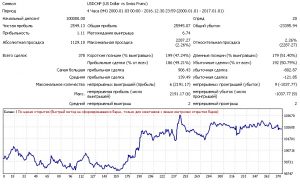
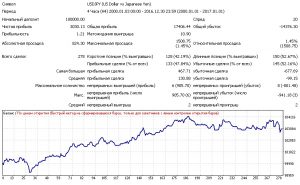
Such a system provides few entry points; nevertheless, on some pairs it turned out to be profitable.
Adaptive ATR Channel

The next idea can be considered within the framework of modernizing the system of the indicator's author. In the original system, we did not take into account the length of the channel that is formed from the extreme point into the depth of history. That is, we take not the maximum/minimum of the candle on which the crossing occurred, but count back a certain number of candles, obtaining a certain channel, on the breakout of which we subsequently trade. The main idea of the adaptive channel is that there should be a variable time interval of the breakout channel. This interval should change depending on the strength of the trend. The stronger the trend, the fewer days participate in the formation of the channel (a strong trend means several days in the channel, a weak trend and, consequently, a volatile market mean more days in the channel).
The formula may look approximately like this:
X = 150/ADX, where X is the number of candles in the channel.
You can even tie the formula to the period of the indicator, for example like this: 10*ADXPeriod/ADX.
Results and conclusions
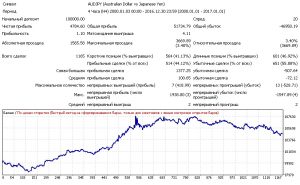
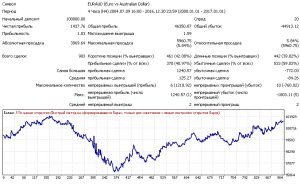
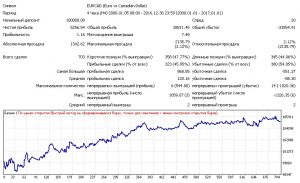
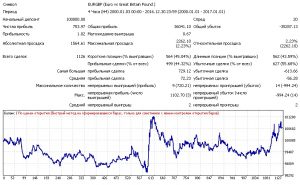
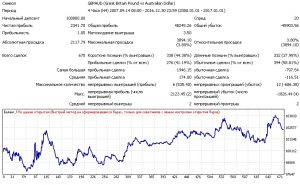
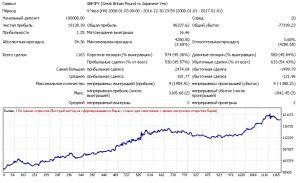
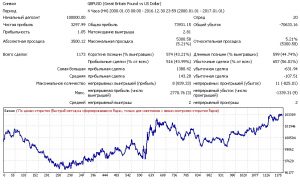
Overall, the system improved its performance a little, but this is still not enough for good trading. My task in writing this article did not include creating a profitable trading system; I only want to separate in practice the truly worthwhile ways of using one or another indicator signal from ordinary traders' legends. For those who became interested in further modernization of the resulting system, I advise paying attention to position management and exit conditions (there may be several of them). But for now, we have obtained a fully workable trading system consisting of only one indicator, which suggests that ADX is still not so highly valued by many traders for nothing.
So Should You Use the ADX Indicator or Not?

ADX is an excellent tool for assessing the current situation in the market. However, as I have said more than once, it is a mistake to use only one indicator for trading and to be strongly dependent on it. ADX can be a very valuable tool if it is used correctly together with other indicators. The simple but very important information provided by ADX makes it possible to increase the percentage of winning trades by a significant amount. Many tests of trend-following results only when ADX rises clearly demonstrate its meaning and value. Yes, waiting for ADX to rise very often means a delay in entry, but the obvious advantages of reducing the number of losing trades are a good reward for the waiting.
How you will apply this indicator depends on you and your trading style. The task of this article is to suggest possible options for using ADX. In any case, before using a new indicator in your system, test it on historical data and then on a demo account.
Conclusion

Of course, it would be a serious mistake to rely in your trading on the readings of only one indicator. To build, for example, a house, you need not one tool but a whole set. The same is true for building a trading system. Yes, one indicator may be the foundation of a system, but auxiliary tools are always required. And although according to the results of our study we were convinced that ADX is not the best foundation for a trading system, it is still possible to take several successful methods of application from everything stated above. Moreover, we managed to build a fairly profitable trading system using only this one indicator. Of course, the methods of entering and exiting positions in this system differ somewhat from the most popular ones, but, as we have seen today in the examples, not everything that is popular necessarily works. More likely the opposite. Therefore, always try to think originally, devise your own methods of applying one indicator or another, and always test your conclusions in practice.
Best regards, Dmitry aka Silentspec TradeLikeaPro.ru
