How do major banks trade on Forex?
 Every weekday we publish Forex analytics that for two years included an insider table of active and pending orders of major banks. The entry levels, take-profit and stop-loss levels, as well as the current and final results of trades, were described in sufficient detail.
Unfortunately, the trade-broadcasting service stopped working due to a conflict with the data source, but constant observation still makes it possible to analyze how banks trade on Forex by studying the trades of currency traders at major banks, the “pillars of the financial industry.” We ended up with a very interesting study, and today we invite you to get acquainted with it: you will learn which strategies the world's largest banks use in the Forex market, how long they hold positions, and how effectively they trade.
Regular readers of the daily reviews will remember that the table included the positions of 15 banks, which can be conditionally divided into “perennial losers” and companies that trade profitably.
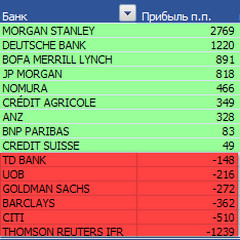 Profitable trades are of the greatest interest, so they are subjected to comprehensive analysis. Banks with negative results were removed from the review. In the future, when an accurate hypothesis appears on the feasibility of this style of trading (hedging third-party positions, “transfer of funds”, etc.), we will definitely devote a separate article to this.
Forex market in 2018

The review includes an analysis of bank trades throughout 2018. To better understand how the traders at these financial companies trade, let us look at how trends developed in the Forex market during the year under review.
The overall picture can be tracked across six major currency pairs: on the charts of four of them, a flat is clearly visible through the end of March, followed by a sharp trend through mid-summer, and for some until the end of summer. Autumn and winter, after relatively brief range trading, were a period of complete divergence in the movements of the major currencies.
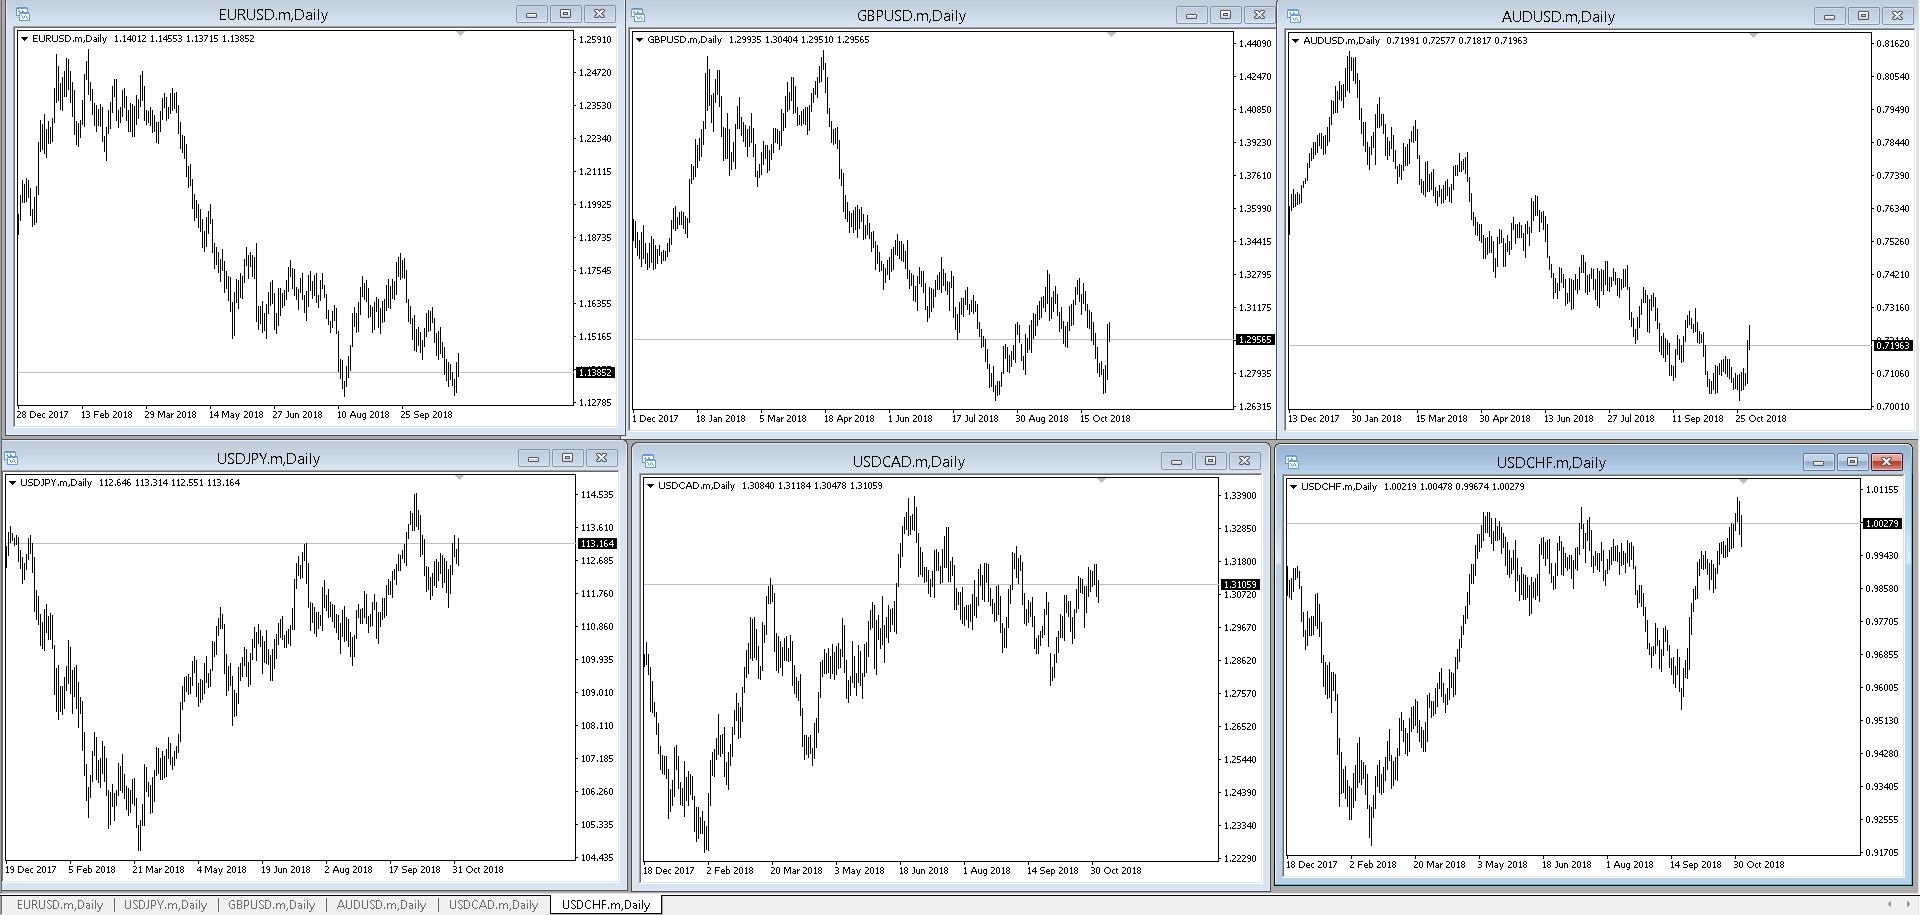 To better understand how these periods affected the trading strategies of currency traders, the review is broken down into a separate analysis of each bank's trading.
How Morgan Stanley trades

Currency traders at Morgan Stanley brought the bank 3518 pips of profit over half of 2018, which is a strong result given the medium-term trading strategy: trades were held for up to 18 days on average.
From March to October, the bank entered the market 29 times and “made a mistake” in 7 cases, “catching” 749 points of losses on stops. The traders ranked first in net profit and forecasting accuracy, which reached 76%.
Despite ranking second in number of trades, Morgan Stanley used a multi-currency trading strategy, spreading its entries across 18 instruments.
During the flat period from January to March, the bank did not make trades on the major currency pairs, using crosses instead. At the same time, positions in GBPNZD, EURCAD, EURAUD, and NZDCAD were opened once and never repeated, while the pairs CADJPY, CHFJPY, and CADCHF were traded at least one more time.
It is obvious that Morgan Stanley traders prefer to use only trend systems, choosing cross-currency instruments during flat periods on the major pairs. As for the accuracy of determining trade direction, as can be seen from the charts, in every case it was chosen correctly.
The following features of spring trades are interesting:
- Trades of varying unsystematic duration, meaning that even when the trend was guessed correctly, for example in CADJPY, a position in the same direction was opened either six months later or not repeated at all (GBPNZD, EURCAD, EURAUD, NZDCAD);
- The traders sit through the CHFJPY loss and quite openly average down in CADCHF.
This lack of any unified approach to trading makes one think about insider trading; the trades shown on the charts have only one thing in common: they were all closed by a trailing stop without reaching their set take-profit targets.
The hypothesis of the preferential use of cross-currencies during flat periods in the major pairs is confirmed by the positions Morgan Stanley accumulated in them in May and June, when EURUSD was moving sideways.
The USDCAD pair, which is considered one of the majors, also slipped into the company of “one-off trades” alongside EURNZD and EURJPY; this can be explained by the unclear dynamics of the “Canadian” currency's quotes throughout 2018.
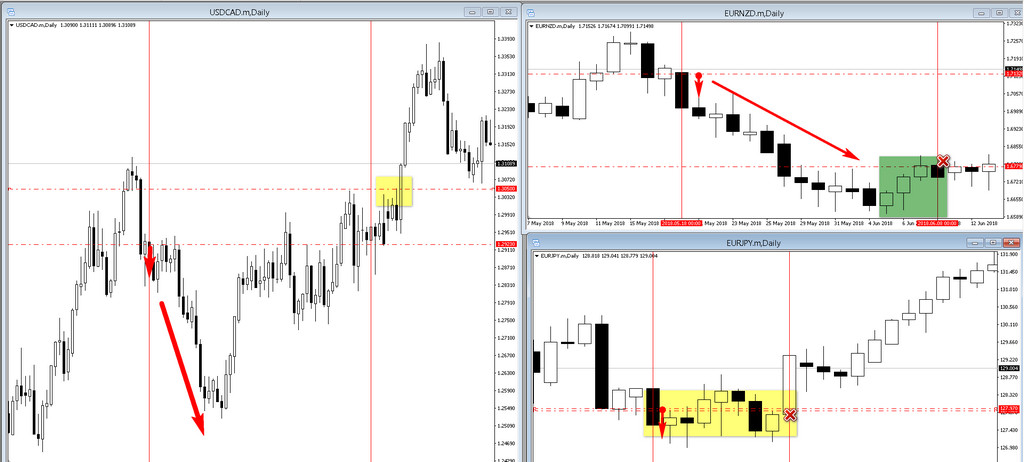 If there is nothing unusual in the opening and closing of positions on euro cross-pairs, EURNZD is closed with a profit by a trailing stop on a pullback of the trend, like EURJPY, but for a different reason, namely a long flat period, then trading in USDCAD is anomalous.
Having correctly identified the start of a trend, the Morgan Stanley trader does not follow it with a trailing stop, as was done in the other instruments. Sitting in the position for a month, he waits for a reversal and holds on until the very last moment, when the position is closed by stop loss. Such anomalies can only be explained by the fact that the bank was counting on some kind of insider information.
Among the remaining major currency pairs, the largest number of trades occurred in EURUSD, USDJPY, and AUDUSD; they divided the traders' attention equally among themselves. The fewest positions were opened in USDCHF (not counting USDCAD).
Major currency pairs Morgan Stanley started trading in the spring; the first attempts to enter EURUSD and USDJPY seemed unsuccessful to the traders, so they “reversed,” but in the other pairs the trade directions did not change.
EURUSD – traded hard against the trend, although the first position at the end of April was opened in the right direction. For two months of holding the short Morgan Stanley earned 377 pips, closing on a market pullback.
After taking a break from trading for exactly one month and obviously taking into account the formation of a double bottom on the breakout of local resistance, the trader opens a long position at 1.1600. Although there are many options for closing or managing the position with a trailing stop, Morgan Stanley allows the trade to close at a loss at 1.15 in order to immediately open a trade at the bottom, without being afraid to catch a “falling knife” by entering at 1.1350. The duration of the trade will be less than a week, but thanks to the strength of the rebound from the bottom, the trade will bring the bank 277 points.
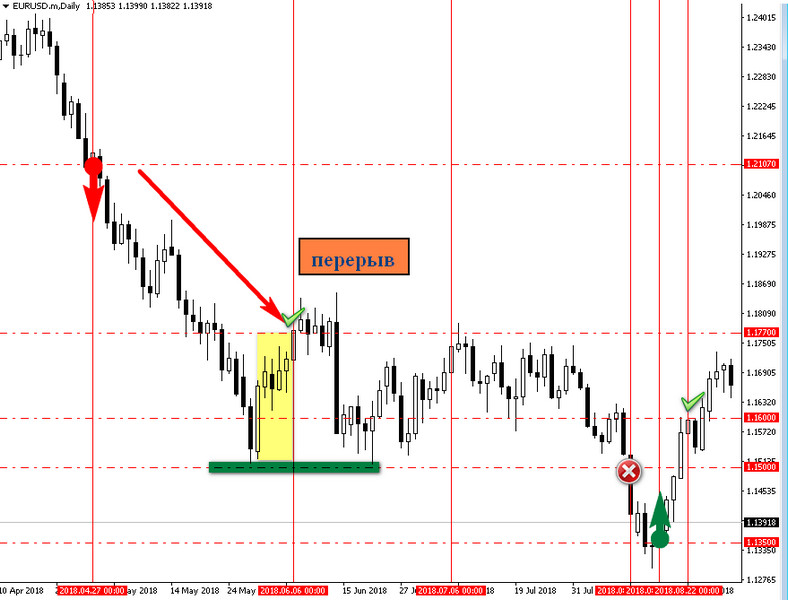 By violating the unwritten rules and postulates of trading,Morgan Stanley closes with two trades more than 500 pips on EURUSD.
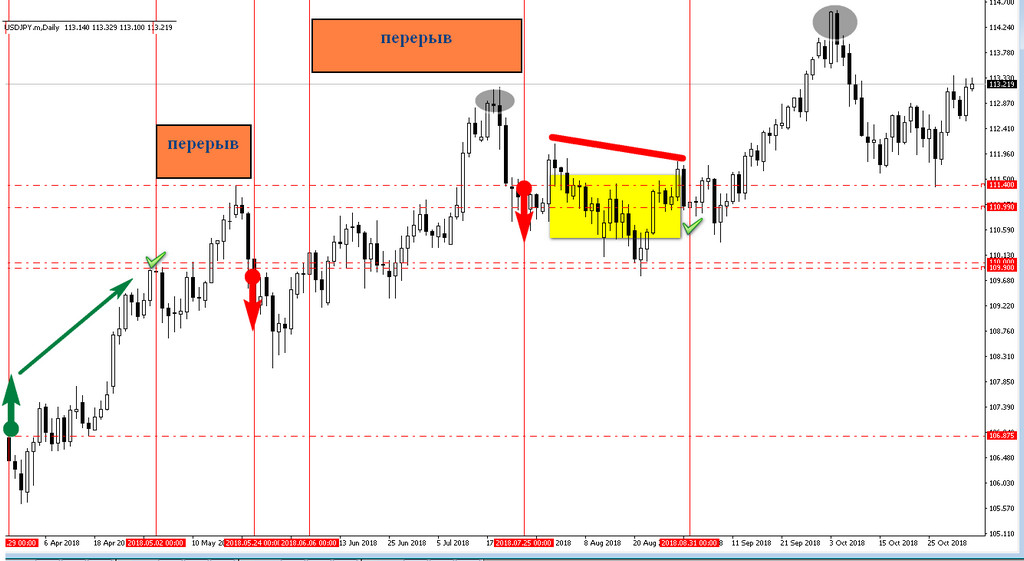
USDJPY is also traded against the trend, repeating the characteristic “mistakes” seen in EURUSD. First, the position was opened successfully along the trend and held long enough to bring the bank 313 pips, closing at a statically set take profit of 110. After the break, the “search for the bottom” begins, but the trader manages to close the trade at +10 pips at market.
Despite the next rise of USDJPY to new local highs and the classic visual picture of the trend, the trader opens a sell position at the bottom of a corrective rise. The subsequent flat allows the trade to be closed with a profit. Despite a number of technical signals that the position was opened correctly, the bank somehow exits right before the quotes take off to new highs.
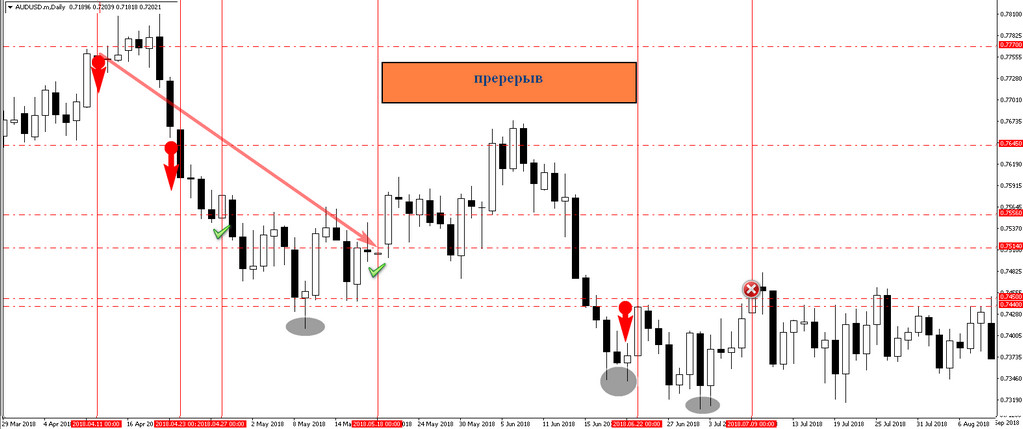
 The trading style in AUDUSD differs from the others in its attempt to build a pyramid of trades while trading the trend. The bank opened three positions in the direction of falling quotes; the first was the most successful and longest-running, and it was closed at market with a profit of 256 points.
At the end of the same month, with an open position already in place, the traders increased their shorts, “unexpectedly” closing them in profit on the fourth session, despite the active downward movement of the quotes. The break in trading came during a strong upward market rebound, but for some reason the bank ignored the further decline, opening a dangerous short at the bottom and “catching the knife” from the lows of the year.
The trade turned out to be successful, and the AUD price again updated the lows of the year, but at the same time the traders moved the stop almost to breakeven without locking in profit; the order closed at minus 10 points after another rebound from the bottom. At this point the downtrend was over, quotes recovered, and the bank made no further attempts to trade this instrument.
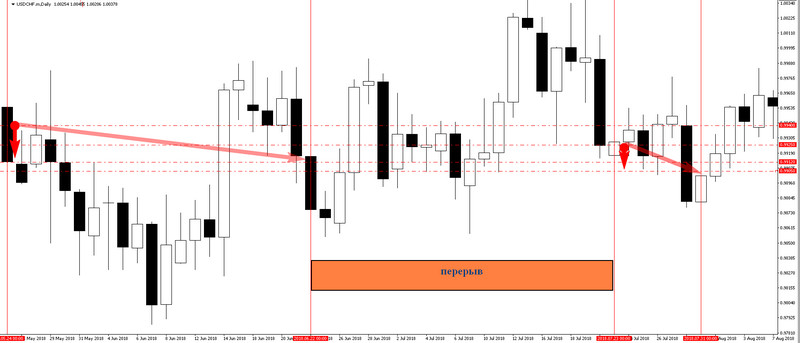
 Trading the USDCHF pairindicates that there are some “unpredictable” movements for traders. Positions were opened in a flat, while the bank opened a sale almost at the bottom. But both trades were successful and were closed on the market with minimal profit, bringing in 48 points.
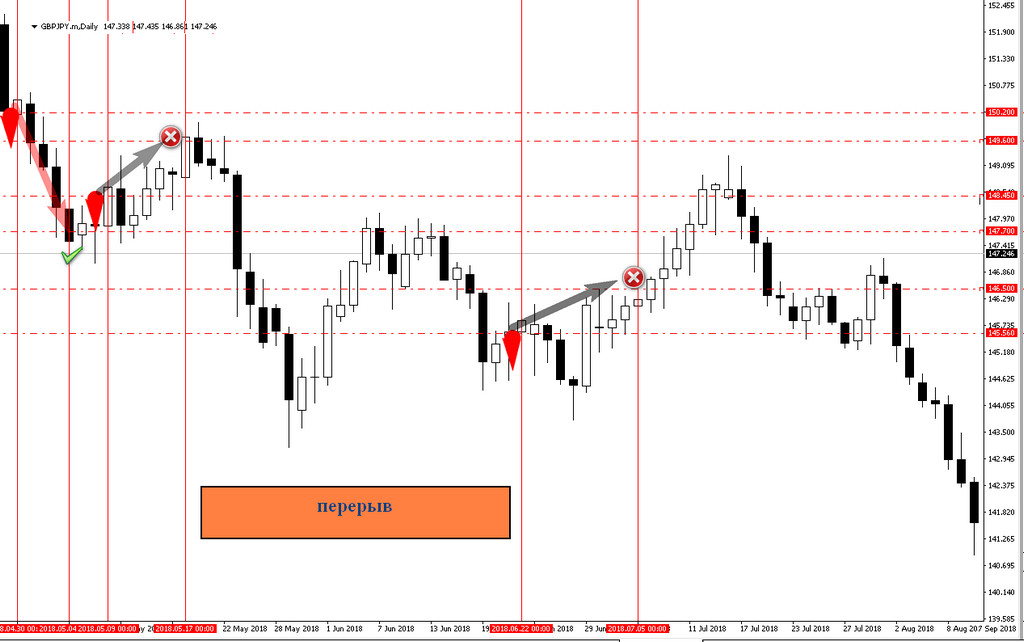
 The most popular among “crosses”from traders Morgan Stanley turned out to beGBPJPY pair. As is known, the tool is used intraday speculators because volatility, the average range of which reaches about 170 pips, thanks to impulse trends.
Trading this instrument in 2018 did not bring success, despite the fact that the trades were opened according to the trend, the short was successful only in the first of them, closing at plus 250 points. The remaining positions turned out to be unprofitable, but in general the total minus of 209 points was less than the first profit.
In the two negative short trades, it is unclear what prompted the entry. In the first case, the trade is made immediately after the profit is closed, preventing the quotes from rolling back (or settling at a new low); in the second case, a weak downward trend prevented the quotes from touching new lows.
That is, both entries were made at the bottom, which can only mean the presence of some fundamental information rather than technical prerequisites. This is confirmed by the fact that the downtrend continued to develop, but Morgan Stanley traders no longer traded this instrument.
 For the remaining cross-pairs, traders made two trades per year, which are characterized by the following features:
- CHFJPY – the downtrend was guessed from the first trade, which brought a maximum profit of 391 points, but the second position was opened at the very bottom, which forced traders to close at a loss slightly better than the stop loss of 149 points;
- CADCHF - an attempt to average the long was not successful - the quotes were in a flat stage, so both trades were closed a week later with a profit of 21 and 49 points;
- AUDJPY – traders managed to “sit out the loss” and close the short with a profit, the second time opening a position in the same direction was more successful - a sharp drop brought 160 pips of profit, despite the continuation of the trend, the position was closed according to the market;
- EURCHF – the bank did not guess with the trend in the first trade, but managed to turn around and open a long position at the bottom, which allowed it to compensate for the loss on the rebound and earn a total of +16 points.
How DEUTSCHE BANK trades

Traders DEUTSCHE BANK showed the highest profit factor, earning 1325 points, while losing 105 points. This is explained by the small number of positions - 6 trades per year, one for each pair: EURCHF, CHFJPY, NZDUSD, CADJPY, AUDJPY, EURGBP. Only the trade on the last pair brought a loss; in other cases, a profit was recorded.
Features of DEUTSCHE BANK trading:
- Lack of positions in major pairs, except for NZDUSD, dominance of crosses with the Japanese yen;
- One instrument - one trade;
- Long-term trading – the average time an order is held during a quarter.
The traders at DEUTSCHE BANK consistently, on a quarterly basis, bought the yen against the franc in January, the Australian dollar in March, and the Canadian dollar in June, which brought them profits in all cases.
Against this background, the decision to buy the euro against the franc and sell the single currency against the pound looks a little strange - this violates the correlation approach used when trading in pairs with the yen. The departure from principles was “punished” by a loss on EURGBP.
How BOFA MERRILL LYNCH trades

BOFA MERRILL LYNCH showed a significantly better profit factor than Morgan Stanley, losing 200 pips while earning 1091 pips. This was the fourth-best result among the ranking participants, achieved in four trades on the currency pairs EURUSD, GBPUSD, NZDUSD, and AUDJPY.
Features of trading BOFA MERRILL LYNCH:
- Focus on trading major currency pairs;
- One instrument - one trade;
- The average time to hold a position is a month.
The bank’s traders “guessed” the falling trend in EURUSD, making a perfect entry and exit at the local maximum and minimum of the market respectively, receiving 771 points of profit for the month the trade was held. In the other major pairs, trading followed correlation but was not as successful. In NZDUSD, where the position ran into a flat, the trader managed to exit with a profit and unexpectedly closed a GBPUSD long at market even though the pair continued to rise.
The loss occurred on AUDJPY: the trader entered the instrument on a pullback, and sat out the loss for about two months - there was no upward movement and the quotes went lower, hitting the stop.
How JP MORGAN trades

Traders at JP MORGAN earned 881 pips by making four trades without a loss. Such a high result was achieved with a long-term strategy: the average time spent in a position was the highest among the banks and amounted to 62 days. The trading instruments used were the cross-pairs EURCHF, EURAUD, AUDCHF, and the major pair NZDUSD.
Features of trading JP MORGAN:
- Holding a position despite a loss;
- Managing the order by moving the take-profit, rather than using a trailing stop;
- One instrument - one trade.
Unlike the previous bankers' strategies, JP MORGAN traders did not use correlations, as can be seen from the trades in EUR pairs going in different directions.
The deal with EURCHF looks anomalous - the take profit target was 1.15, but the position was closed at a sharply shifted TP to 1.1650, despite the non-reversal daily trend, which was developing in the right direction.
How NOMURA trades

Traders made 744 pips, losing more than 30% of that profit, on five trades during 2018. The bank focused on GBP pairs with CAD, USD and CHF currencies, as well as the EURCHF pair.
Features of NOMURA trading:
- Relatively low position holding time - an average of 15 days;
- Trading GBP using the correlation strategy.
The bank was waiting for a trend for the pound to strengthen against other currencies and managed to make money on this in the GBPCAD pair. Further attempts to trade in this direction led to losses, as did an attempt to turn around and make money by selling. Traders chose the GBPCAD pair for this, which brought profit on the purchase, but the short was closed at a loss.
The situation was saved by a long-term deal on the EURCHF cross, which brought 276 points in one month of holding the position.
How CRÉDIT AGRICOLE trades

The bank's traders lost about half of the 719 pips profit they earned in six trades trading on GBPCHF, EURCHF and USDCAD.
Trading features of CRÉDIT AGRICOLE:
- Trading by correlation in pairs GBPCHF, EURCHF;
- Using a medium-term strategy, with a trade holding time of about a month on average;
- Several trades on one instrument in one direction, chosen at the beginning of the year.
The large loss of half the profit earned on EURCHF and USDCAD was caused by sitting through the loss: the traders allowed GBPCHF to go more than 300 points into negative territory. This was the second trade in that pair. Perhaps the profit on the first position made them count on a restoration of the rising trend.
How ANZ trades

Traders ANZ showed weak activity on Forex, earning 496 points in three trades and losing 168 of them.
Features of ANZ trading:
- Specialization in AUD cross-pairs;
- Countertrend trading.
Despite the fact that the traders traded two AUD pairs, they opened positions in opposite directions in these instruments.
At the same time, the persistent trading against the trend in AUDNZD is of interest. The bank let a profitable position run too long in that instrument and, even after taking a loss of 168 points, later opened another long in the same direction. The second trade was successful: the AUD purchase was made at local lows, and holding the position for a month brought 391 points.
How BNP PARIBAS trades

Traders BNP PARIBAS made five trades, holding open orders for an average of a month, but lost 80% of the profit, earning 435 points and receiving a loss of 352 points. The bank traded on three instruments: EURCHF, USDJPY and EURJPY.
Features of BNP PARIBAS trading:
- Trading on EUR cross pairs;
- Paired arbitrage strategy.
It is possible that the choice of three pairs reflects a complex arbitrage model, as hinted at by the three trades made at roughly the same time. The traders bet on both the strengthening and weakening of the EUR while assuming that the yen would rise against the European currency and fall against the US dollar.
The resulting “three-legged” structure ultimately brought a loss, and the main profit came from EURCHF; this instrument managed to ride a trend that lasted two months and brought 380 pips of profit.
How CREDIT SUISSE trades

Traders CREDIT SUISSE showed the lowest result in the ranking, retaining only 49 points of profit out of 293 received for 4 trades on instruments: EURJPY, EURUSD and EURGBP.
Features of CREDIT SUISSE trading:
- Trading by correlation;
- Narrow specialization on cross pairs with EUR.
During the year, traders traded in the right direction, selling the euro. Despite the significant weakening of the European currency during 2018, the bank’s entry points were chosen poorly, which brought them only one closed trade in profit.
Conclusion

Analysis of trades showed that, for the most part, commercial banks trade long-term trends, rarely changing the direction of trades during the year. When major currencies are flat, traders open positions in cross pairs. These instruments are used most often, and currency pairs that have the same numerator or denominator are often traded based on correlations in matching directions.
A countertrend strategy is rarely used; however, there are market entries that are inexplicable from the standpoint of technical analysis. It can be assumed that banks use insider information in trading.
All banks hold positions for a long time; no one trades below the daily charts. Greetings to all intraday traders! ;)
Judging by the number of errors, the size and frequency of stop losses, it is obvious that Forex is not a 100% predictable market, even in the case of initial access to not yet published news.
Best regards, Alexey Vergunov TradeLikeaPro.ru