
HHLL Strategy: The Secret You Always Suspected
 Hello, forex trader friends!
Today we will get acquainted with a strategy called HHLL. It is quite possible that you know the strategy under a different name, since it belongs, one might say, to the classics. The strategy is based on Price Action, that is, on price movement, and no indicators are required. Nevertheless, indicators can be used for greater clarity and to simplify the search for setups.
This strategy will remind you of the teachings of Sam Seiden, one of the followers of Price Action. What is important, in my opinion, is that the trading system can serve as a basis for developing your own ideas. In the end, by adjusting something and adding something, you can come to your own vision, your own strategy, which will correspond personally to your view of the market and precisely to your approach to trading.
One of our forum members, Websmith, actually led me to this strategy. He created his own modification on its basis and successfully trades with it while managing a PAMM account. The system is based on the "Quasimodo" pattern, also known as Over and Under.
Strategy Characteristics
Platform: any
Currency pairs: any
Timeframe: any
Trading time: around the clock
Recommended brokers: Alpari, Roboforex, Amarkets
The Strategy Idea
 As I like to repeat, any strategy must have some kind of foundation or premise on the basis of which all this should work. When creating your own strategy, you also need such a premise, for example, some kind of market inefficiency or pattern, and already on this basis you can build points for entry, exit, and position correction.
To begin with, let us recall the classic definition of a trend. An uptrend is a series of successively rising highs and rising lows. That is, each high point (H) is above the previous one, and each low point (L) is above the previous one.
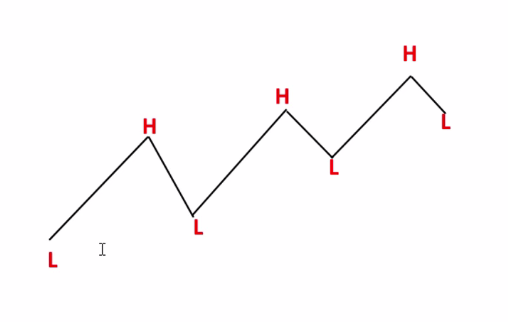 With a downtrend, everything is the opposite. In a downtrend, the highs successively decline, and the lows also decline.
Perhaps you are already guessing what exact structure we will be looking for on the chart. That is, what very first sign will allow us to understand when it is worth paying attention to the market and waiting for a possible entry point.
Suppose we have an uptrend. We have point H, after that a correction at point L. After that comes a higher high, designated in this strategy as HH (Higher High). Next, as soon as we see a break in the trend structure, that is, a lower low LL (Lower Low), we prepare to look for a point to sell.
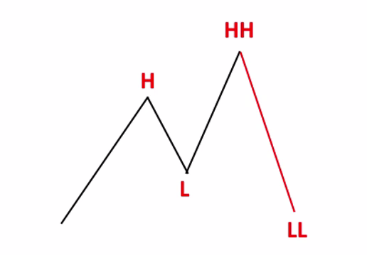 Similarly with a downtrend. First we determine the low L, then the high on the correction H, a lower low LL, and finally a higher high HH. This means that the structure of the downtrend is broken. We pay attention to this situation and wait for a possible entry point for buys.
Entry Rules
 First, let us consider an entry for a sell. We will enter on a pullback to point H. This structure works because there are large players in the market, and large players need liquidity. That is, to make a large sale they need a large number of buy orders in order to "dump" the currency. The zone between H and HH is precisely a zone of high liquidity. Accordingly, there are many people willing to buy here, because they hope for the continuation of the uptrend.
You can enter with a pending order; in that case the sequence is as follows:
- Wait for point LL (the trend break) to form;
- Place a Sell Limit at the H level.
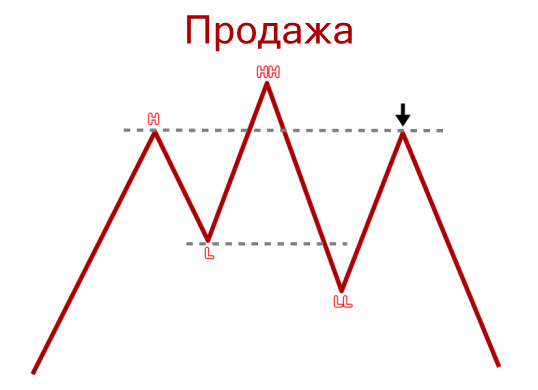 As in the case of sells, in the reverse pattern we have a zone of increased liquidity between points L and LL. There are many people willing to sell here, those who hope for the continuation of the downtrend. Someone bought too early, someone is panicking and closing positions, and many may also have stop losses located in this zone. Accordingly, for a large player this is a good opportunity to buy in, and we enter the market together with him:
- Wait for point HH to form;
- Place a Buy Limit at the L level.
Stop Loss and Take Profit
 Stop loss is placed beyond the extreme point of the zone of increased liquidity. HH in the case of sells, LL in the case of buys. Let me remind you that a stop loss is placed at points where we can say for sure that we are wrong.
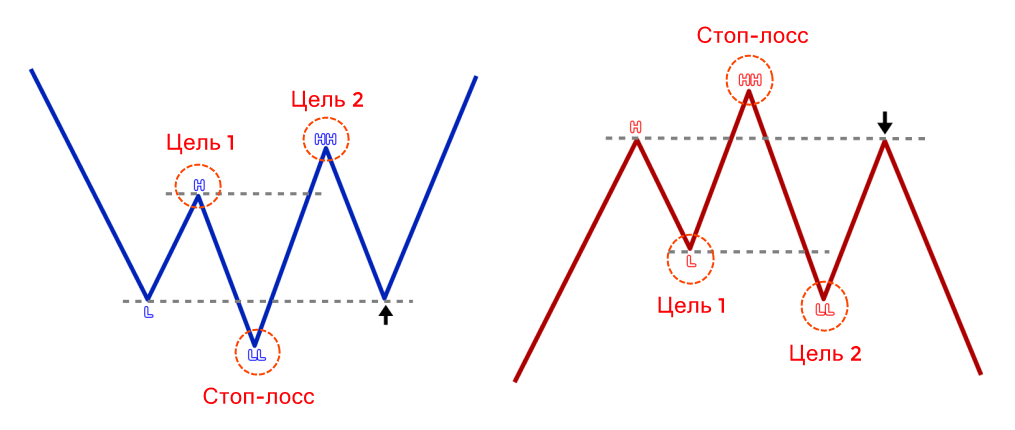 We have two targets. For sells, the first target is at level L, the second at LL. For buys, on the contrary, we take the first profit at H, the second at HH. If the distance between target 1 and 2 is too small, then it makes sense to take only the first target. In other cases, for setting a take profit, you can use the average value between the two points. If desired, you can apply partial position closing after N points.
Trading Recommendations
 It is strongly recommended that the take profit be 2 times larger than the stop loss. Unfortunately, in practice this does not happen often. Try at least to maintain a 1 to 1 ratio. If the take profit ends up smaller than the stop loss, it is better not to enter the trade.
It is worth noting that at first it will be difficult for a beginner to determine all the high-low points by eye, so I recommend installing the ZigZag indicator on the chart (it is included in any terminal by default). The default settings do not need to be changed. The only thing is that the indicator does not always determine the extremes correctly. But overall, ZigZag greatly simplifies the task of finding high-low points.
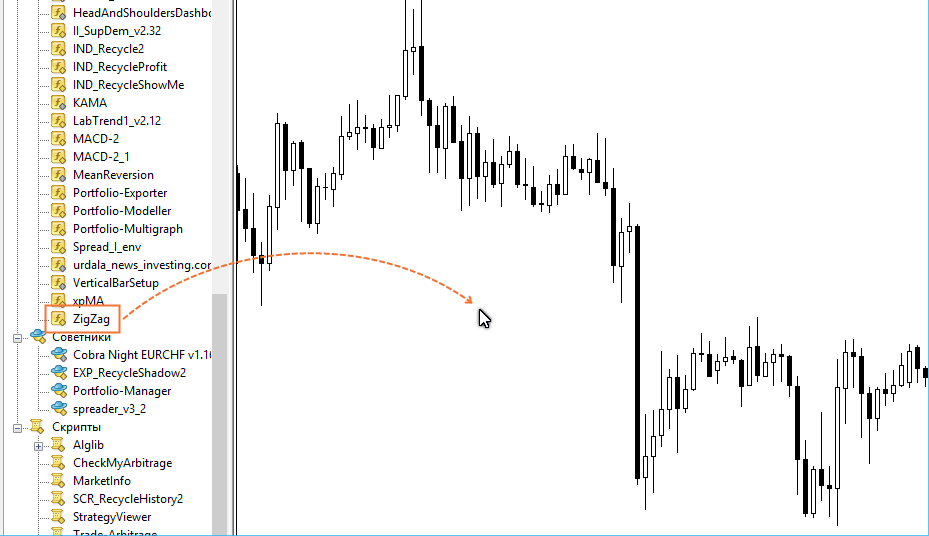 At first, just for yourself, you can mark the high-low points on the chart with text. As an option, you can print the chart and mark the points with a marker. Do not hesitate to do what will later help you better understand the current market situation.
Examples
The entry point can be quite far from the setup that has formed. In this case, we had a certain upward trend. First, we mark the first high, then the low and a higher high, HH. Then, following the ZigZag prompts, we detect a lower low, LL, which is located quite far away. The sell entry point will be located at the H level.
At this level we look for sells. At first glance, the distance is large. But if our structure is preserved, the question is, why not? Accordingly, the price later bounces off the level we marked. We place the stop loss slightly above the extreme point, HH. In this case, the take-to-stop ratio is very good.
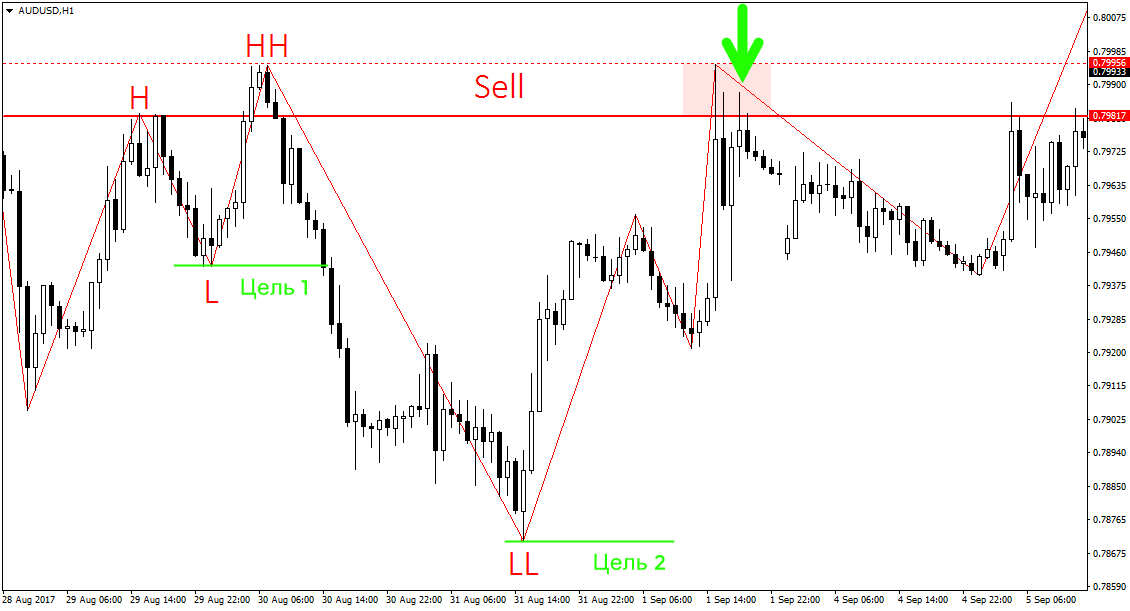 As you have probably already guessed, this strategy also combines the theory of support/resistance levels. Candles with large wicks in the rebound zone show how big players were building positions, destroying buys. Accordingly, the price then went down, reaching our take profit, the low point. The next target is far away, so I would not risk leaving some large part of the position in the hope that price will still reach it.
Let us consider another non-standard example. Here we see the formation of a low, an H correction, and a lower low, LL. Then the price draws a zigzag without going beyond the boundaries of the points we marked. For clarity, do not forget to draw the levels. You can ignore zigzags inside the levels.
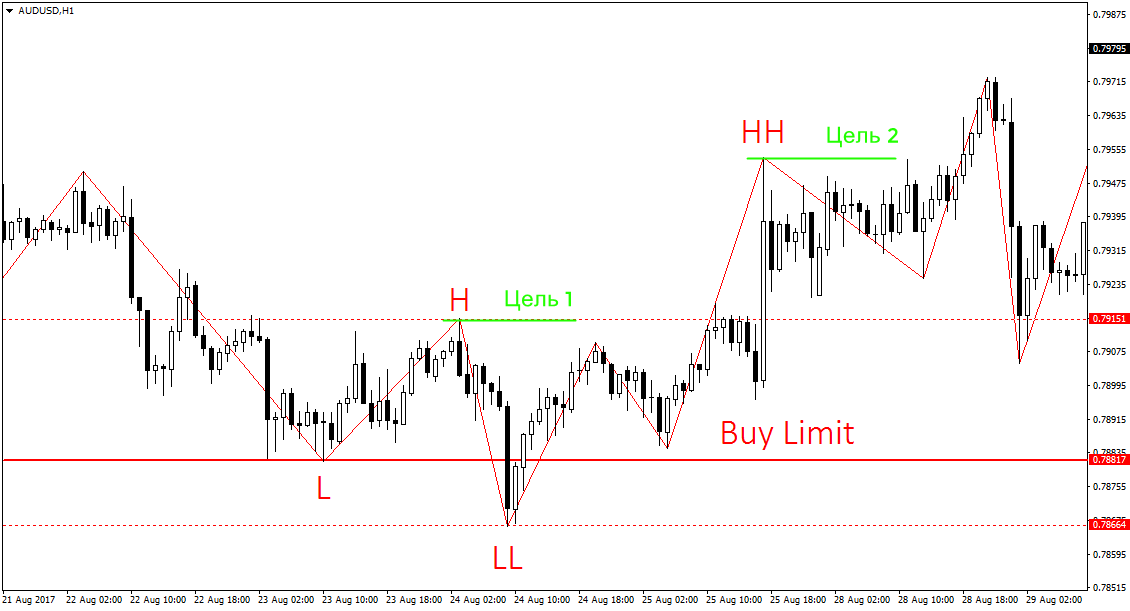 When a higher high, HH, appeared, that is, the structure of the downtrend was broken, we begin to look for buys. In this case, we need a pullback to point L. After point HH is formed, we place a Buy Limit at level L and wait. In this case, the price did not reach our order and went upward.
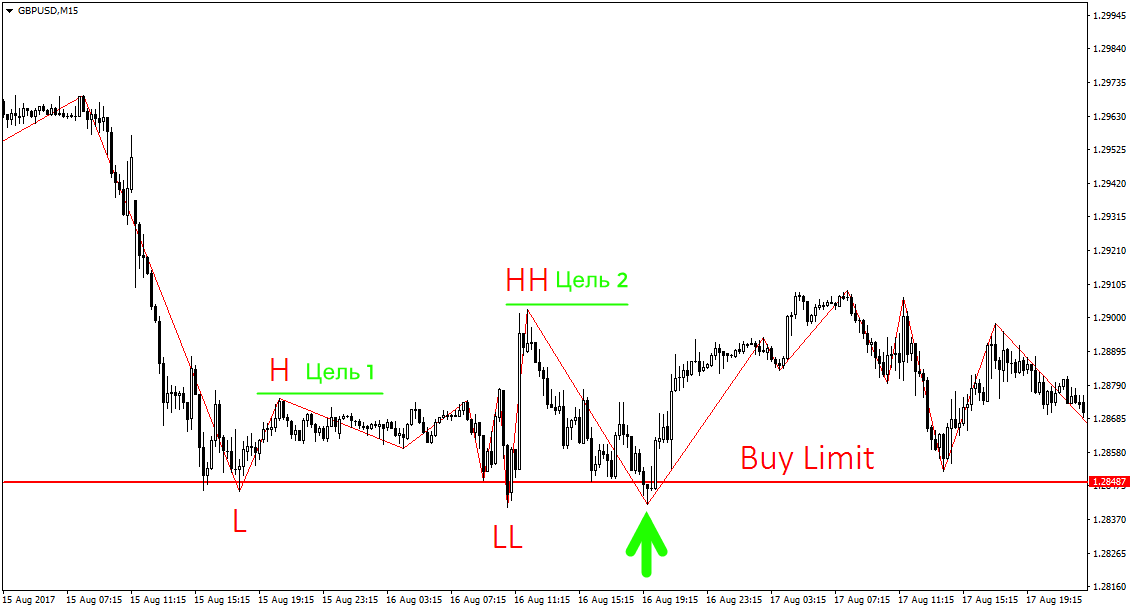
Now let us look at a smaller timeframe, M15. The timeframe is quite low, which means there will be more price noise here, and the level of professionalism required for trading should be higher. Despite this, beginners for some reason persistently try to trade on small TFs.
When working with chaos, it is worth remembering the premise of our strategy, namely that we are looking for a trend break. That is, if there was no obvious trend, then there is nothing to break. Accordingly, before the setup, it is necessary to identify an understandable and obvious trend.
Here, as a premise, we have a clear downtrend. First the price forms a low, then a high, a lower low, and a higher high, a break of the downtrend. After that, we prepare for a possible buy entry at the low level, L. In this example, both targets worked out, H and HH. But again, looking for setups on M15 is quite difficult because of the large amount of price noise.
 Now let us look at a more interesting example on the daily chart. Moreover, an example where our stop loss was triggered. In essence, it is an unfortunate situation: the stop loss was hit, after which the price reversed and reached the first target, unfortunately already without us. And such cases do happen.
Conclusion
 Try not to look for setups in price chaos that are not there, calculating single points. Trade only proper setups, with a good profit-to-risk ratio. Also, the trading system can quite well be used in combination with other strategies. Overall, this is a good springboard for your development as a trader.
Respectfully, Pavel Vlasov TradeLikeaPro.ru
