
The Splendor and Poverty of Heiken Ashi Candles
 Hello, fellow traders! We have covered quite a few forex strategies involving Heiken Ashi candles. I think the time has come to take a closer look at this type of chart, their method of construction, the pros and cons compared with standard Japanese candles, and to clarify on which currency pairs and timeframes Heiken Ashi should be used, and where it should not.
Installation

In the latest versions of the Metatrader 4 terminal, the Heiken Ashi indicator is present by default. If for some reason you do not have it, you can download it from the link at the end of this post. The installation is standard.
Introduction

In this lesson we will touch on the subject of candles. Which are called Heiken Ashi candles (Heiken Ashi).
This is a special type of candle that differs somewhat from the Japanese candles we are used to. Literally, their name is translated from Japanese as "a stripe in the middle" or "a bar in the middle." We will look at what advantages they have over Japanese candles and what disadvantages they have. And in which cases, on which timeframes and currency pairs, they are best applied. Under which conditions their advantages reveal themselves properly and help improve our trading results.
I want you to understand very clearly from this lesson exactly how Heiken Ashi candles are built. If you pay attention, the close-open high and low points of Heiken Ashi candles do not always correspond to those same points on the chart of ordinary Japanese candles.
How are Heiken Ashi candles built?
Let us take, for example, the chart for April 23 at 21:45 and outline one candle with lines, both on the Heiken Ashi chart and on the ordinary Japanese candlestick chart. I outlined the same candle on both charts.
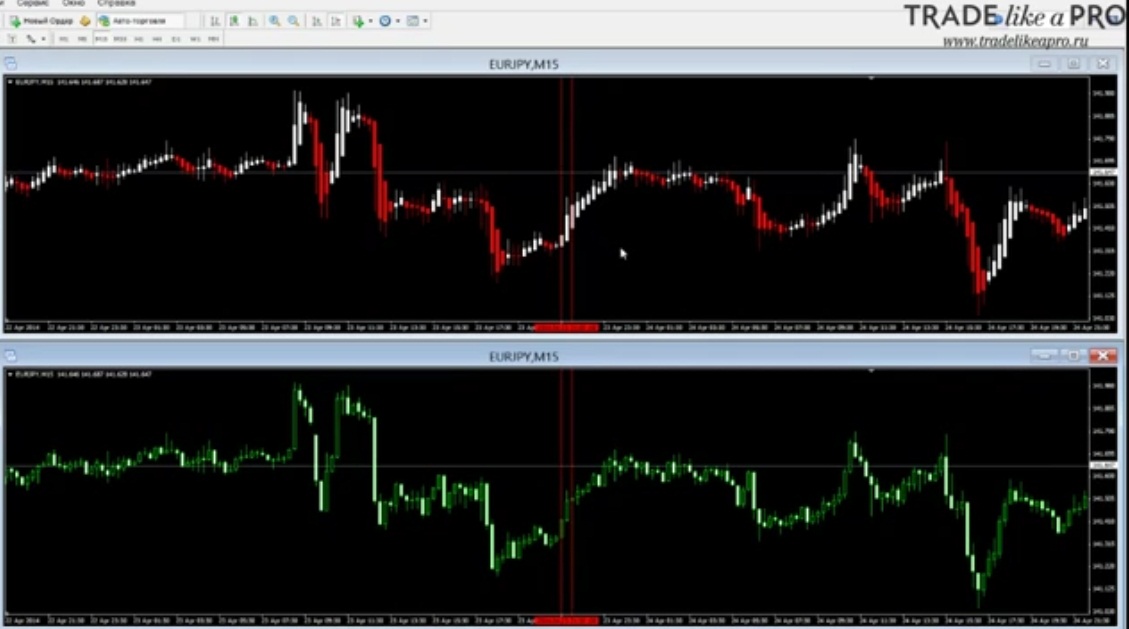
Let us figure out how the open and close, high and low points of Heiken Ashi candles are built. They are built on the basis of Japanese candles, even though we do not see them. Our first point is the opening point. It is built as follows. We add the open and close points of the previous candle and divide by two. They were 141.34 and 141.41. We add these values and divide by 2. We get 141.37.
Now let us check whether our result is correct on the Heiken Ashi chart. We find the opening point of our candle, which we outlined with lines, and it is at the 141.37 level. We did not take into account the third digit after the decimal point. Therefore there may be very slight variations within one point. This is not so important. Now let us calculate the close point. The closing point, naturally, is built on the basis of our current candle. It is finally calculated and does not move once the current candle has closed. It is calculated as follows. We add the opening price and the closing price of the Japanese candle and divide by four. The arithmetic mean of all four points of our candle. And we get 141.46. We look at the chart. The closing point is indeed at the 141.46 level. Everything is correct.
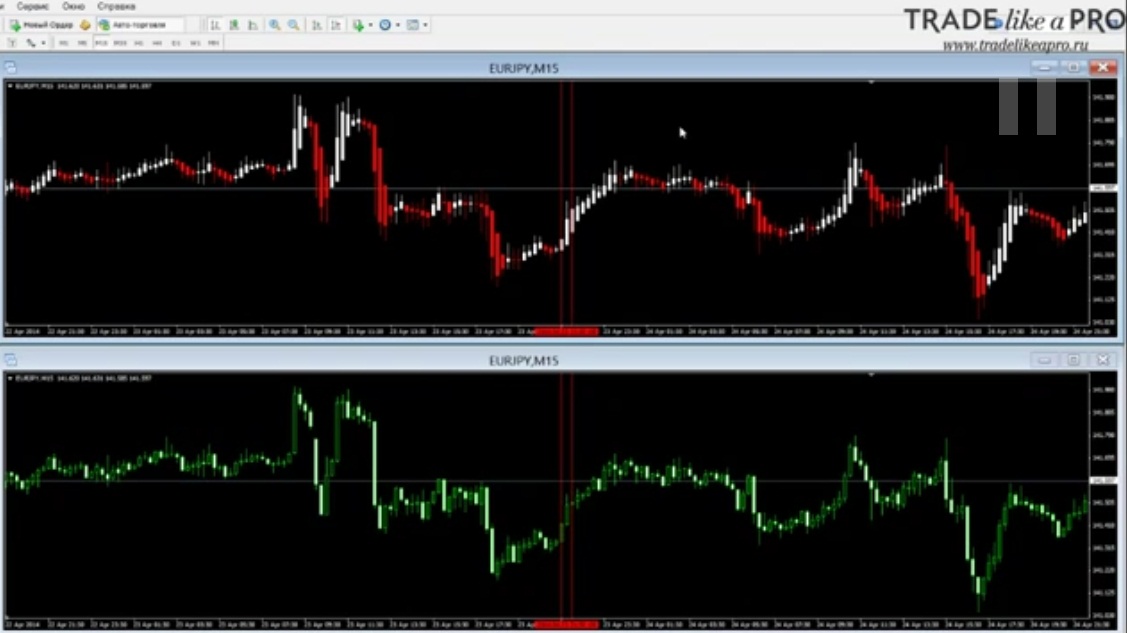
We move on to the high point of the Heiken Ashi candle. It is calculated quite simply: all the points of the Japanese candle are compared. That is, the opening, the closing, the highest point, and whichever of them has the greatest value will be the high point. In our case, they coincide. The high point of the Japanese candle is 141.54 and that of Heiken Ashi is 141.54. To calculate the high point, the highest point of the candle is simply found. For the low point, it is analogous. The lowest point of the candle is found and on its basis the low point is built. But in our case, the lowest point of the Japanese candle is above the opening price of the Heiken Ashi candle. Therefore, here we do not have any tails. There are no lows below the opening price of the Heiken Ashi candle.
That is how the points for building Heiken Ashi candles are calculated. Naturally, all this happens automatically. The indicator does everything for you. But it is necessary to know this in order to understand that if a tail is drawn on Heiken Ashi, it does not necessarily mean that the price went there. It simply shows us in which direction the trend was moving. This should be taken into account and understood.
What are the advantages and disadvantages of Heiken Ashi candles?

From the way Heiken Ashi is built, we can draw the following conclusion: when we have full-bodied candles where, for the most part, the tails are directed to one side, toward the current trend. And on the other side of the candles there are no tails. As in this section. We are dealing with a strong trend.
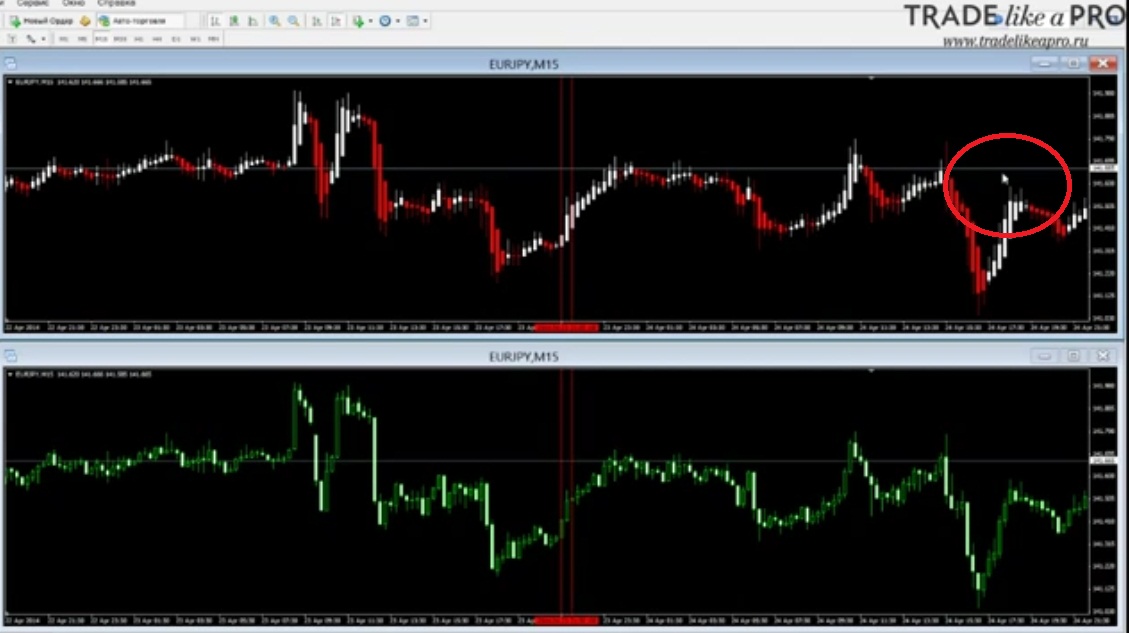
For example: we can observe a "bearish" trend. The candles are of one color, first of all. The tails are directed in the direction of the trend. Long tails. On the opposite side of the tails there are practically none. Only on literally one or two candles. And the candles are full-bodied, with large bodies. This indicates that the trend is strong.
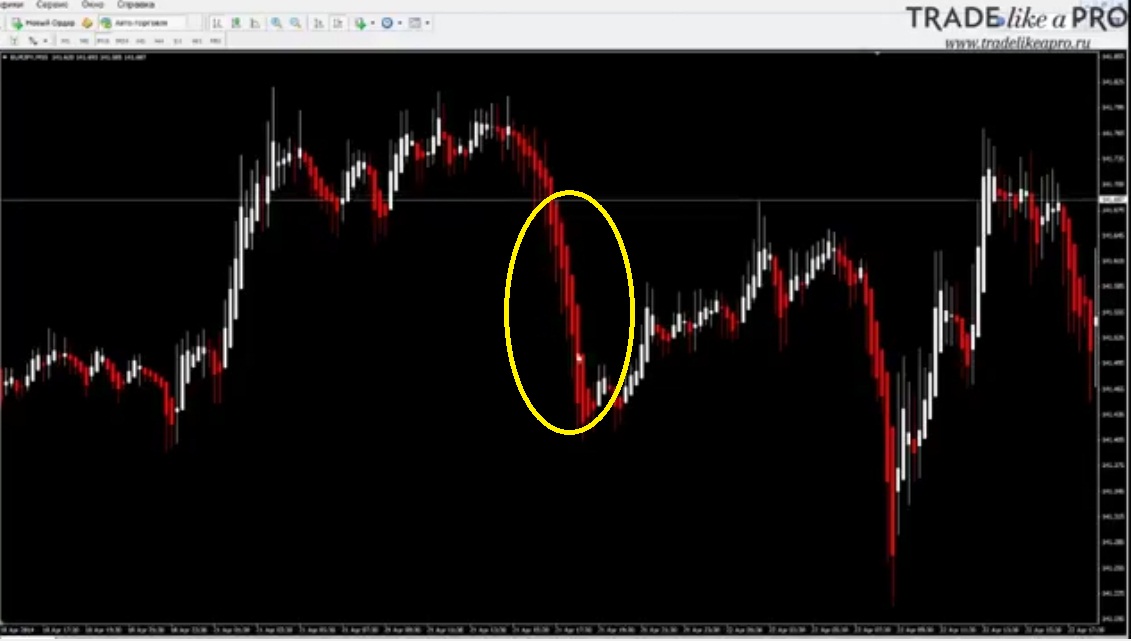
Similarly, for a "bullish" trend. The candles are of one color. In our case, white. Without tails on the opposite side. And with long tails in the direction of the trend. A trend change is usually characterized by candles that look like doji: a small body, long tails on both sides of the candle. And near such candles you can already observe a change of trend. But, of course, not always.
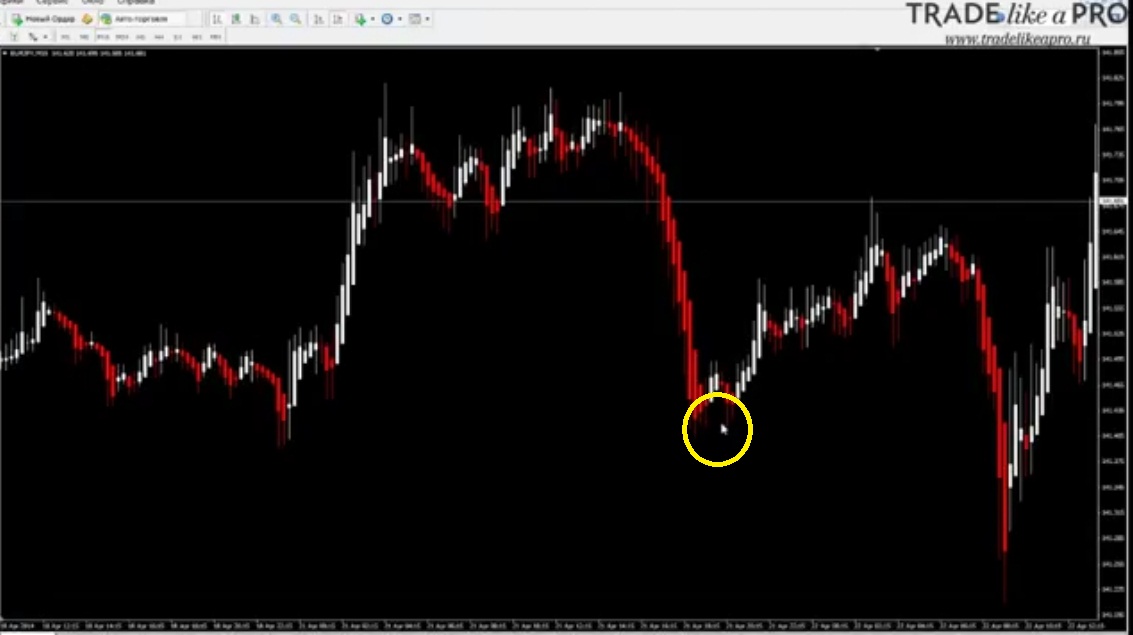
But Heiken Ashi reversal candles, as a rule, resemble doji in shape. Here is a good example: a small body, tails on both sides, and after that, our trend changed from zigzag movement to a bullish trend.
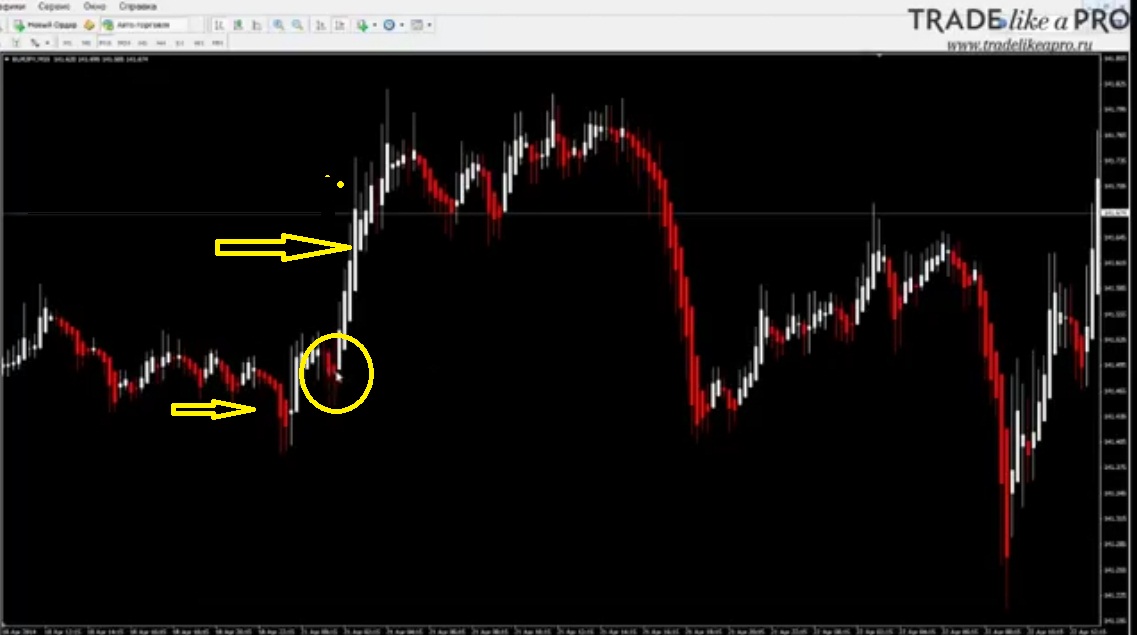
As for trading itself. The thing is that Heiken Ashi candles have a drawback: they lag. Since they average prices, they show us the trend and make it possible to hold onto it as long as possible, but they lag. Therefore, they are well suited for volatile pairs such as GBP/JPY, EUR/JPY, the Canadian CAD/JPY, on small timeframes, up to H-1. Hourly charts are the maximum on which Heiken Ashi can be traded. They are not suitable for trading on H-4 and daily charts. Like any indicator, I do not recommend using Heiken Ashi candles on their own.
Very often, Heiken Ashi candles are combined with the Stochastic Oscillator. The combination with it is very simple: we open a buy position when the Stochastic Oscillator leaves the oversold zone, and at the same time, we see a reversal candle on the Heiken Ashi candles. And simultaneously with this, our Stochastic Oscillator also leaves the oversold zone. Here I placed an upward arrow at that spot.
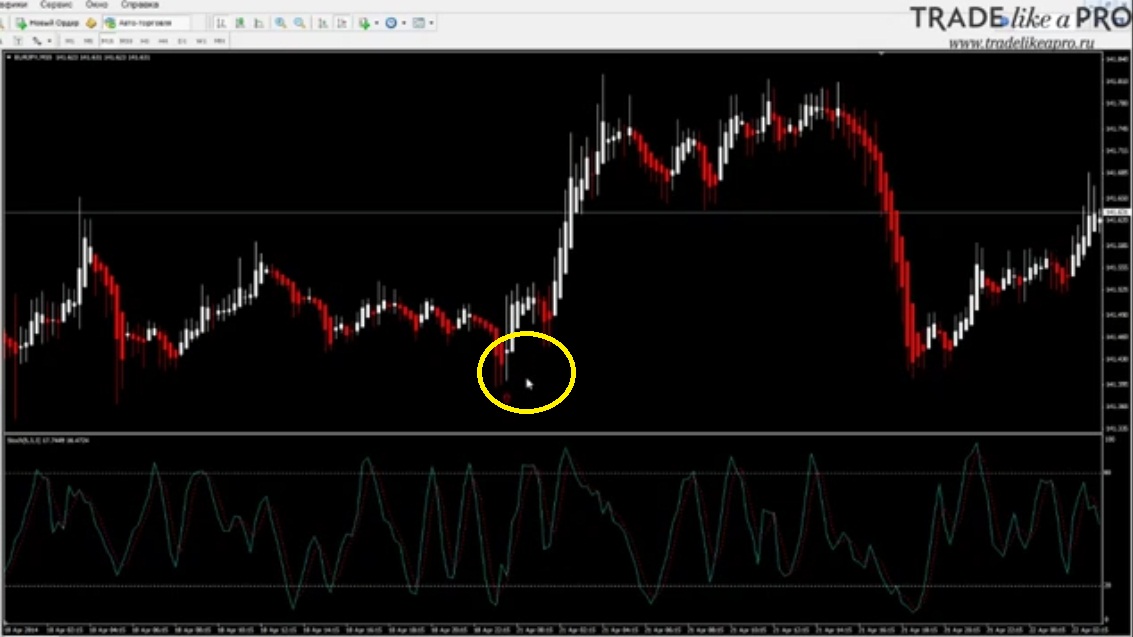
Accordingly, after that we can buy. Similarly, for sells. When this time our Stochastic Oscillator leaves the oversold zone and a clearly expressed doji candle is present on the chart, though not necessarily at the same time. In this case, the Stochastic Oscillator left overbought conditions and a little later, after a couple of candles, a Heiken Ashi doji candle appeared.
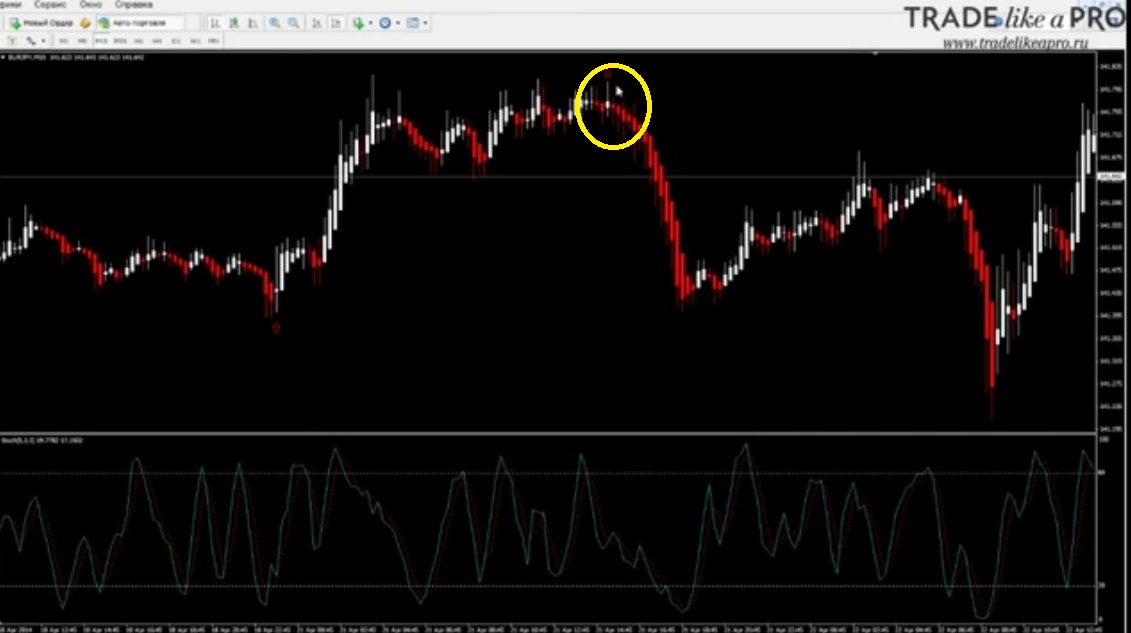
This is a very simple system. Some additional filtering needs to be added here, and you need to get used to it. You need to calculate stop loss and take profit, etc. In this case, I am not showing a strategy, but rather the principles of working with Heiken Ashi candles. We do not apply them alone. Although there are traders who trade exclusively on Heiken Ashi. They are very accustomed to analyzing these candles, and for them all these little tails matter. They are used to listening to the "pulse of the market" through Heiken Ashi candles and trade only on them. Completely without any outside indicators. But, in general, I would advise beginners to combine Heiken Ashi candles with other indicators or elements of technical analysis. Technical analysis elements work on Heiken Ashi candles as well. The same support / resistance lines, patterns, various flags, triangles, etc. Everything works. But the candles are built somewhat differently, and this should not be forgotten.
Heiken Ashi candles give us the advantage that we stay in the trend longer. They are suitable for volatile intraday trading on the pairs: EUR/JPY, CAD/JPY, GBP/JPY. And it is necessary not to forget about the method of calculating estimates. And the timeframes should not be higher than H1. Although, I have encountered some strategies that apply Heiken Ashi candles on H4 and even on D1. But, in general, I do not advise trading on this type of candles above H1.
Description of the Heiken Ashi indicator settings

- Shadow of bear candlestick - color of the bearish candle shadow
- Shadow of bull candlestick - color of the bullish candle shadow
- Bear candlestick body - color of the bearish candle
- Bull candlestick body - color of the bullish candle
Download the Heiken Ashi indicator

Best regards, Pavel
TradeLikeaPro.ru