
The "Head and Shoulders" Pattern + Signal Indicator
 Good afternoon, friends!
Head and Shoulders is a well-known technical analysis pattern that has appeared in many famous books on trading. In essence, the pattern has become an integral part of technical analysis, still remaining relevant today as a tool for forecasting market trends. However, even proven methods require a modern approach, and it would be a sin not to take advantage of all the benefits of the age of automation. Today we will look at the indicator Head & Shoulders Dashboard, an automatic tool for finding patterns across many charts, with flexible settings and alerts for new formations.
Pattern Breakdown

The Head and Shoulders pattern is an established psychological model of market participants that has not changed for decades. Every new quote is the result of a struggle between bulls and bears, but over a relatively long period this struggle takes on a more regular recognizable shape. Since all traders see the same chart, when they identify a familiar formation their behavior becomes synchronized, and the factor of emotions begins to act.
The pattern itself consists of three parts: a high peak in the middle and two smaller peaks on the sides. Thus, the first and second peaks form the "shoulders" of the pattern, while the peak in the middle forms the "head." The support line drawn through the lows of the pattern is also the signal line, and its breakout determines a change in the trend.
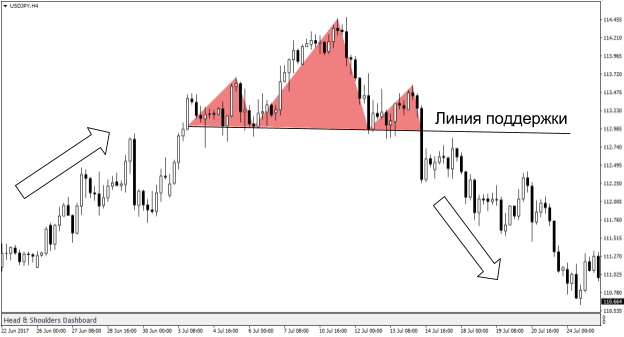 The first small peak and the subsequent drop mean a weakening of the upward impulse, a loss of bullish enthusiasm. However, preserving inertia, the price continues moving upward, forming a higher high. At this stage, the probability of a continuation of the bullish movement still remains. But as soon as the price falls to the level of the previous low, further developments are already predetermined. The bulls make one last attempt to rise, but, as a rule, the price reaches only the nearest resistance level, the level of the first peak, after which all that remains is to wait for the support level to be broken and enter short.
There is also a reverse pattern, the inverted Head and Shoulders, which forms a buy signal. In this case, instead of three peaks we have three lows, with the lowest one in the middle. The pattern signals the completion of a downtrend and the formation of a new direction of movement.
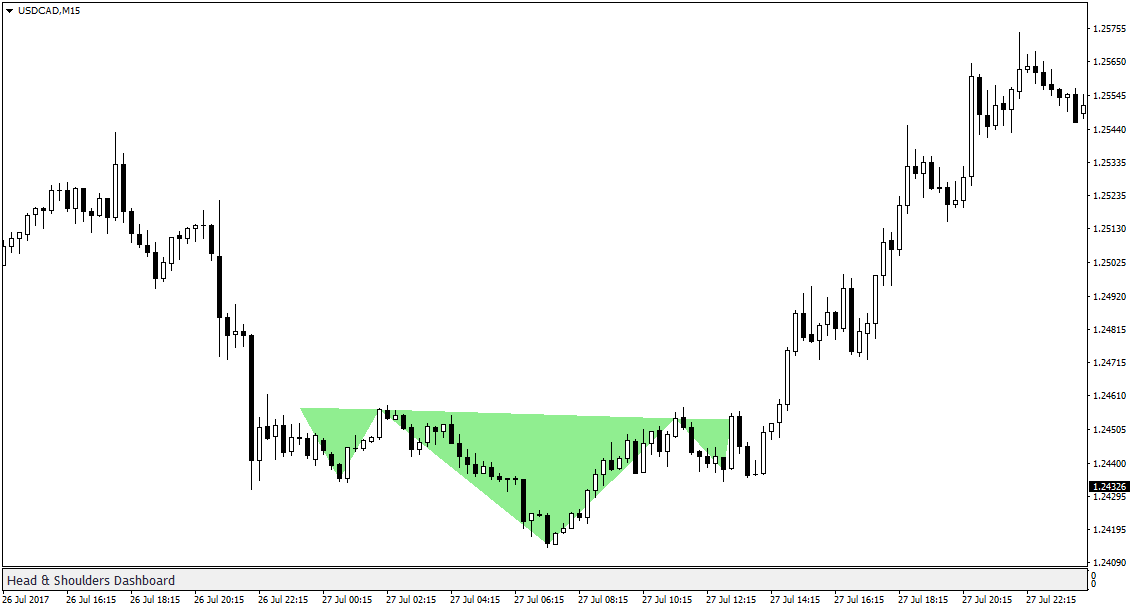
Head & Shoulders Dashboard Indicator

The indicator, which is installed according to the standard instructions, displays a summary table of patterns from all currency pairs and timeframes. Each pattern is marked with the instrument name, timeframe, signal direction (bullish or bearish), formation time (bars ago), and a direct link to the pattern chart. Clicking the button with the instrument name and timeframe will open the chart with the detected pattern.
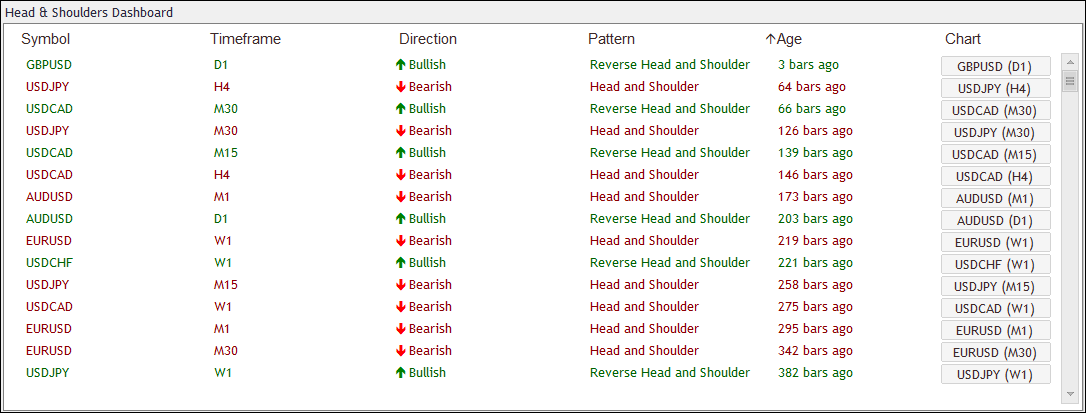 Indicator settings:
- Symbols — a comma-separated list of instruments;
- Is … Timeframe Enabled — enables or disables pattern searching on a specific TF;
- Sort By — which metric to use to sort the found patterns. It is worth noting that sorting is also available by clicking the column header;
- Sort Type — ascending or descending sort;
- Price Proximity Percent — the precision of pattern construction. A higher value will allow more setups to be found;
- Fill Patterns with Color — draw filled patterns;
- Display Head and Shoulder — enable/disable the display of the regular pattern;
- Display Reverse Head and Shoulder — enable/disable the display of the reverse pattern;
- Depth, Deviation, Backstep — parameters of the standard ZigZag indicator;
- Alert Title — the title of the alert;
- Popup Alerts — enable/disable alerts about new signals in the terminal.
Practical Application

Having received a signal about the formation of a new pattern, the first thing we need to determine is the presence of a prolonged one-way movement. This implies a trend lasting more than 100 bars, regardless of the selected timeframe.
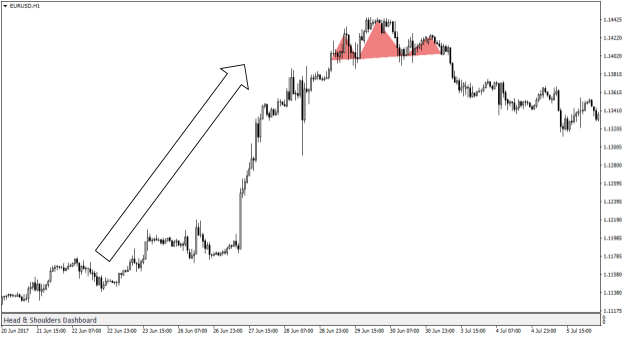 Next, having determined that the trend is upward, we wait for the pattern to form. At the beginning of the formation of the second shoulder, we draw a support line along the swing lows. This will be the signal line, the breaking of which will indicate a price reversal.
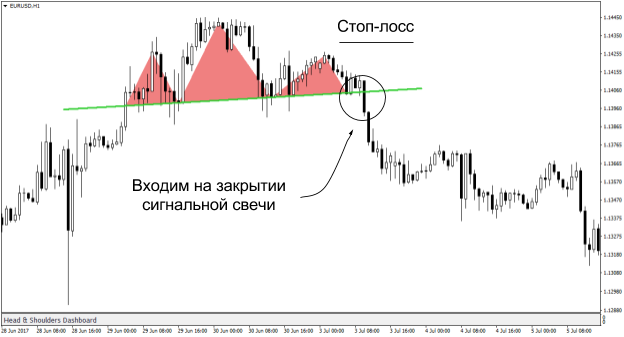 You need to enter the market after the support level is broken. Confirmation comes from the close of a candle beyond the level; at the open of the next one, we place a market order to sell.
Stop loss is placed slightly above the peak of the second shoulder. In some cases, the price may try once again to test the nearest resistance level, and this point must be taken into account when setting the stop.
Conclusion

Head and Shoulders is a time-tested pattern that, when correctly identified, allows you to enter the market at the beginning of a long-term trend. This indicator greatly simplifies the monitoring of Price Action patterns, promptly notifying you of the appearance of a new signal. All that remains is for you to analyze the found setup and make the final decision about entering the trade.
Download the indicator for identifying the "Head and Shoulders" pattern

Best regards, Alexey Vergunov
TradeLikeaPro.ru