
Harmonic Patterns: Simple and Clear
 Hello, dear friends and fellow forex traders!
Many of you have heard of Gartley patterns: butterfly, crab, bat, three drives, shark, cipher, and have also seen and used various technical indicators to find them on charts. Today we will break down what these setups are, how they look on an instrument chart, and, what is important for us, how they can be traded. In conclusion, we will consider the advantages and disadvantages of this method of work.
Beginning
No matter how vividly trading is presented in our minds, in reality we can do very little to influence the market. In the context of forex trading, we do not have such levers at all, and they are concentrated in the hands of large money vaults.
In any case, sooner or later comes an understanding of the market's collective mind and that the market itself tells us how to trade and when; this information is available to everyone, you just need to understand the language.

If we accept the natural nature of the market as the sum of the opinions of all traders, then everything becomes much simpler. Nature, at first glance, is absolutely chaotic. But even in this chaos there is order, reflected in the golden ratio. We make a logical conclusion: if the behavior of society is subject to the golden ratio, then the market can also be explained by the same rule. All that remains for us is to find harmony with the market.
The picture shows a sample of the Common Trader. As we can see, his proportions fully correspond to the proportions of the golden section. Similar mathematical ratios can be traced in other living creatures, plants, and astronomy. Since we cannot deny the fact of the trader's natural origin, then the market also acts according to the laws of nature, and no others.
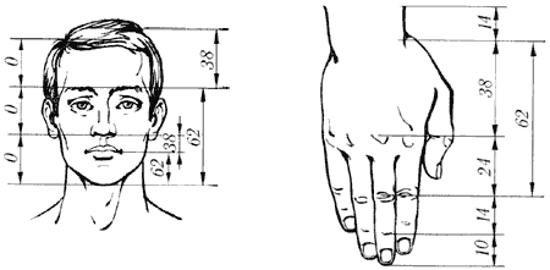
That the market strives for the golden ratio, like the rest of the world around us, is no longer a secret. As is known, the ratio of numbers in the Fibonacci sequence also tends toward this value. Dividing the next number by the previous one in the sequence is approximately equal to 1.618, and the previous by the next is 0.618. In essence, the Fibonacci series describes the entire living world around us; accordingly, the market can also be described by a mathematical sequence.
Of course, the striving for harmony does not cancel out the chaotic nature of the market, but it allows its intentions to be ordered. Therefore, the first step on the path to attaining harmony with the market is accepting its random nature. Regardless of how complex the analysis is, you can never be 100% sure of your forecast: there is always a chance that the price will not go where we expected. Many rely on their "sixth sense," thinking that this gives them the clearest picture of price movement and that any other tools can only interfere with the clarity of the forecast. Naturally, most often this leads to unsystematic trading and losses.

The second step is training patience and getting rid of emotions. You should never become fixated on one individual trade. If we treat each trade as something independent, the fact of a loss will be much harder to accept. Trading in the market is a game of numbers. The effectiveness of any trading system can only be determined on a large sample of trades and never on a single one.
The market itself has no notion of either you or your intentions. Therefore, you should always make an objective assessment of the market and trade in harmony with its current state. That is, wait for the market to speak for itself, rather than trying to impose your own system of rules. There is no need to rush; sometimes the market is more random than usual, for example, during low liquidity or the release of news.
Before developing your own objective picture of the market, you need to accept one single fact: the market is always right, which means there is always a possibility of losing. Only after accepting this idea can you move on to a detailed study of harmonic patterns.
Harmonic Formations

The foundation of harmonic patterns, as well as the trading method itself, was laid by Harold Gartley in his book “Profits in the Stock Market,” where the idea of a five-point pattern, known as the Gartley pattern, was presented. Larry Pesavento refined the pattern by adding Fibonacci ratios and establishing the basic trading rules in his book “Fibonacci Ratios with Pattern Recognition.”
In fact, many minds worked on the theory of harmonic patterns. Probably one of the most famous is Scott Carney, the author of the book “Harmonic Trading.” He is also the author of the Crab, Bat, and Shark patterns. It was in his works that the principles of risk and money management were developed, which, in essence, helped transform harmonic theory into its concrete practical implementation.
Harmonic patterns are a development of the idea of ordinary geometric patterns, using Fibonacci levels to more precisely determine reversal points. The trading process combines visual patterns and a mathematical component. The main task of harmonic patterns is to forecast price movements. So how do they differ from traditional reactive trading methods? At the core, again, lies the golden ratio. By finding patterns of different lengths and sizes and applying Fibonacci ratios to them, we can try to predict the future movement of the market.

Harmonic patterns are a very precise tool that characterizes very specific price movements. There are many patterns in the market, but not every figure that corresponds to Fibonacci proportions is a reliable signal in the harmonic approach. This approach teaches patience, since only ideal setups can guarantee a good result.
Nevertheless, one should not forget that even ideal patterns cannot guarantee 100% success, just like any other tool. All the advantages of the approach are learned only on a large sample of trades. Therefore, it is necessary not only to observe the correct proportions of the figures under consideration exactly, but also always to use proper risk management. The size of the stop loss, as well as the placement of targets, is determined by the pattern itself, but other tools can also be used for confirmation.
At the same time, patterns can overlap each other and thus form more complex structures. This concerns not only harmonic patterns; ordinary geometric figures can also take place in the context of harmonic ones. Such formations can also be used for additional confirmation of the forecast.
Even a single leg can contain several price waves. Therefore, choosing a suitable timeframe is important: not too small and not too large. For example, if you are going to trade on the daily chart, keep in mind that one pattern can occupy quite a large area, and its formation can take months. At the same time, thanks to the fractal nature of the market, patterns can be applied to any timeframe, from the smallest to the largest.
Pattern Identification

Determining harmonic patterns by eye is quite difficult and beyond the ability of every beginner. The main harmonic patterns (Gartley, Butterfly, Crab, Bat, Shark, and Cipher) are based on 5 key points, including the ABC or ABCD figure. Price fluctuations within the figures are always interrelated and based on certain harmonic ratios.
Each pattern to one degree or another resembles the letters M or W in shape. Five-point patterns begin forming at point X, followed by the impulse wave XA, after which the price makes a correction, forming the AB leg. This is followed by the BC leg in a direction parallel to the initial impulse. The pattern is completed by the corrective CD leg.
Harmonic relationships between the waves determine whether a wave is corrective or expanding; the uniqueness of individual figures lies in these relationships. At the same time, all patterns are united by the presence of the ABC figure. Therefore, it is enough to understand the construction principle of just one of the figures, after which all the others will be much easier to identify. At first, you can use automated tools: there are many indicators freely available that recognize patterns on the chart. But keep in mind that such indicators may identify far from all patterns, and the final result is far from the best quality.
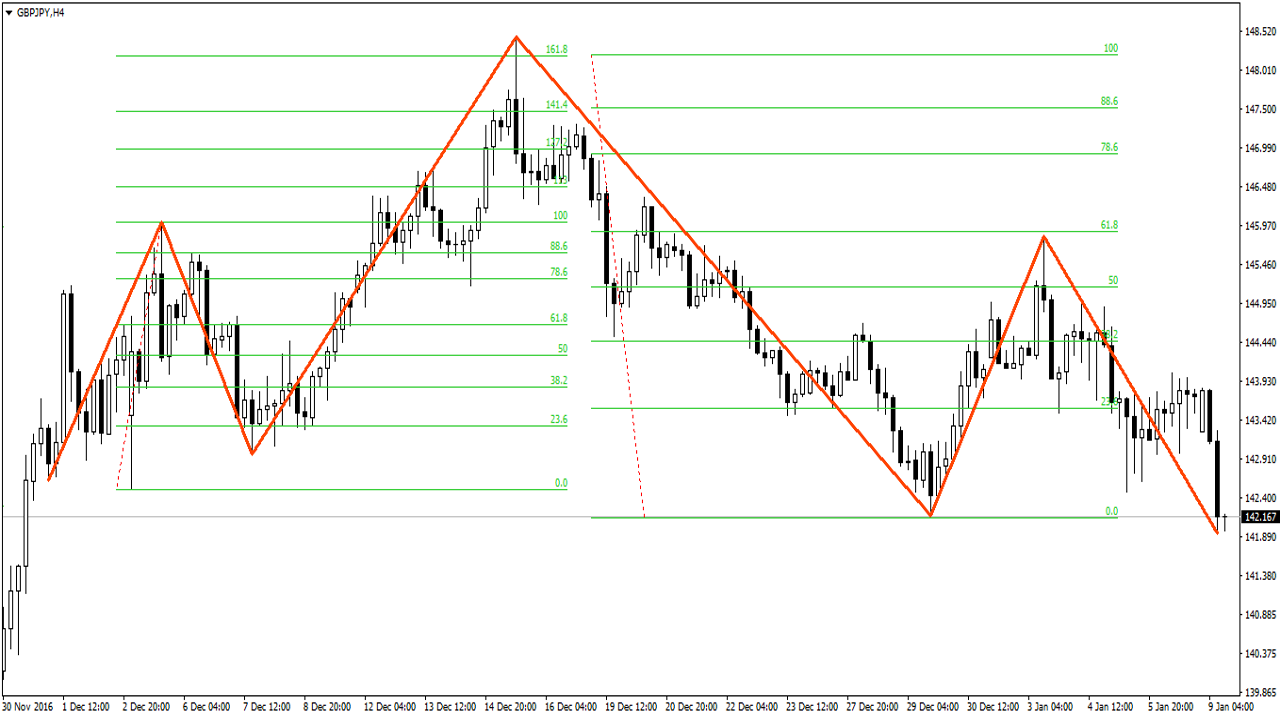
Head and shoulders is one of the earliest harmonic patterns. Under the harmonic approach, the result should be a symmetrical formation with the head at the 1.618 level of the left shoulder and the right shoulder at the 0.618 level of the head. Such a precise structure makes it easy to determine the moment the pattern is completed and the point of entry into the market.
Preparatory Work

The main tool for identifying harmonic patterns is the Fibonacci grid. For this, you can use almost any modern platform. We will focus on MetaTrader.
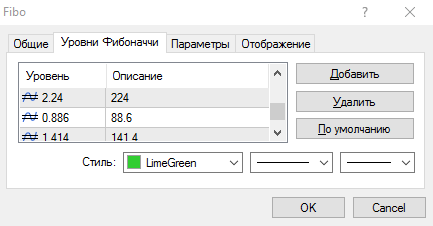
So, to begin with, you need to add the following coefficients to the standard MetaTrader Fibonacci grid: 0.786, 0.886, 1.13, 1.272, 1.414, 2.0, 2.24, 3.618. As you noticed, the Fibonacci grid does not consist of a pure Fibonacci sequence, but of derived coefficients. The coefficients are calculated as follows:
- 0.382 = 1 - 0.618
- 0.786 = the square root of 0.618
- 0.886 = the fourth root of 0.618 or the square root of 0.786
- 1.13 = the fourth root of 1.618 or the square root of 1.27
- 1.27 = the root of 1.618
- 1.41 = the root of 2
- 2 = 1 + 1
- 2.24 = the root of 5
- 2.618 = the square of 1.618
- 3.618 = 1 + 2.618
To add additional coefficients, place the Fibo object on the chart. This can be done through the menu Insert - Objects - Fibonacci Lines. Select the object with a double click and choose Properties from the context menu.
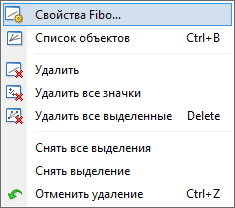
Now add the required levels through Add. The first field specifies the level itself, while the second contains the text description of the level displayed on the chart. All added values will be saved even after the object is removed from the chart, so you will be able to reuse the saved markup for new patterns.
AB=CD
The ABCD pattern is the simplest harmonic model, consisting of only three legs: AB, BC, and CD. Nevertheless, the pattern is an important building block on the path to understanding the principles of constructing harmonic formations and, moreover, it is part of most of them.
ABCD is a reversal pattern that foreshadows a change in the market trend. In other words, the formation helps predict when price finishes rising and is preparing to fall, or conversely, finishes falling and is preparing to rise.
The key feature of the pattern is the symmetry of the AB and CD legs. Outwardly, such a formation resembles the English letter N.
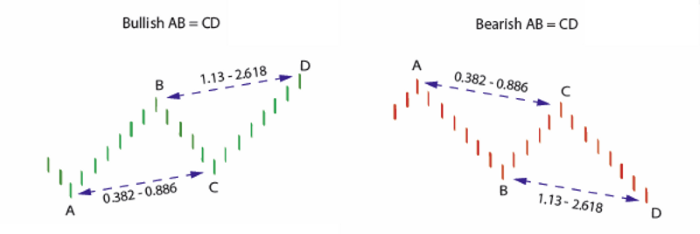
The pattern has two varieties: bullish and bearish. In the first case, we are dealing with an upward movement and a sell trade. A bearish pattern has two descending lows and highs, after which a buy trade is opened.
So, the formation begins with a rise or fall in price along segment AB. Segment BC usually represents a sharp correction, the size of which should fit within 38.2% - 88.6% of AB. Ideally, the size of the correction should be from 61.8% to 78.6%.
At point C, price reverses and continues moving parallel to segment AB. At the same time, point D should lie within 113% - 261.8% of leg BC.
The main rule is to maintain the symmetry of the pattern. Ideally, the length of leg CD should fully correspond to the length of AB. That is, correspondence is meant both in time and in price.
In practice, however, all kinds of pattern variations occur. Still, a good rule is to maintain the corresponding correction sizes of AB and CD, since trading an asymmetrical pattern is much more difficult.
Thus, if correction BC corresponds, for example, to 61.8% of leg AB, then leg CD should correspond to a 161.8% extension of BC. A 78.6% correction, in turn, should correspond to a 127.2% extension. By the same analogy, an 88.6% correction will correspond to a 113% extension of BC. 38.2% will equal the maximum extension of 261.8%. You need to enter the market at point D, or a little earlier.
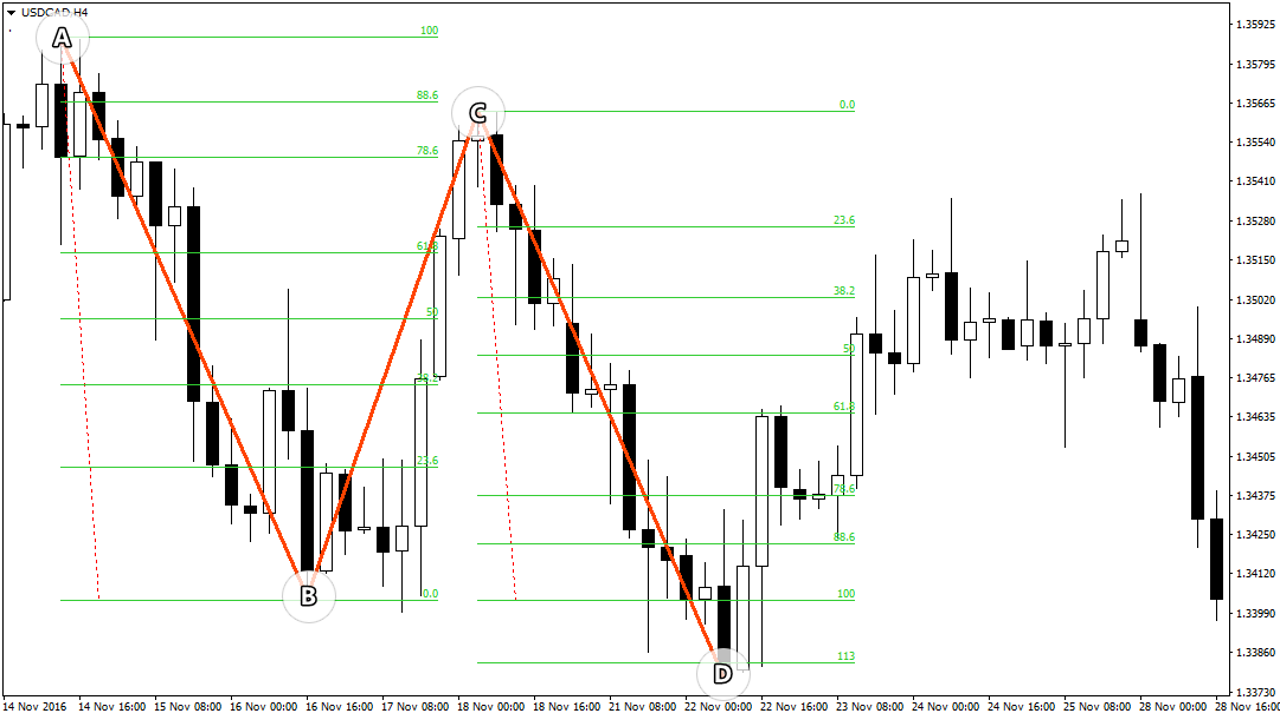
As a minimum target, we use a 38.2% Fibonacci extension from points AD. The second target is at 61.8%. As more aggressive targets, you can use the points of the pattern itself: A and C.
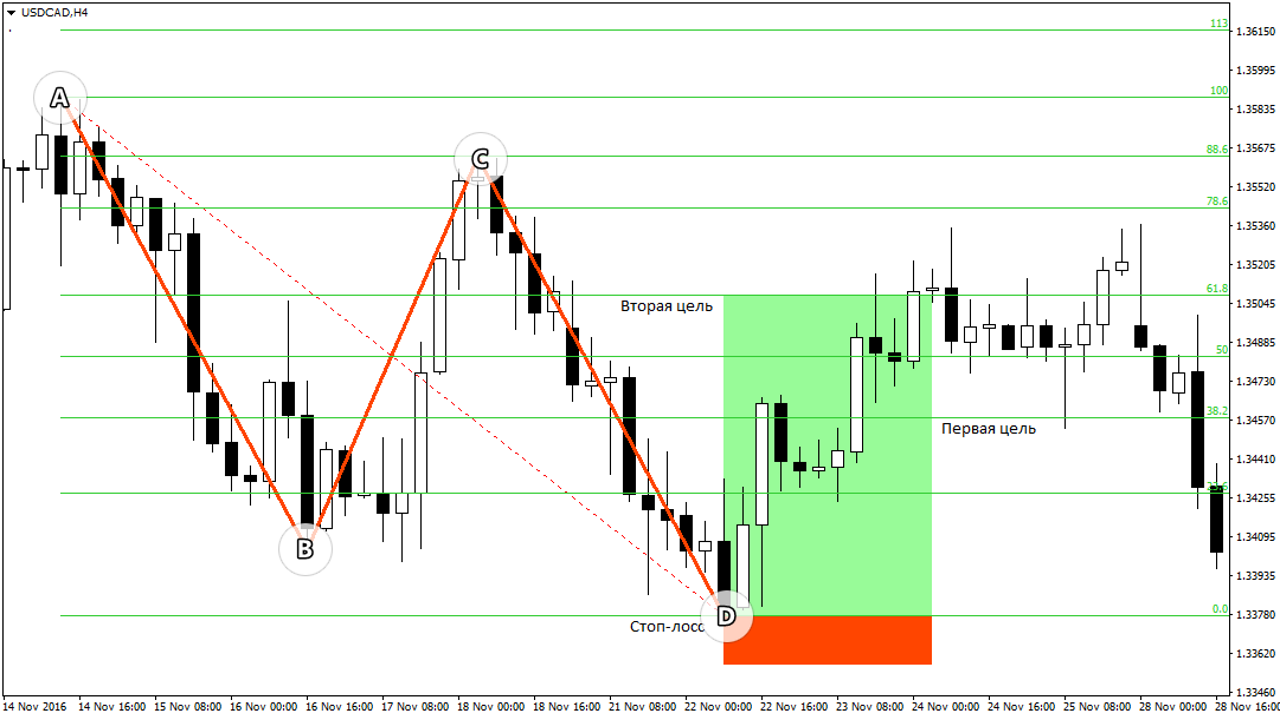
We place the stop loss not far beyond point D. A good rule is to set the trade risk at a ratio of 1 to 10. That is, we risk one tenth of the potential profit. But it should be taken into account that the pattern does not always play out perfectly, so the stop must be at a sufficient distance from the price. Here you need to find a certain balance: the stop should be short, but not too short.
This is the whole point of harmonic patterns: we look for an ideal formation that creates a proper proportion and possesses natural symmetry. Then, if the pattern is formed correctly, we can count on a large profit. If the proportions are violated, the trade should be exited as quickly as possible.

How to trade:
- First, visually identify the zigzag ABC movement on the chart;
- Next, measure the size of correction BC, which should be from 38.2% to 88.6%;
- Determine the location of point D. To do this, stretch the Fibonacci grid from point C to point B in such a way that level B corresponds to correction BC, for example 88.6%. Point D will be at the 100% level, forming a fully symmetrical pattern;
- Next, stretch the grid from point A to D. At the 38.2% and 61.8% levels will be the first and second targets, respectively;
- At point D, place a pending order with a stop-loss-to-profit ratio of 1 to 10.
Gartley
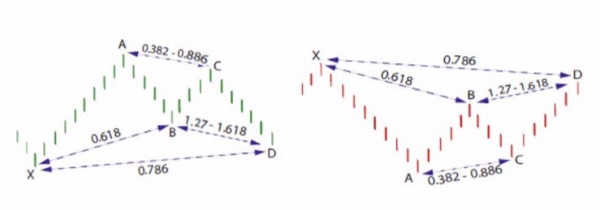
The Gartley pattern is a corrective formation that marks the continuation of an existing trend. The main trend, in this case, temporarily changes its direction before returning to the movement it started with. In other words, a temporary correction is observed in the form of an ABCD pattern. Entry into the trade is made at point D.
The first stage is the visual identification of the formation on the chart. A bullish pattern resembles the letter M, while a bearish one looks like an inverted M, or W. As soon as we notice a suitable-looking formation, we begin checking what pattern, in fact, we have found.
At first, you can simplify the task a bit by adding a ZigZag with a small step to the chart. This will help visually highlight important extremes on the chart, after which all that remains is to mark the required pattern.
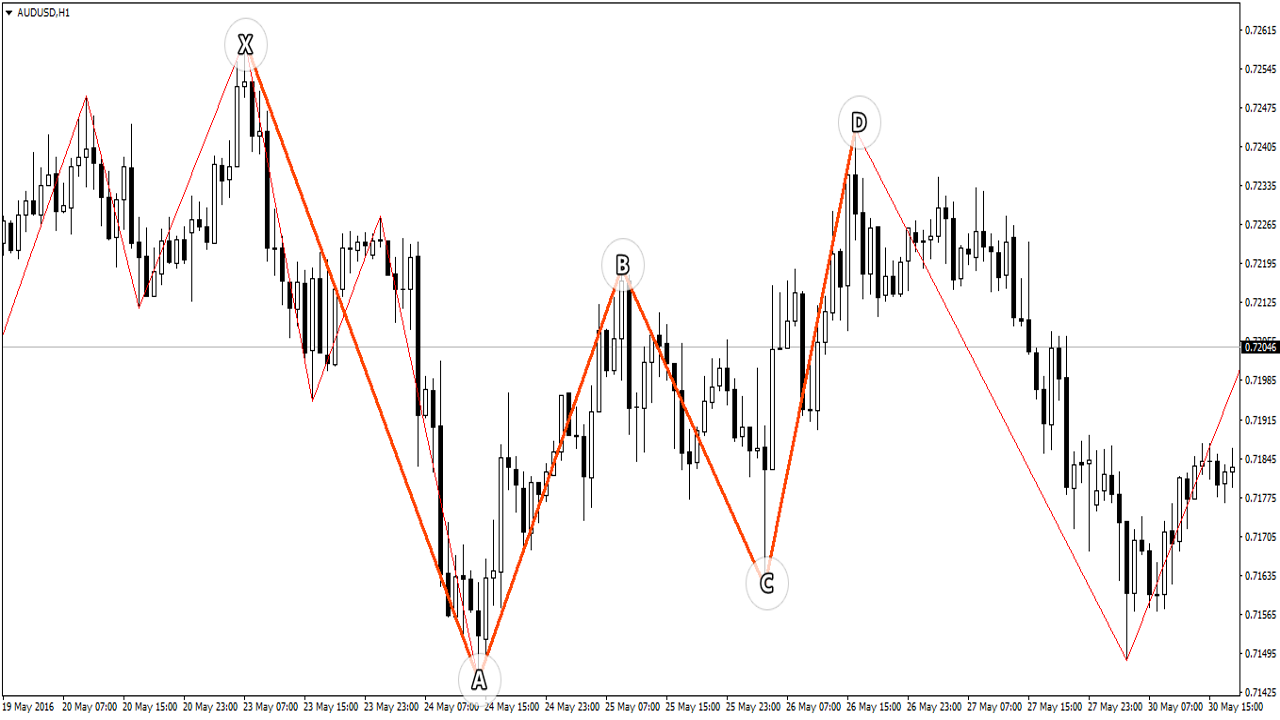
So, we mark a potential pattern on the chart and measure the A-B leg. Overall, the Gartley pattern resembles the AB=CD figure, except for the additional XA leg. XA is the longest leg of the pattern, directed downward in a bearish formation and upward in a bullish one.
After that, price should make a correction, covering some distance from the XA leg. In this case, we have a clean 61.8% correction. This means that it is either a Gartley or a Crab, since all the other patterns have either a larger or a smaller correction size. At the same time, the AB leg should never exceed point X, otherwise the pattern can be considered invalid.
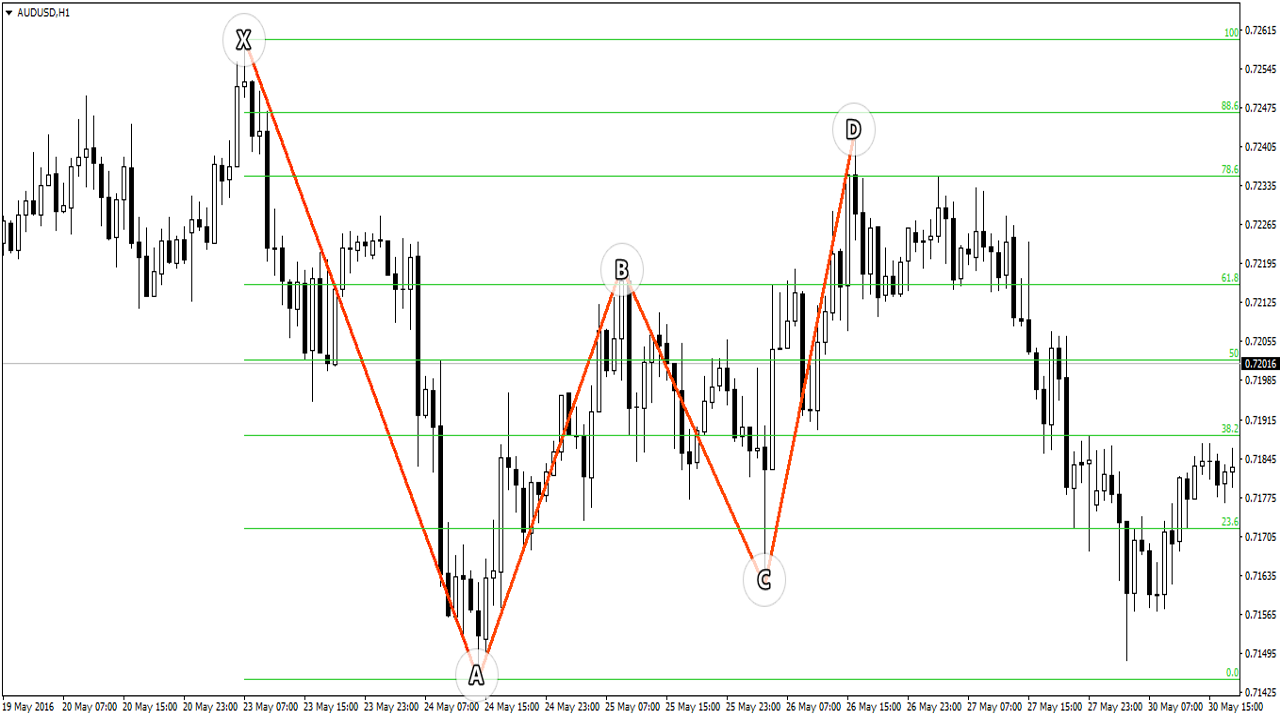
Next, we mark the projection zones for points C and D. Point C should be within 38.2% - 88.6% of segment AB. Here price changes direction again and partially offsets the AB move. Ideally, the range narrows to 61.8% - 78.6%.
Point D should correspond to 127% - 161.8% of BC. At the same time, the 78.6% correction level of the XA leg should fall within the projection of point D, otherwise the pattern cannot be considered valid. Also, point D should never go beyond point X. That is why it is customary to place a stop loss at point X.
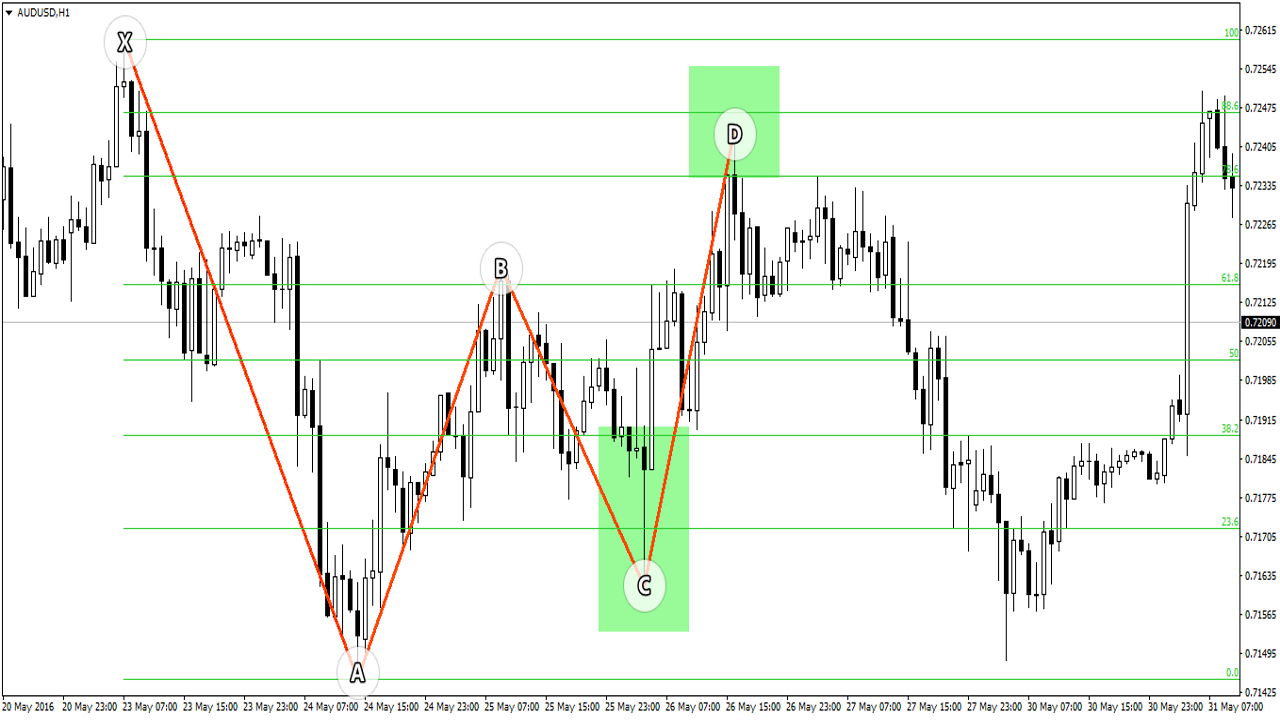
In this case, the projection zone from points BC fits exactly into the retracement from XA, which means we are dealing with a valid Gartley pattern. Its bearish variation is shown on the chart, which indicates a continuation of the downward trend. This means we will enter with a sell.
Next, we stretch the grid from points AD. The nearest target is at the 38.2% level, the farther target is at 61.8%. The first target can be used for conservative trading or for partial profit-taking. Also, the pattern points themselves, specifically points A and C, can be used as targets, but price does not always reach these targets. It is also good to take into account important trading levels, if there are any nearby. We place the stop loss slightly above point X.
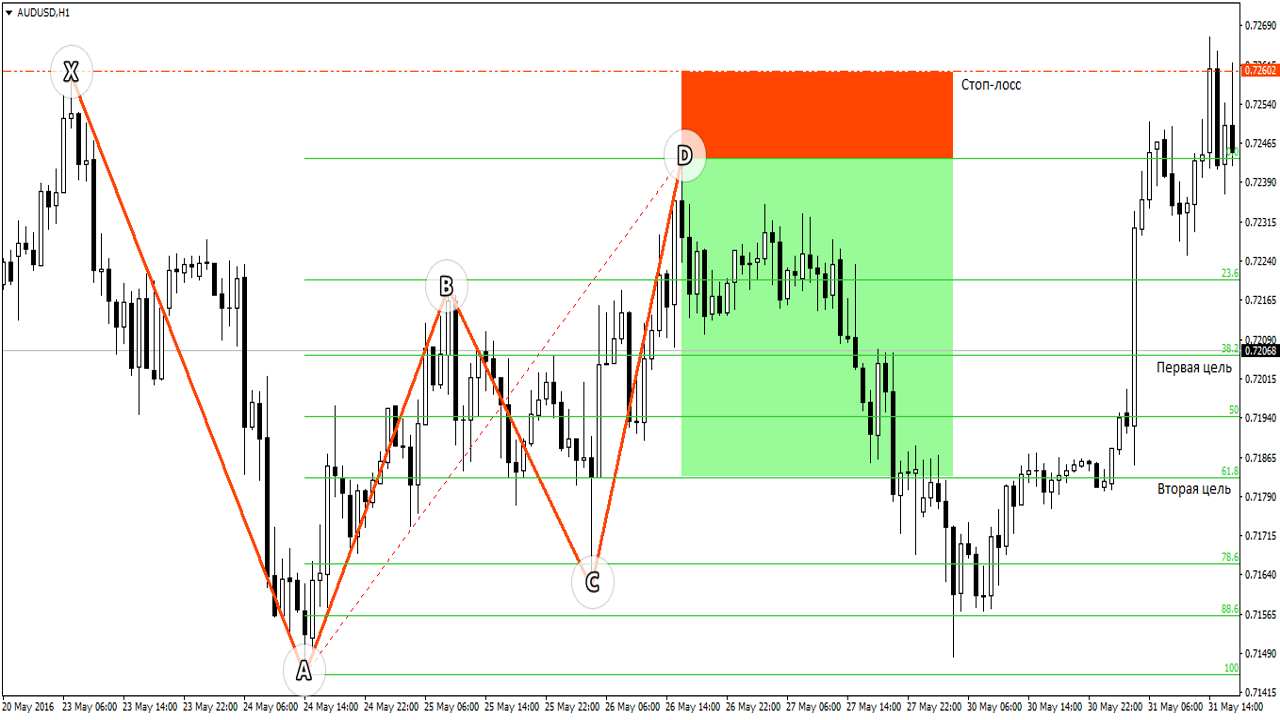
How to trade:
- We identify a substantial movement downward or upward, depending on the direction of the pattern;
- Movement AB should correspond to 61.8% of XA;
- Correction BC should be within 38.2% - 88.6% of AB;
- Finally, segment CD should correspond to 127% - 161.8% of BC. At the same time, point D should be at the 78.6% level of XA - this is the entry point;
- We enter with a pending order at point D, placing the stop loss beyond point X.
Butterfly

Butterfly is a reversal pattern that allows entering the market at major extremes within the selected timeframe. Similar to the other patterns, the butterfly has two varieties - bullish and bearish.
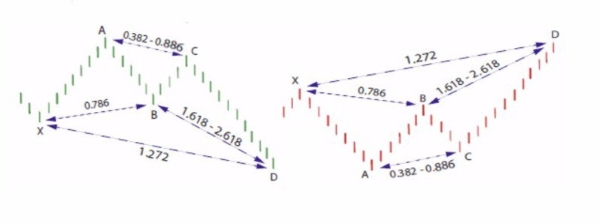
This is one of the most popular harmonic patterns. First of all, this is due to its high rate of completion. Overall, the figure is very similar to the Gartley and the Bat, but it has its own features.
In the case of a bearish pattern, the first thing we look for is a sharp drop from point X to point A. For a bullish pattern, everything is the opposite - we look for a sharp rise in price. If you still have difficulties recognizing waves, you can add ZigZag to the chart.
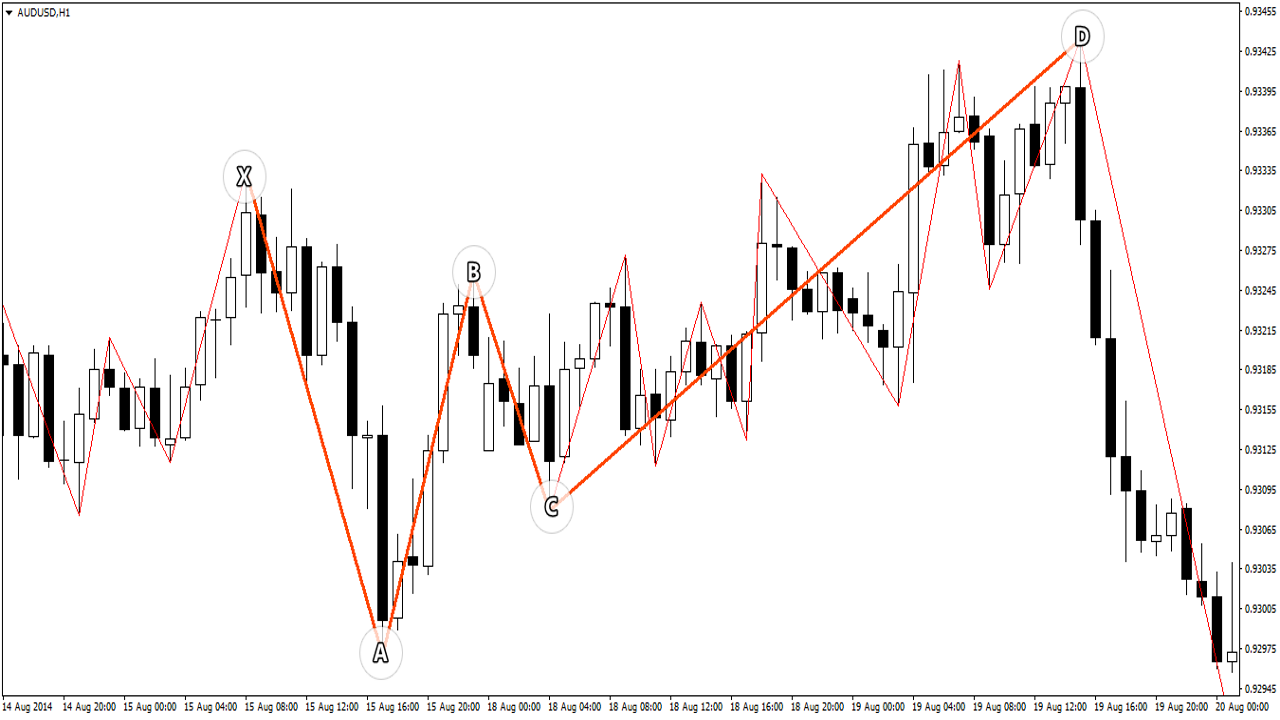
At point A, price changes its direction and continues moving until 78.6% of the XA move.
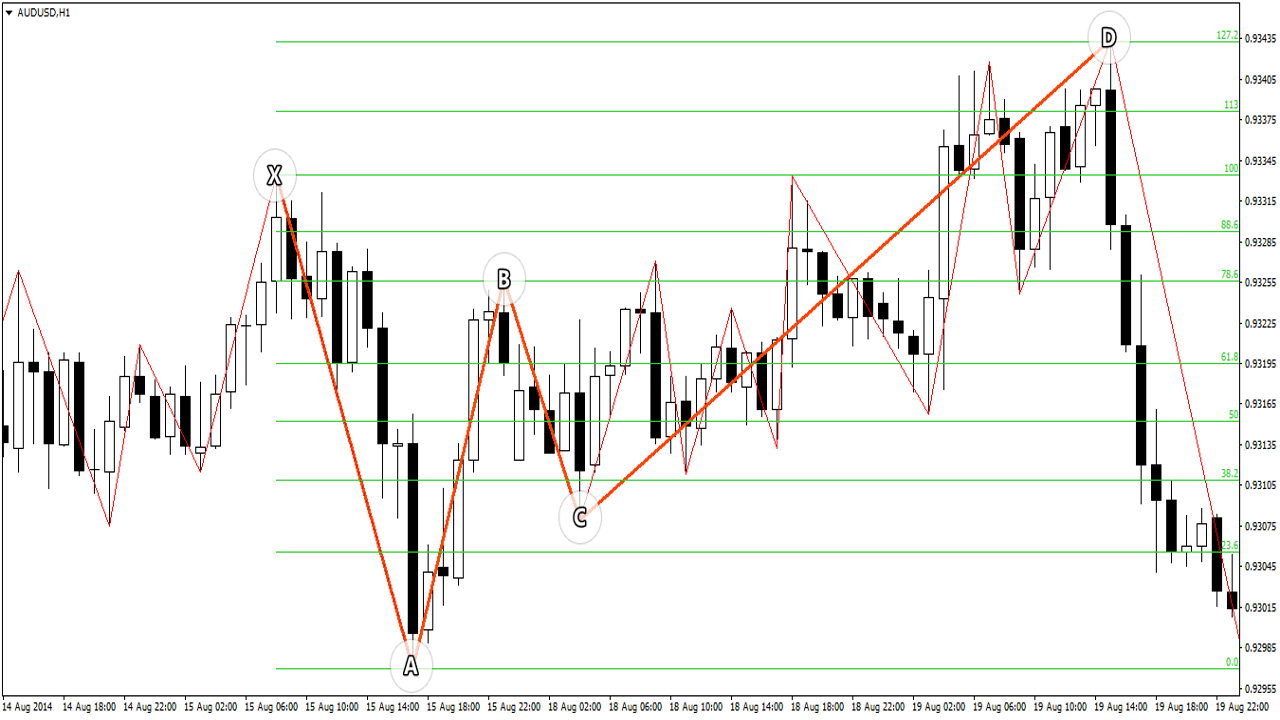
A correctly formed pattern has points C and D located in the green zones. Specifically, the BC correction should amount to 38.2% to 88.6% of the AB move. CD is the final and most important movement within this pattern. First, point D should be within the 161.8% - 261.8% extension of the BC move (green zone). Second, point D should not exceed 127.2% of the first leg - XA. At the same time, this level should also be located in the green zone. The chart shows an almost ideal situation.
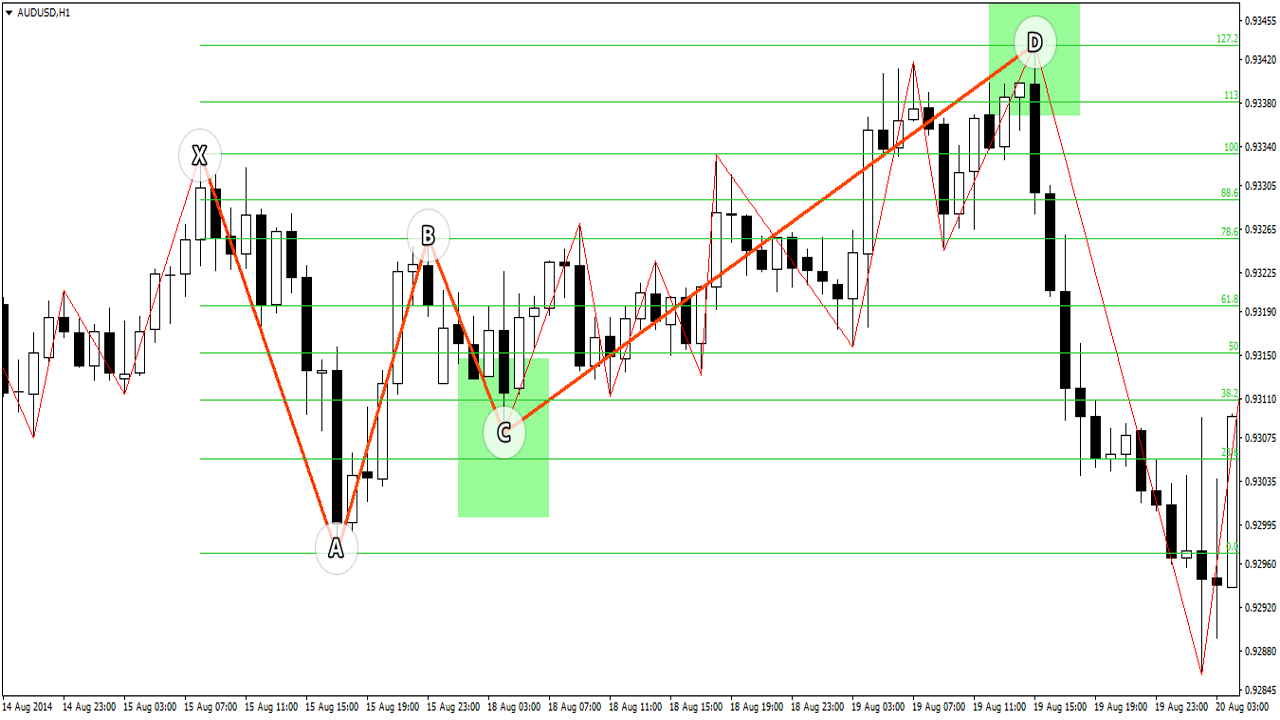
We place the stop loss beyond the 161.8% level. The first target is at point B. The second target is at point A.
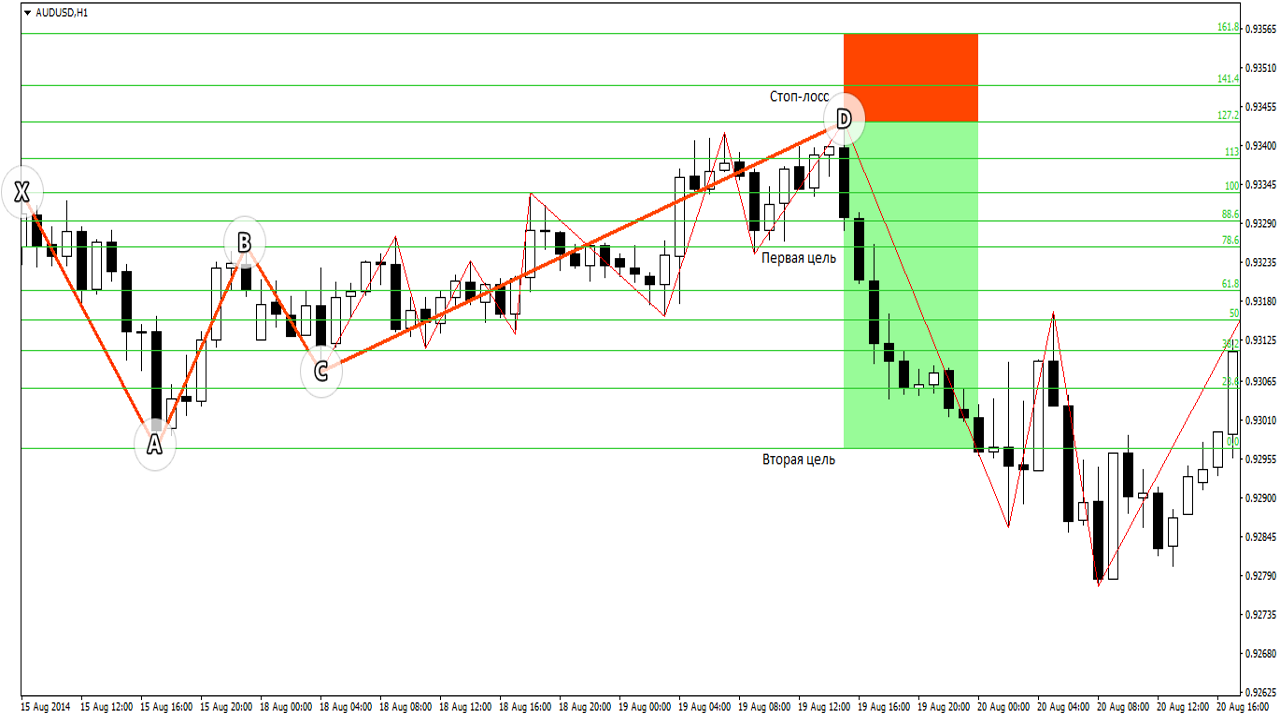
How to trade:
- We identify the turning point of the previous trend that forms the X-A-B figure;
- We check that the AB correction corresponds to 78.6% of XA;
- The next correction should fit within 38.2% - 88.6% of AB;
- Next, we mark the 127.2% extension of the XA move, where point D will ultimately be located. At the same time, point D should fit within the 161.8% - 261.8% zone of the BC leg;
- We place an order at 127.2% of XA, with a stop loss at 1/10 of the farther target.
Crab

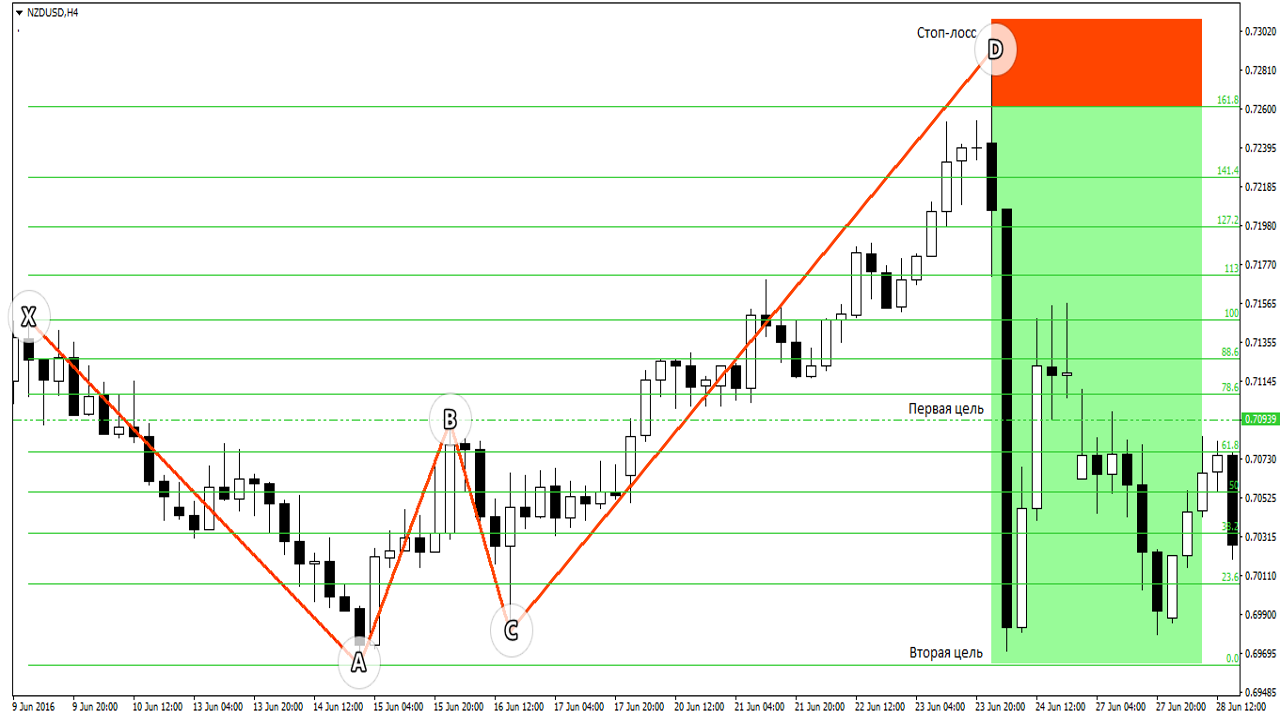
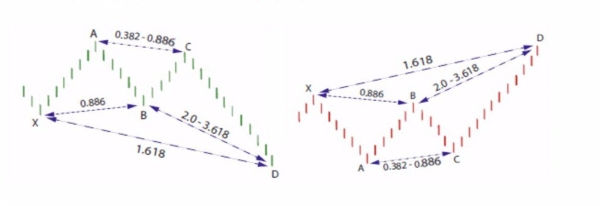
Overall, the Crab is very reminiscent of the Butterfly, being practically its twin brother. It consists of four legs, including the ABCD pattern. Like the Butterfly, the pattern is a reversal one, marking the completion of the current trend. The main difference is the elongated CD leg. If the Butterfly ends at the 127.2% extension of the initial XA move, then the Crab has an extension of the final leg to 161.8%.
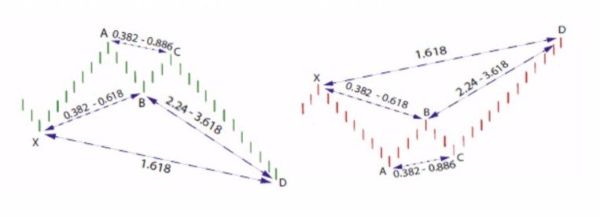
On the chart, the pattern can be identified by the characteristically long CD leg. A bearish pattern begins to form with the XA move, where it changes direction at point A. The AB correction should be within 38.2% - 61.8% of XA.
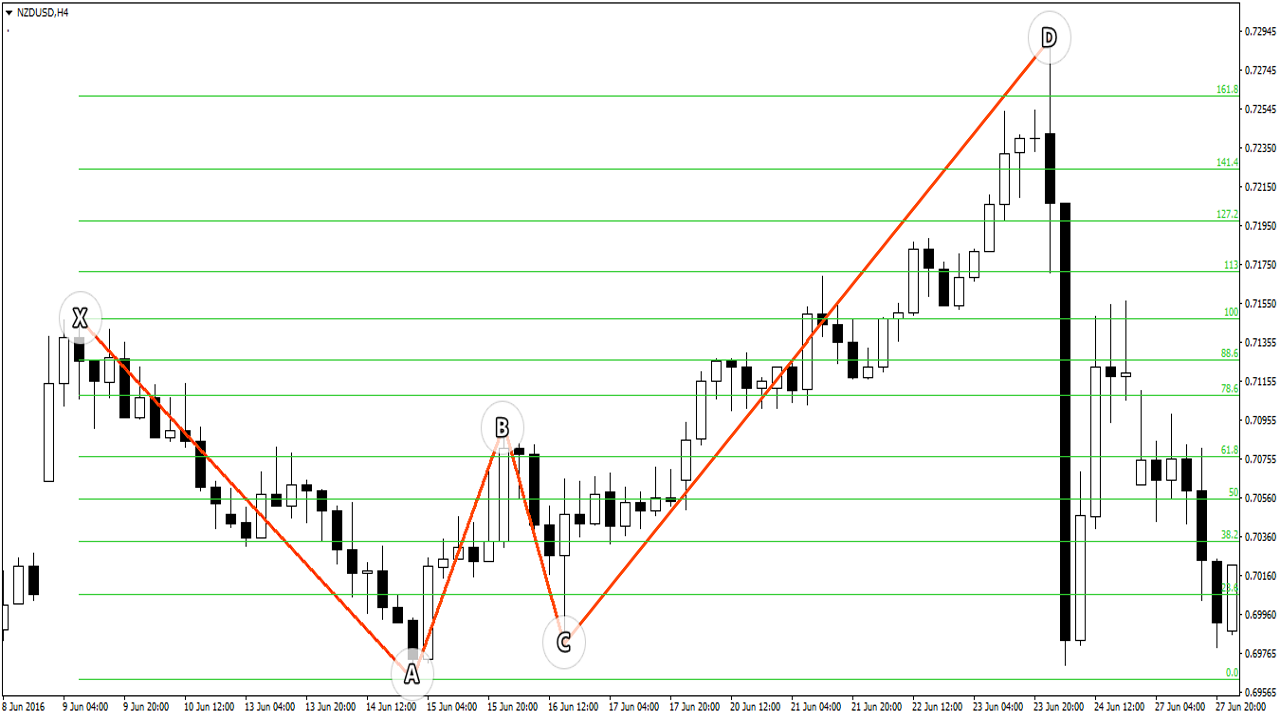
Next comes another small correction before the move upward continues - no more than 88.6% of AB. Point D will be at 161.8% of XA. At the same time, the level should also fall into the green zone - 224% - 361.8% of BC.
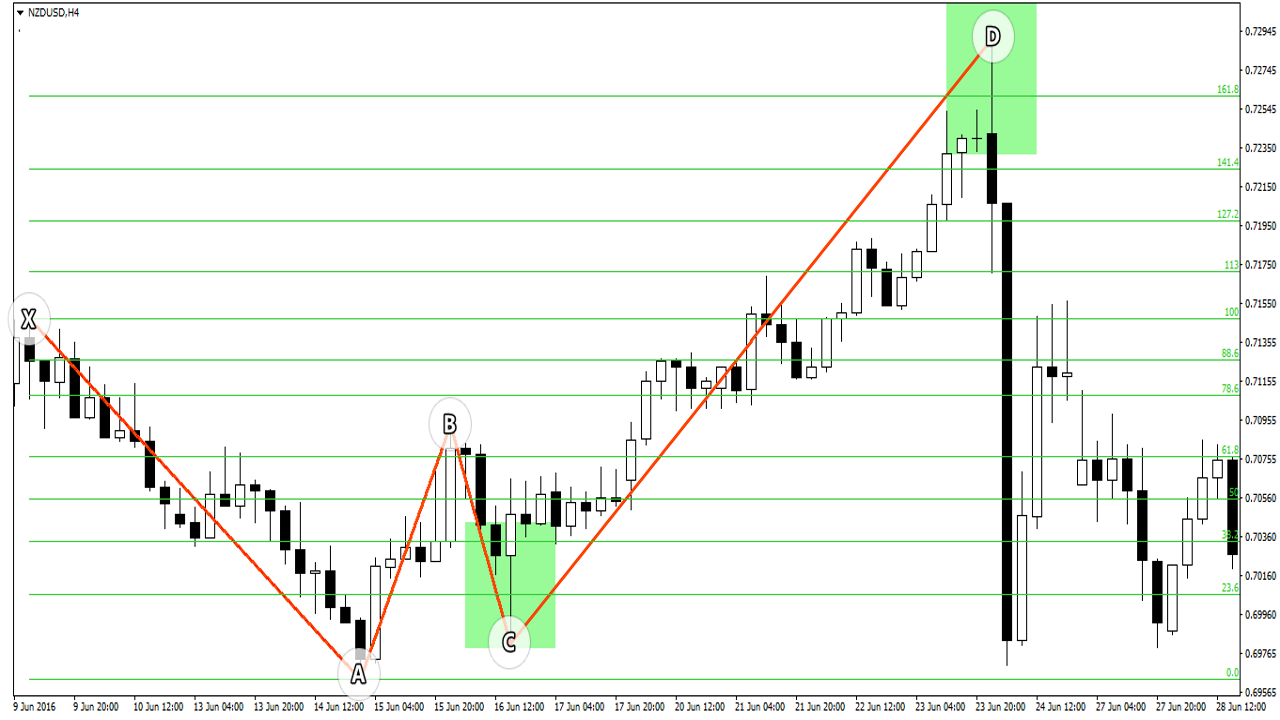
We set the first and second targets at points B and A, respectively. If you cannot decide which target to choose, choose the farther one, but watch the price movement. In this case, you can additionally use a trailing stop. As an option, half of the position can be closed at the first level and the second half at the second - this is the safest option. We place the stop loss slightly above point D.
How to trade:
- We identify the X-A-B leg on the chart - the turning point of the preceding trend;
- Correction AB should amount to 38.2% to 61.8% of XA;
- The repeated change in direction in leg BC should fit within 38.2% - 88.6% of AB;
- The final and largest CD move continues exactly to 161.8% of XA. At the same time, point D should be in the 224% - 361.8% zone of BC;
- We place a pending order at point D, with the stop loss slightly above it.
There is another variety of the Crab pattern, the Deep Crab, which mainly differs by the size of the AB correction, amounting to 88.6% of the XA move. In all other respects, the pattern is identical to the regular Crab.
Bat

This pattern is very similar to Gartley: the trend temporarily changes direction only to continue the main move. This approach allows you to enter the trend at a good price, during a partial correction.
If Gartley is considered formed at 78.6% of the XA leg, then the Bat implies a slightly deeper pullback of 88.6%. The size of the internal corrections is also slightly different. This is the main difference between the two patterns.
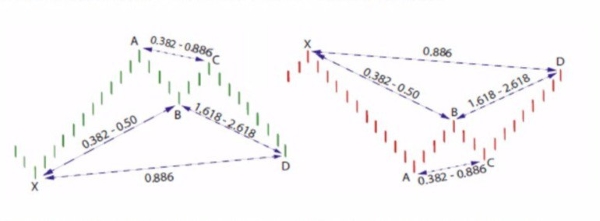
The formation of the pattern begins with the XA leg, the longest move in the figure under consideration. On the correction, we expect a move of 38.2% - 50% of XA. Thus, point B cannot in any way end up below point X. In the case of a bullish formation, point C is a lower high, or a higher low in the case of a bearish pattern. The size of the correction relative to AB should be from 38.2% to 88.6%. The final CD leg should lie within the 161.8% - 261.8% extension of BC. In this case, entry is made when the price reaches 88.6% of the XA leg.
The chart shows a variant of a bullish pattern. The first thing worth paying attention to is the sharp rise and the subsequent price consolidation. Then, we draw the formation on the chart and check whether it matches the required proportions. First of all, we check the location of point B within 38.2% - 50% of XA.
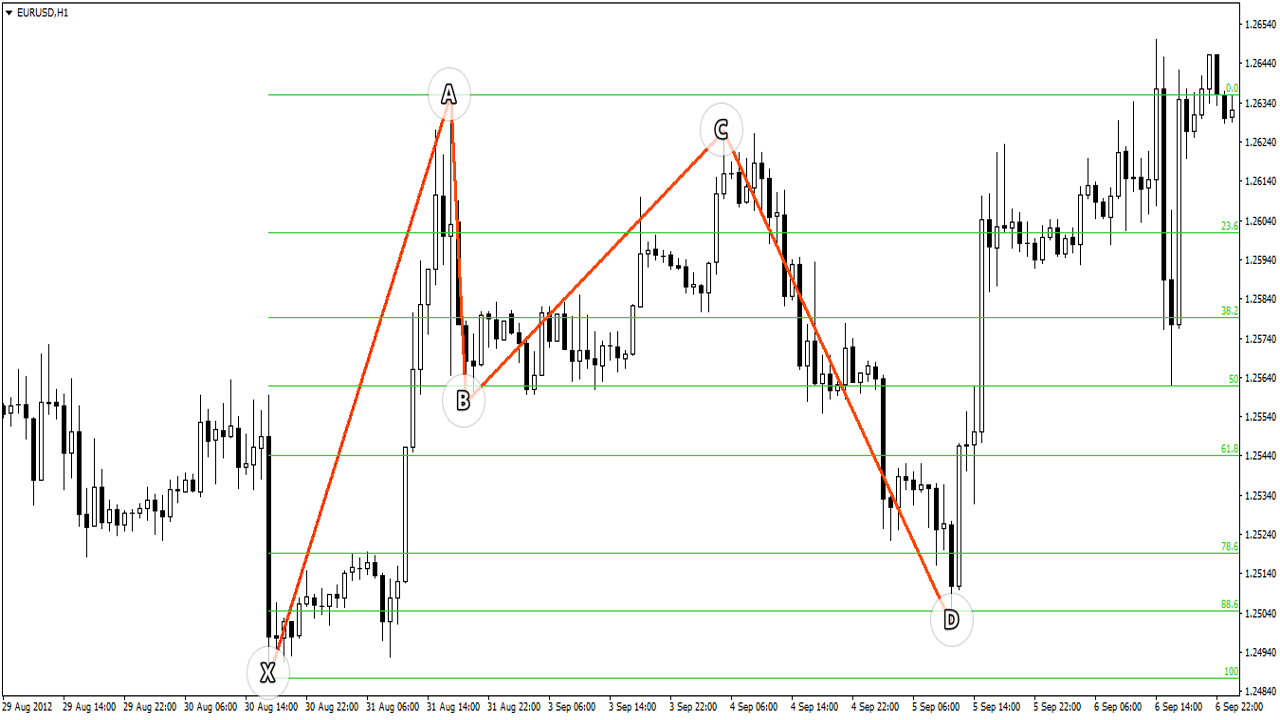
The green areas mark the formation zones of points C and D. Note that the 88.6% correction should also lie within the green area. Otherwise, the pattern is formed incorrectly.
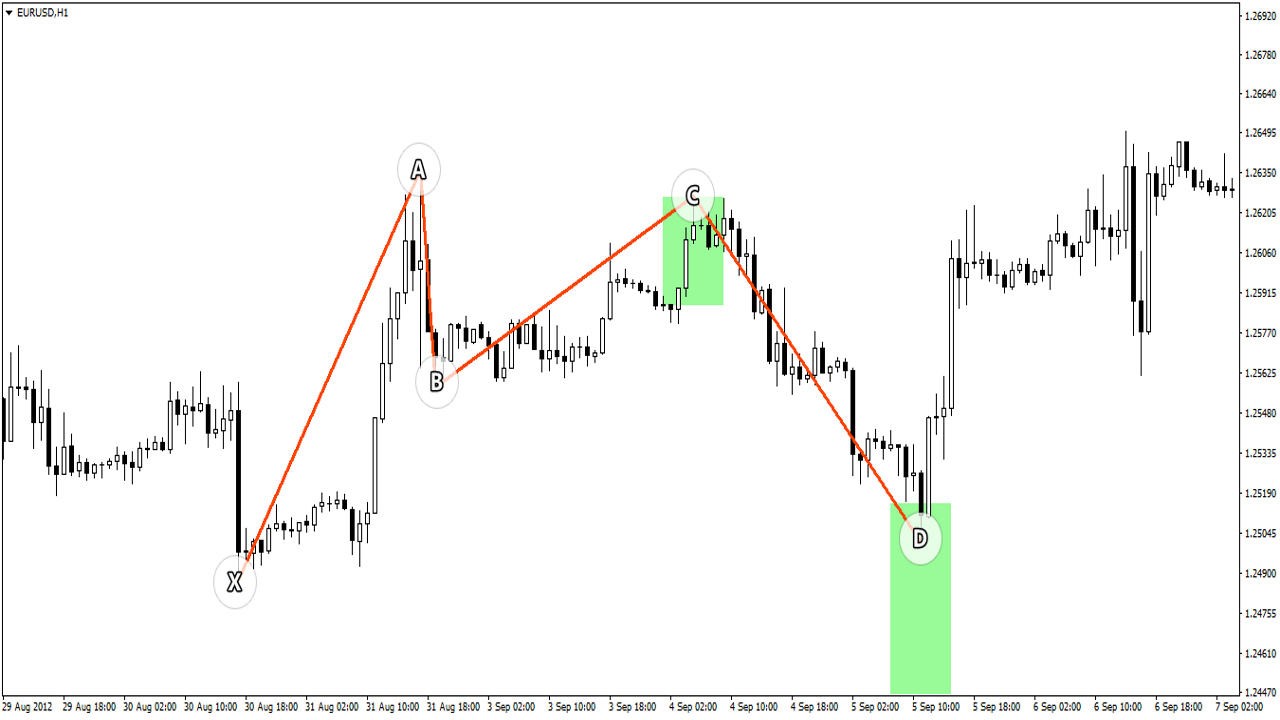
To determine the targets, stretch the grid from point A to D. The first target will be at the 61.8% level, the second at point A. Set the stop loss slightly below point X.
Setting targets is a highly subjective matter, and here again it is worth considering many factors, such as important trading levels or other formations within the trading zone. Then, for lower risk, choose the nearer target. To capture a larger move, you can use a trailing stop.
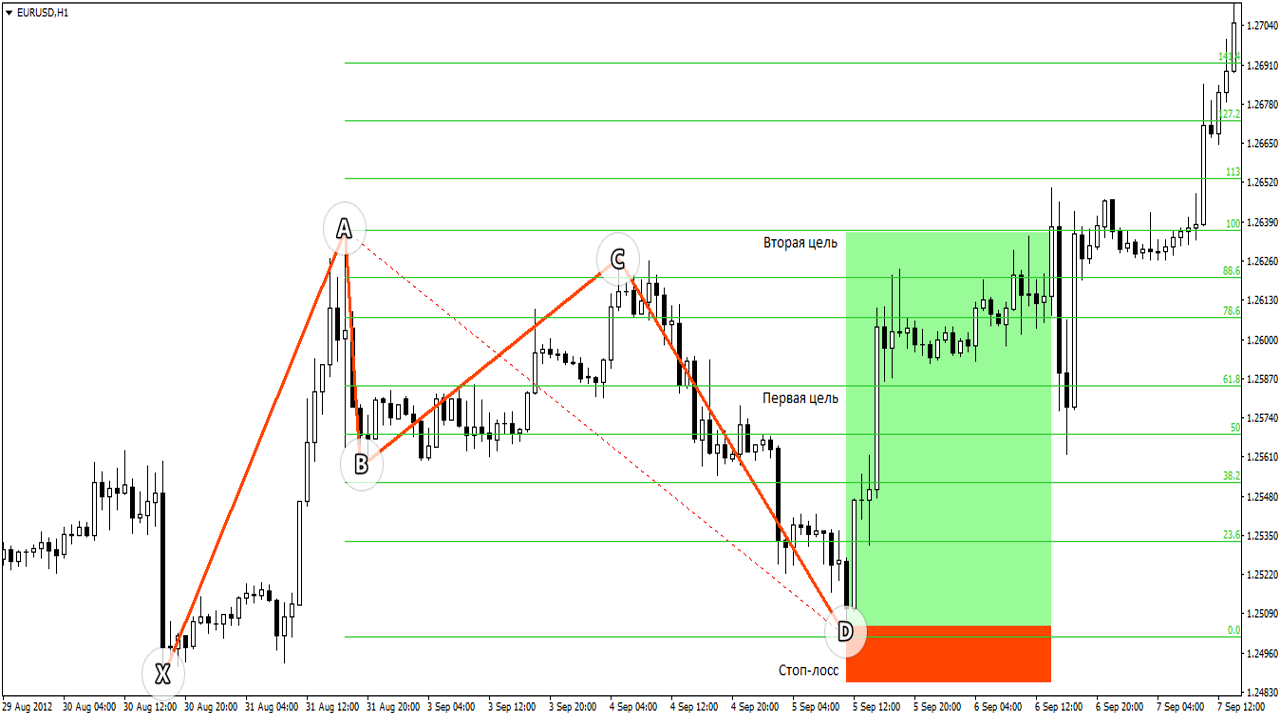
How to trade:
- First, determine the direction of the main trend and draw the XA leg;
- After that, a corrective wave in the form of an ABCD pattern begins to form;
- The AB correction should fit within 38.2% - 50% of XA. BC within 38.2% - 88.6% of AB. The final CD leg completes the move at 88.6% of XA. At the same time, this level should fit within the 161.8% - 261.8% zone of BC;
- Place an order at point D, with the stop loss beyond point X.
There is an alternative version of the pattern with a longer CD leg. The pattern differs mainly in the internal corrections and the location of point D; in this case, it is located even below point X. That is, overall we are dealing with a stronger correction, a logical continuation of the regular Bat.
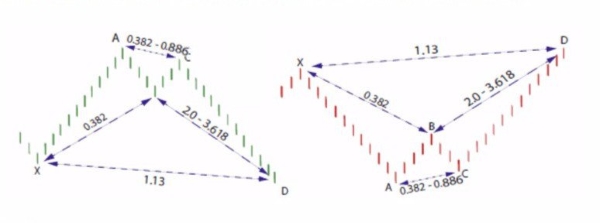
Three Drives

Three Drives differs somewhat from the other harmonic patterns because it does not include an ABCD figure as such. In fact, the pattern itself is a variation on the theory of Elliott waves. By analogy, the pattern consists of 5 legs, with three key peaks and two corrections.
A bullish model is a series of descending highs and lows. A bearish figure, on the contrary, is a series of ascending extremes. Overall, the figure signals the exhaustion of the current move and the market's readiness to change direction.
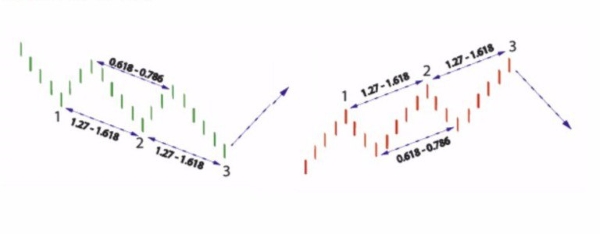
The green areas mark the formation zones of the pattern peaks. However, you should not rely only on the indicated zones, since the pattern performs better when the symmetry of the legs is respected. That is, with identical corrections of the second and third peaks.
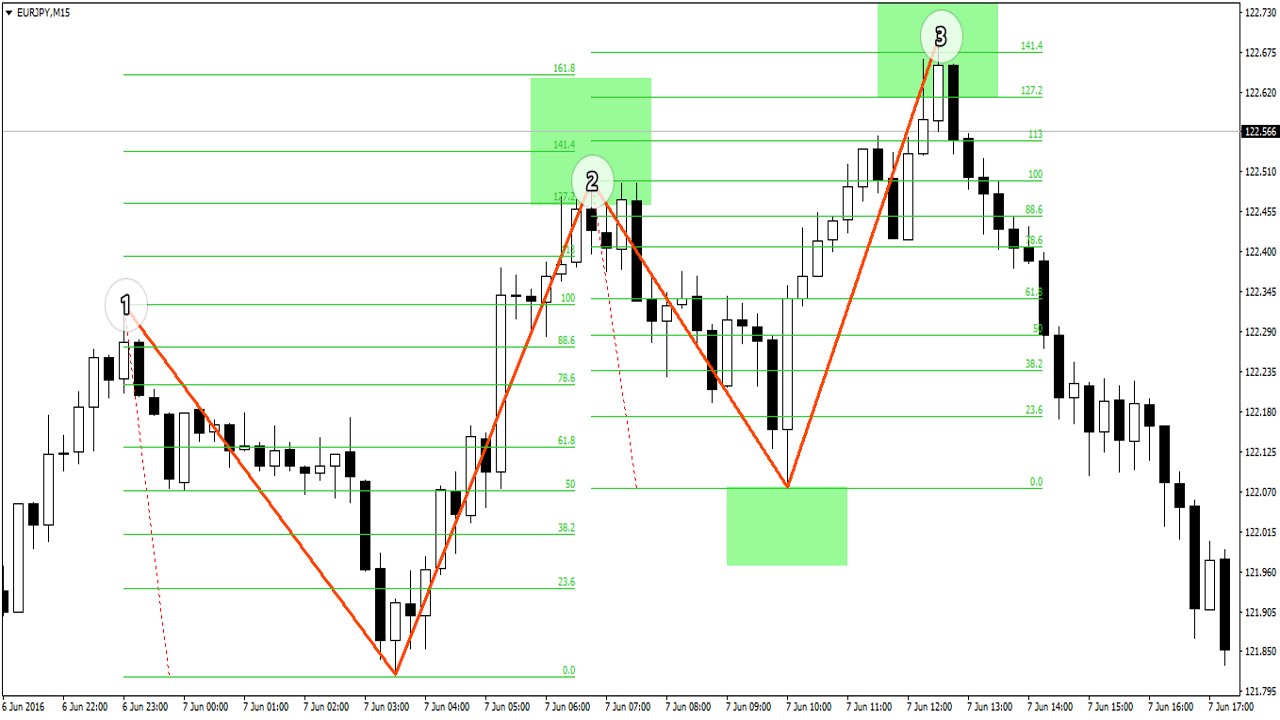
Set the stop loss beyond the 161.8% level of the final leg; exceeding this value means the harmonic figure has broken down. Then, stretch the grid from the extreme points of the pattern. The first target will be at the 61.8% level. The second at the 100% level. The indicated targets are only a recommendation. You can also use the remaining extremes for partial profit-taking.
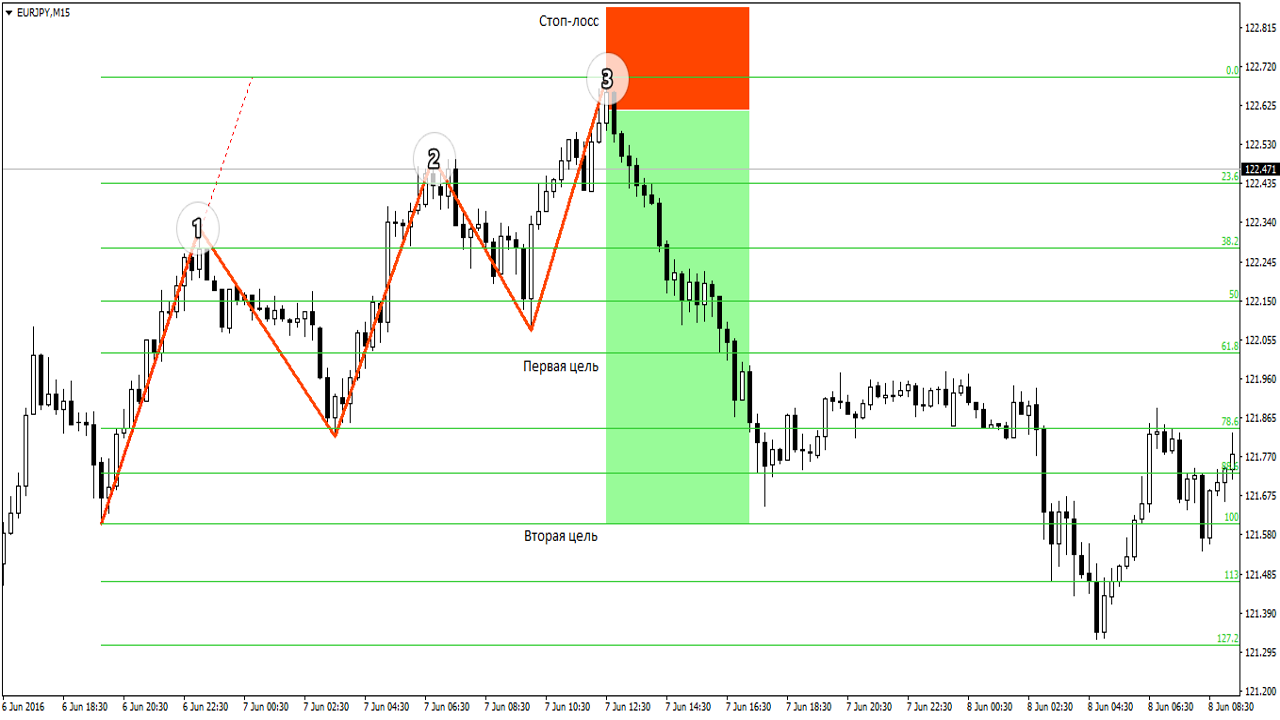
How to trade:
- Visually identify the characteristic zigzag movement on the chart;
- The size of the pullback from the second peak should fit within 61.8% - 78.6%;
- The second and third extremes of the pattern should move away by the same distance. That is, if the second peak corresponds to a 127.2% extension, then place a pending order near the third peak at the same distance;
- Set the stop loss beyond the maximum 161.8% extension.
Shark

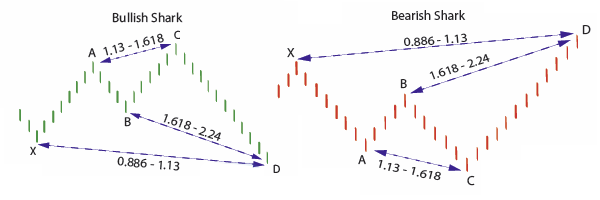
In appearance, the figure resembles an expanding triangle; by that description it is easiest to identify on the chart. In appearance, you can find some resemblance to a shark's mouth.
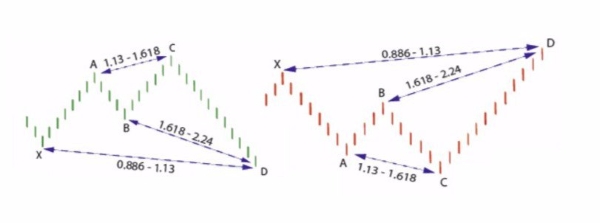
It is quite easy to identify the figure on the chart. In most cases, the final leg includes the entire preceding figure.
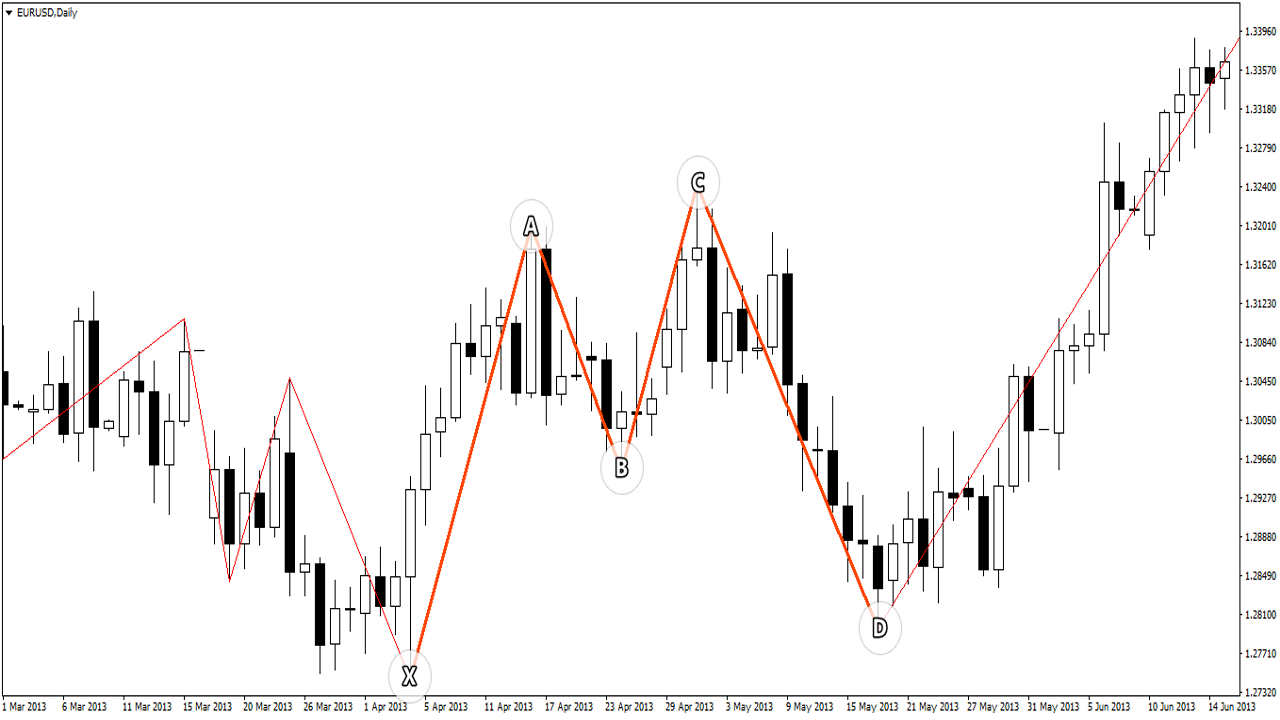
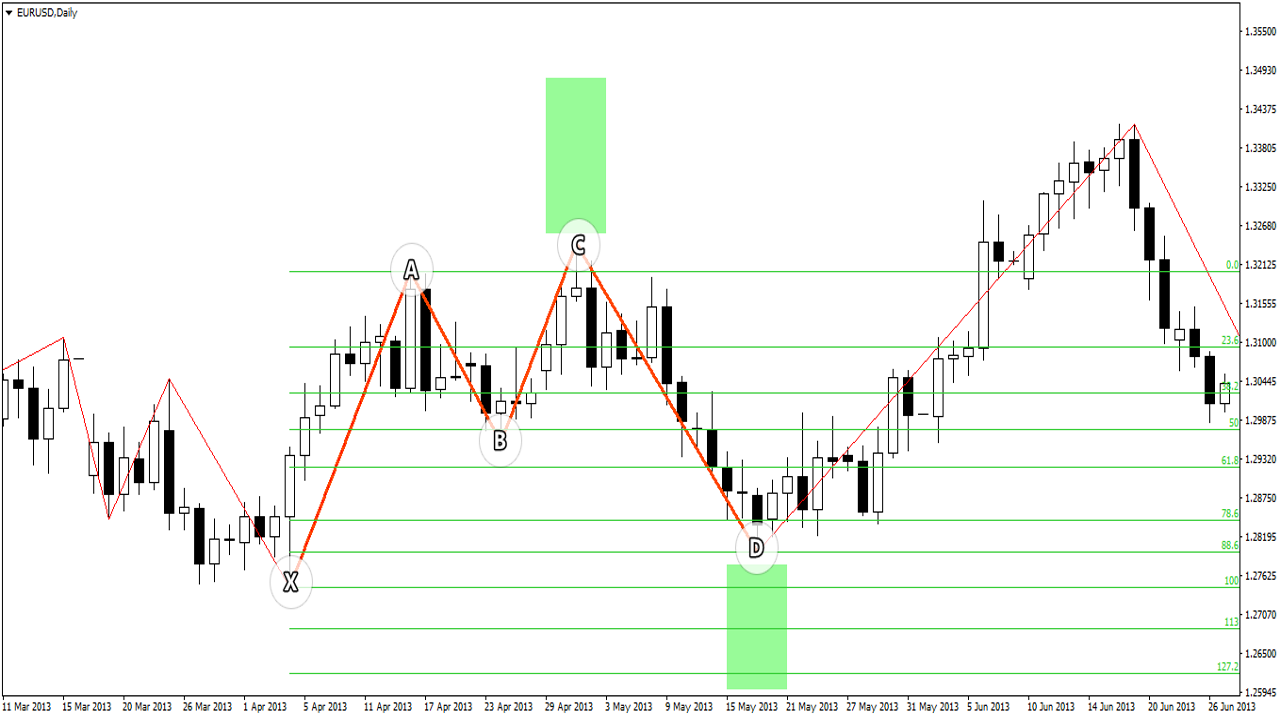
The chart shows an example of a not entirely correct pattern, since the key points do not fall into the green areas, although they are close enough to them. Point C should lie within 113% - 161.8% of AB. Point D within 161.8% - 224% of BC and at the same time fall into the 88.6% - 113% zone of the first XA leg.
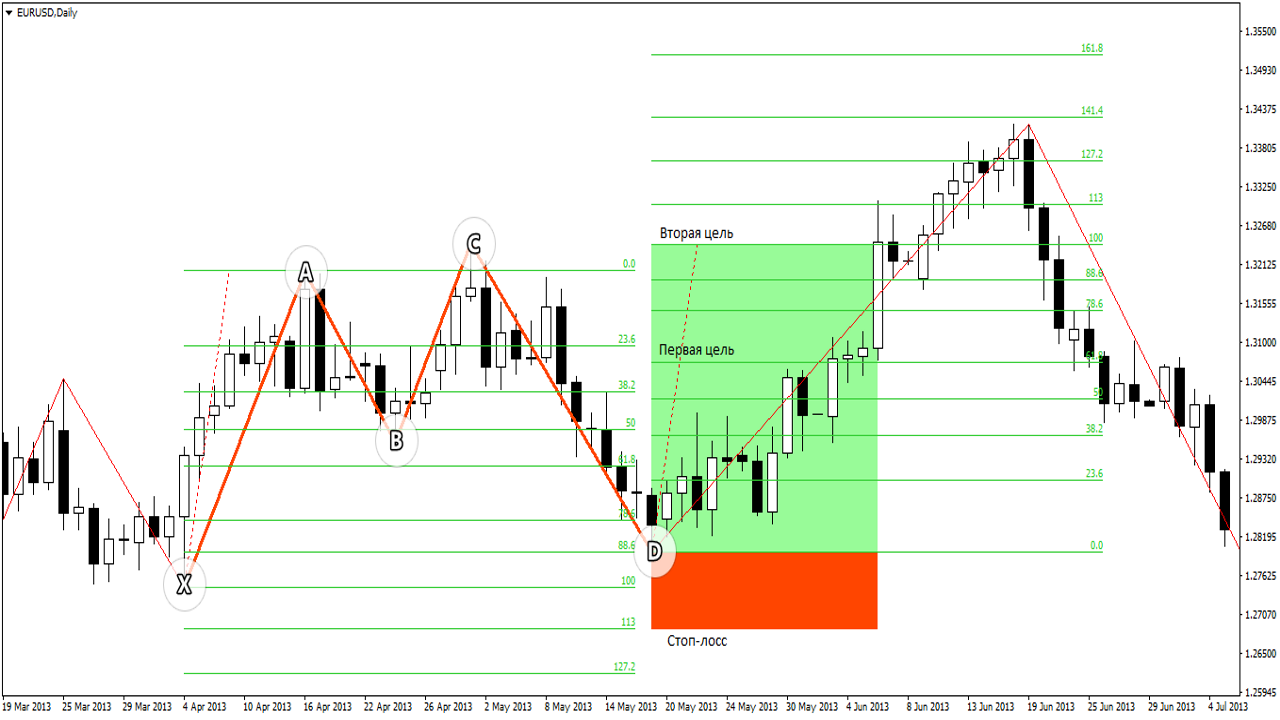
To determine the targets, stretch the grid from the final leg, CD. The first target is at the 61.8% level, the second at peak C. Set the stop loss beyond the 113% level of XA. If the price drops lower, it is better to exit the trade immediately. And although the pattern has played out, the entry can be considered risky.
How to trade:
- Visually determine the formation of an expanding triangle on the chart;
- Point C must fall into the 113% - 161.8% zone of AB. Point D into 161.8% - 224% of BC and into 88.6% - 113% of XA;
- You need to enter at the intersection of the two zones. In any case, place the stop loss below the 113% level of XA.
Cypher

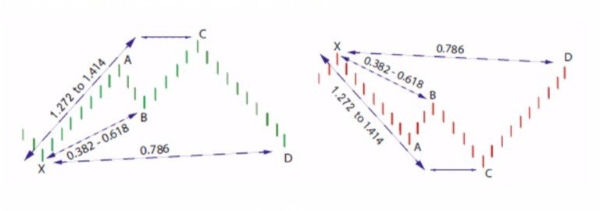
This pattern is often called a reverse butterfly. The difference is that the change of the main direction occurs at point C, and X is the extreme point of the pattern. That is, unlike the butterfly, the bullish formation represents an upward movement, and the bearish one a downward movement. This pattern allows you to find a good entry point at a time when the trend has already changed its direction.
The pattern is not difficult to identify on the chart. First of all, you need to determine the change of the main movement - this will be the beginning of the pattern.
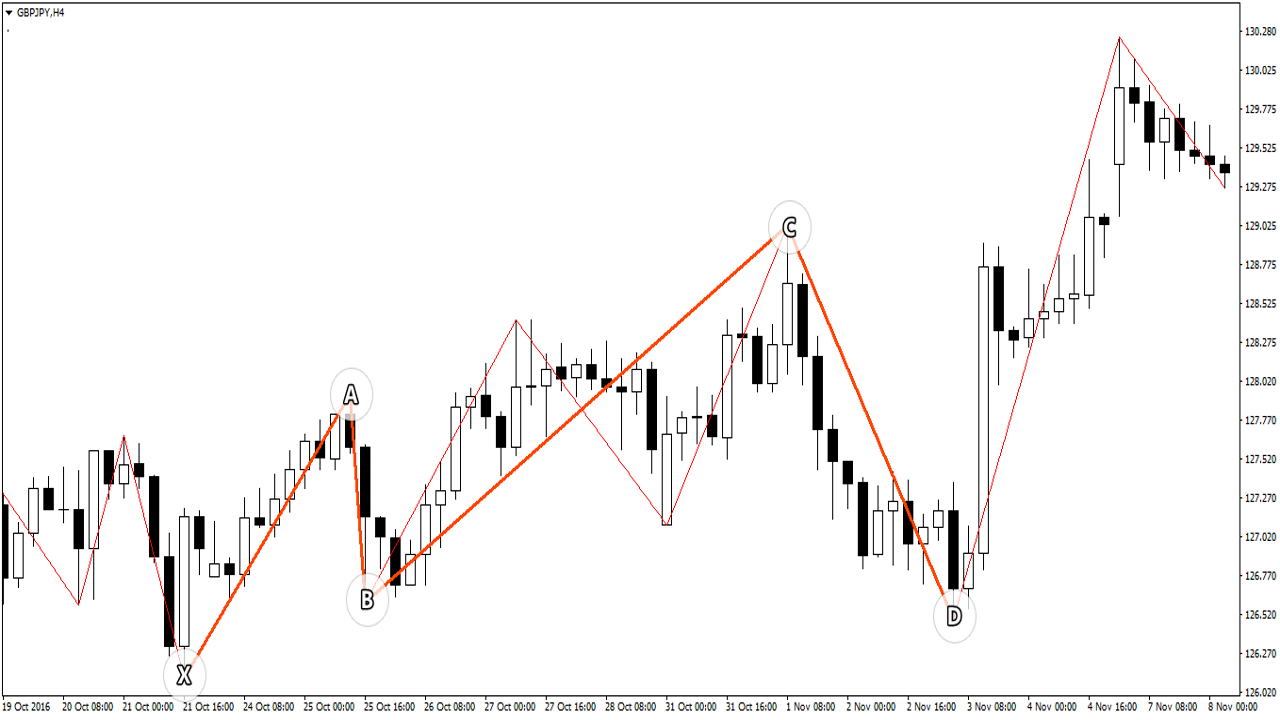
In this case, we are dealing with a bullish formation. Movement XA is the turning point of the main trend, the point where direction changes. Correction AB should amount to 38.2% to 61.8% of XA. Point C should be within 127.2% - 141.4% of AB. Entry is made at point D, at the 78.6% level of XA. The pattern shown on the chart cannot be considered valid, since points B and C do not fall into the green zones assigned to them. Therefore, personally I would skip such an entry.
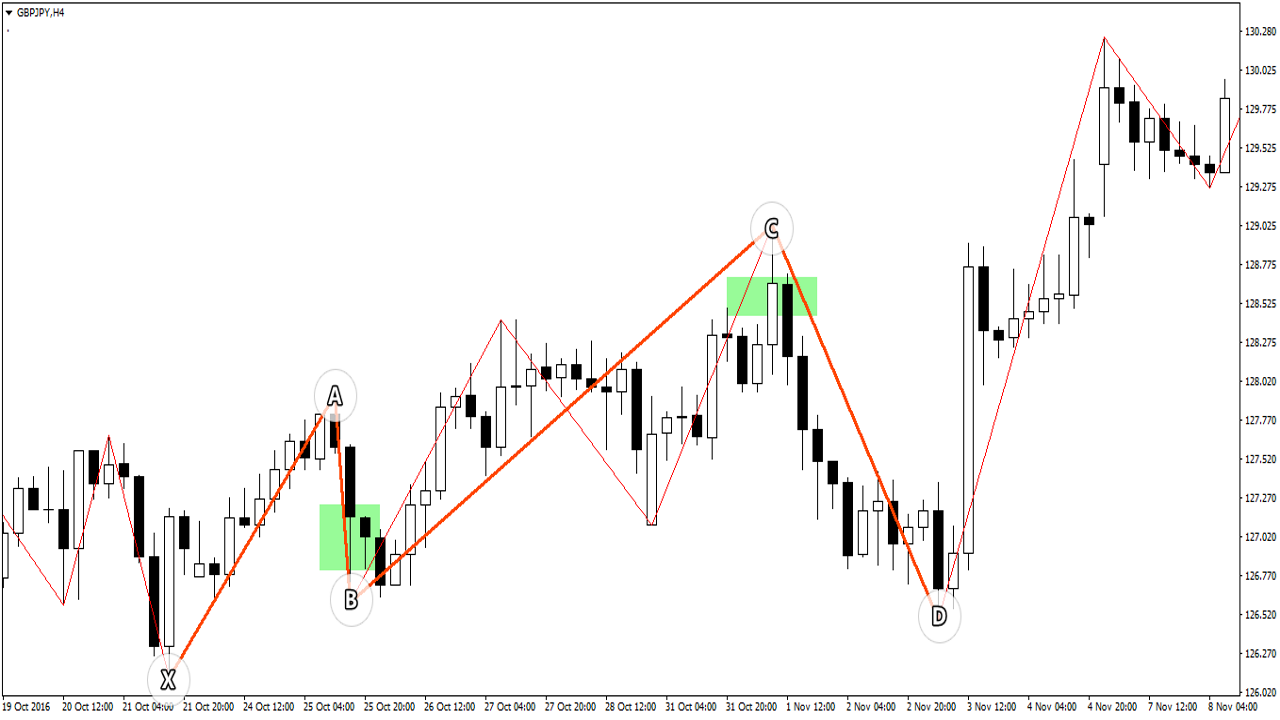
If, however, we are dealing with a correctly formed figure, targets can be set at the level of points A and C. We place the stop loss beyond point X.
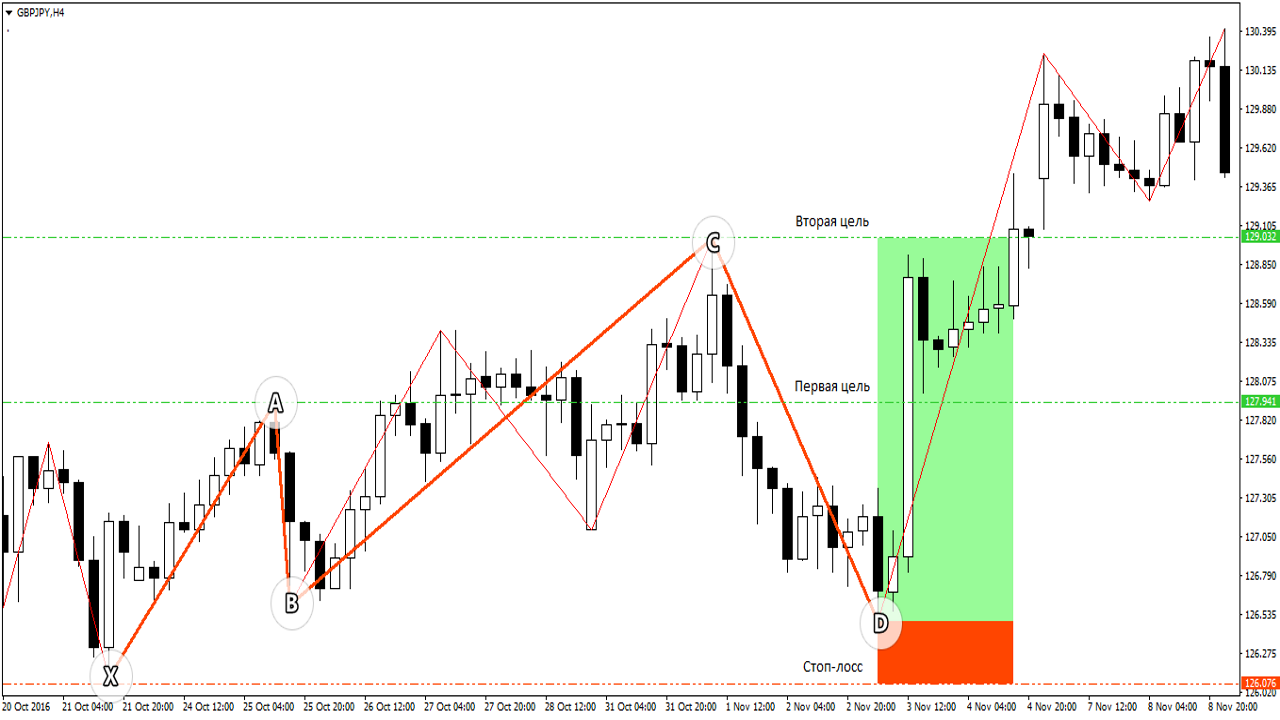
How to trade:
- First, determine the moment when the main movement changes and the subsequent expanding formation. In the Cypher pattern, all movements are calculated from the main leg, XA;
- The first correction should fit within 38.2% - 61.8% of the XA leg;
- The continuation of movement in segment BC should correspond to an expansion of 127.2 - 141.4% of XA;
- The final correction corresponds to 78.6% of XA. Here we place a pending order with a stop loss located beyond point X.
Conclusion

Harmonic patterns describe the market's primary desire - the striving for proper forms. Thanks to this feature, we can extract profit even from chaotic price wandering.
The main rule when building harmonic patterns is strict adherence to the correct proportions. It is better to wait and not enter the market, but to wait for an ideally formed figure - that is the whole essence of proper ratios. Traditional geometric patterns have only an external resemblance to proper figures, but it is much more difficult to determine entry and exit points from them - the beginning and completion of the figure's formation.
Nevertheless, if a harmonic pattern overlaps with some key levels or other structures, that is only a plus. Formations formed in this way can serve as a stronger entry signal. With experience comes an understanding of this method, and identifying figures on the chart becomes a trivial task.
Advantages of the harmonic approach:
- Harmonic patterns forecast future price movement, which greatly simplifies finding an entry point, setting targets, and stop losses;
- Patterns are often found on the chart, give a fairly reliable signal, and are highly profitable setups;
- Almost all figures have clear standardized construction rules, which removes uncertainties;
- One principle works for all timeframes and types of instruments;
- Can be used together with other technical indicators/trading methods.
Disadvantages of the harmonic approach:
- The figures are quite difficult to identify and construct, so it will be hard to apply them in practice right away;
- The second problem follows from the first - there is still no good automatic tool for identifying harmonic patterns;
- Sometimes patterns of different directions can form on one or different TFs;
- The risk-to-reward ratio is not always ideal, especially when it comes to asymmetrical patterns.
Respectfully, Alexey Vergunov TradeLikeaPro.ru
