
Volumes in Forex: Where and How to View Them
 Dear readers of the tradelikeapro.ru forex blog, hello. We continue the topic of volume analysis in forex, or more precisely, the introduction to the VSA technique. Today we will talk about the difficulties of determining trading volumes in forex, choose the most practical source of volume information, and examine one extremely curious indicator :)
The Importance of Volumes
Volumes are important because by analyzing them we identify the activity of "professional money," which significantly influences the forex market. The imbalance of supply and demand creates price movements, and VSA helps determine the current market sentiment and follow large players.

The Difficulty of Determining Volumes in Forex
However, when analyzing volumes specifically in the forex currency market, we encounter certain difficulties. The fact is that forex is decentralized, so it is not possible to obtain accurate information about trading volumes.

What should we do? Where should we get volume information? We cannot obtain exact data, but we do not need it, because for trading with VSA we only need data on relative volume, that is, what it is compared with other candles: average, high, or low. And to calculate such relative data, we can use the following sources:
1. Volumes from the futures market
2. Tick volume
Volumes from the Futures Market
A futures contract is an agreement to buy or sell an asset in a certain quantity and on a specific date in the future at a price agreed upon today.
Currency futures are traded on the Chicago Mercantile Exchange (Chicago Mercantile Exchange), abbreviated CME. In general, trading volumes in currency futures give a similar picture to what is happening in the spot market and can be used to analyze the situation in forex.
Tick Volume
Tick volume is the number of price fluctuations over a certain period of time. It is tick volume data that is present by default in the Metatrader 4 terminal. These are not real volumes, but only the number of changes in the currency price. Nevertheless, tick volume data can quite well be used to calculate the relative size of trading volumes. After all, for the price to move by one tick, some number of contracts must be sold or bought, which is impossible without an inflow of money. Therefore, the size of tick volume can quite reasonably be used to judge real volume.
"Where other volume data is unavailable, tick volume may be used."
Tom Williams, the founder of the modern VSA methodology.
Moreover, the author of VSA himself clearly and plainly states in his book "Master the Markets" that tick volume can be used. By the way, in the TradeGuider program released under his supervision, tick volume is also used specifically for analyzing the forex market.
So What Is the Best Way to View Volumes?

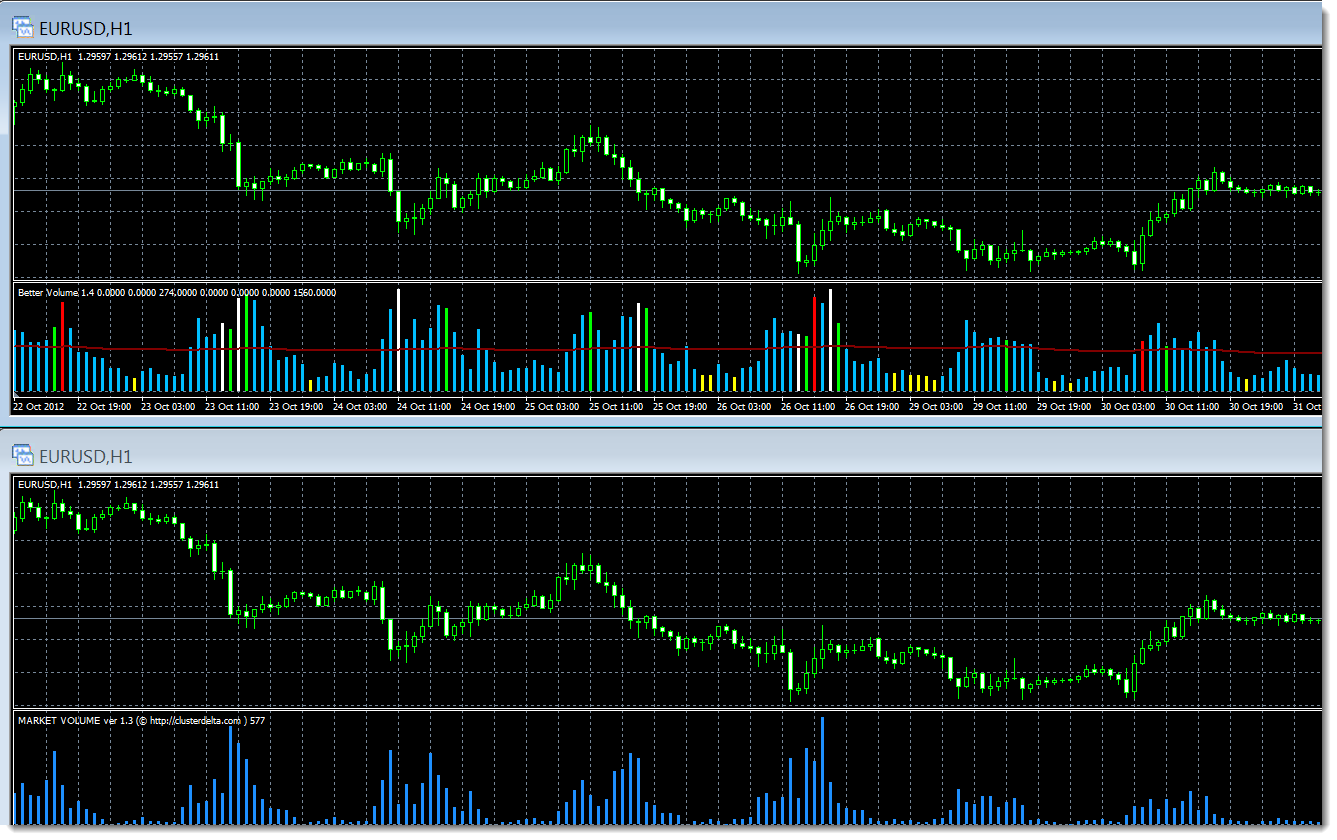
There is no unambiguous answer to this question. If you look at the screenshot below with tick volume (top) and CME exchange volume (bottom) indicators installed on identical charts, you will see that when analyzing relative volume they provide approximately the same data. To judge what the relative volume is like (high, average, or low), you can use either of these indicators. Therefore, just use what is closer and more convenient for you.
 (click the image to enlarge)
Description of Better Volume Indicator Signals
The enhanced tick volume indicator Better Volume automatically evaluates the current volume and candle spread, comparing them with previous values, and gives us a kind of signal indicating the presence of high or low volume and the size of the spread. Here is the list of color signals that appear on the Better Volume histogram.
Red color means the presence of high volume and a wide spread on an up-bar. It appears at the beginning and at the end of upward trends, as well as during corrections in a downward trend.
White color means high volume and a wide spread on a down-bar. It appears at the beginning and at the end of bearish trends, as well as during corrections in an upward trend.
Yellow color means low volume. It appears at the end of trends, as well as during corrections.
Green color indicates the presence of a bar with a small spread and significant volume. It appears at the end of trends (the transfer of assets from market makers to ordinary traders) and during profit-taking in the middle of trends.
Download Volume Indicators
(the indicators are installed according to the standard instructions)

P.S. Since September 2013, the Cluster Volume indicator requires activation to work. Details at the link.
Sincerely, Pavel Vlasov TradeLikeaPro.ru