
Volatility in Forex - what it is and what to do with it

Good day, fellow forex traders. Today we will talk about the concept of Volatility in the Forex currency market. We will discuss what it is, what volatility depends on, and most importantly, HOW we can use this data to build and improve our own trading strategies and, as a result, earn more profit from trading.
Services for Obtaining Data

- https://www.mataf.net/ru/tools/02-01-volatility
- http://www.myfxbook.com/forex-market/volatility
- https://tlap.io/en/tools/volatility-indicator
What Is Volatility?

Volatility is the range of price movement from the maximum to the minimum during a trading day, week, or month. The higher the volatility, the higher the range during the trading time period. It is believed that because of this, the risks of your positions are higher, but at the same time you get more opportunities to earn.
Volatility can be measured over different time periods. If we open a daily chart and measure the distance from high to low, we will get the volatility of the day:
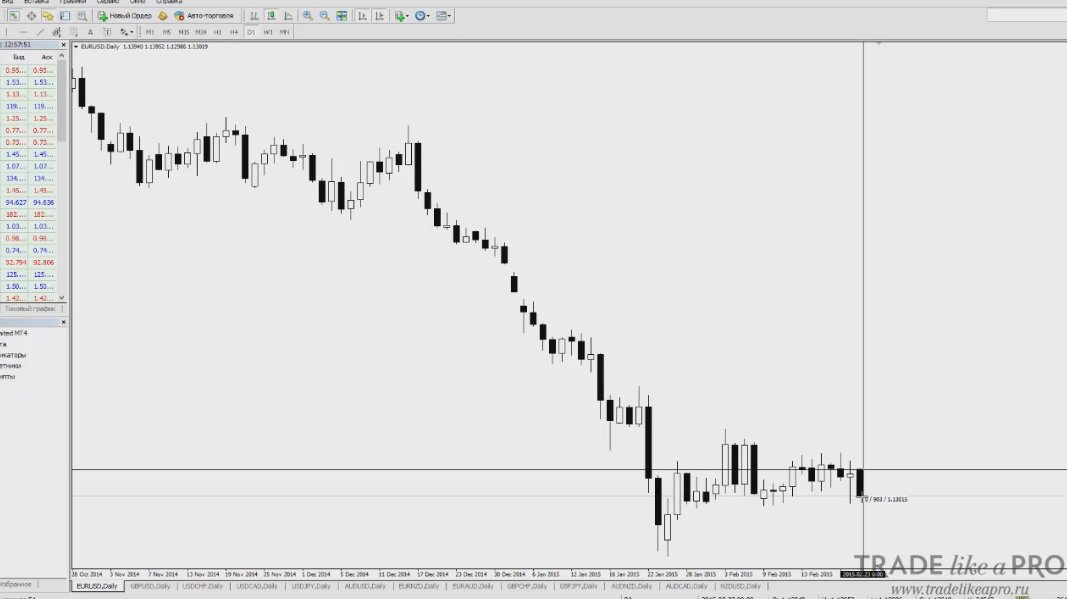 It turns out that in the screenshot above it was 98 points.
We can also measure it over another time interval, for example, on a weekly chart:
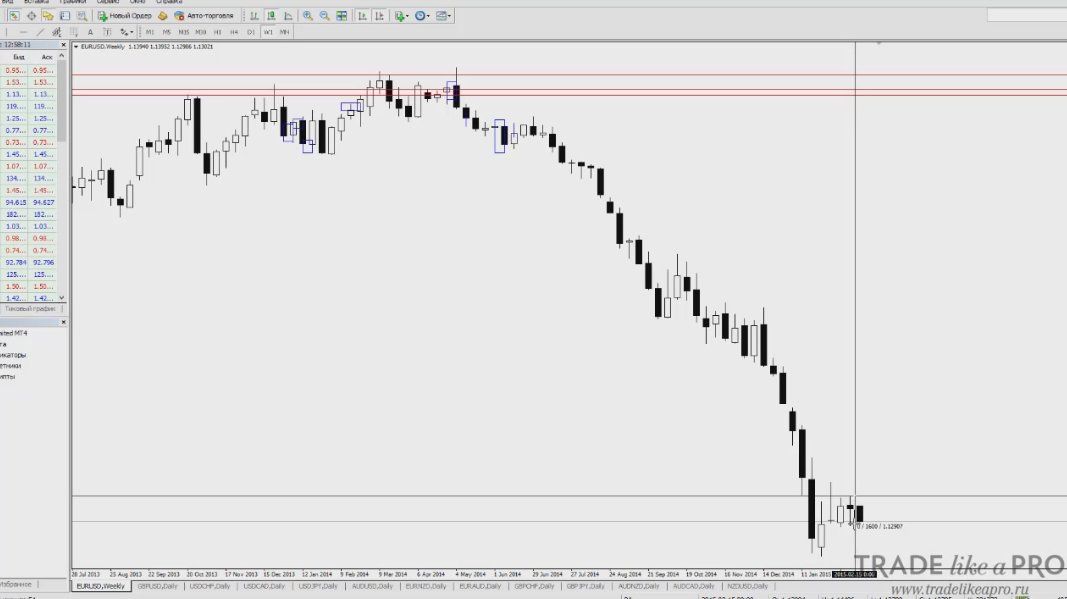 The distance from the high point to the low point was 174 points. The total volatility during the week was 174 points. Volatility can be measured within a trading session or within a trading hour. This allows us to conclude that it is a fractal value.
As a rule, the average volatility over the last N candles is taken into account. If we take daily charts, then average volatility is usually calculated over the last 10 days. Roughly speaking, the last 10 candles are summed and divided by 10.
What Does Volatility Depend On?

It depends on the number of trades in the market, participants, the trading session, the general state of the economy of a given currency, and, of course, speculation. On how speculative the market is for that currency. Note that volatility can be measured both in points and in percentages. But it is worth noting that stock volatility is most often measured in percentages. In forex, measurement in points is more customary. If you are told that the average price change of the EURUSD pair is 0.7%, then you can safely recalculate that into points. And vice versa, calculate percentages from points if you need that for any research. Now let's move on to the most important question.
How to Use Volatility Data to Make a Profit?

In fact, everything is quite simple. As they say, everyone knows about it, but no one uses it. This especially concerns intraday trading. No one wants to apply the simplest rule.
Suppose that you know that the average volatility for the GBPUSD pair is 120 points. The question is: if from the start of the day the price has moved up 100 points, should you open a buy position? The answer will be obvious: we should not do that. Because the probability that the price will move some more points is too small. Consequently, it is not worth opening a buy position, and on the contrary, attention should be focused on bearish positions. But for some reason people forget about this simplest methodology and follow their system. I believe that including volatility, at least in intraday strategies, in your checklist for entering the market is absolutely necessary.
The same can be done with higher timeframes. Imagine that we know that the average weekly volatility for GBPUSD is 200 points. If since Monday the pair has moved 50 points, then we can expect that if the price continues moving down, there is potential for about 150 points.
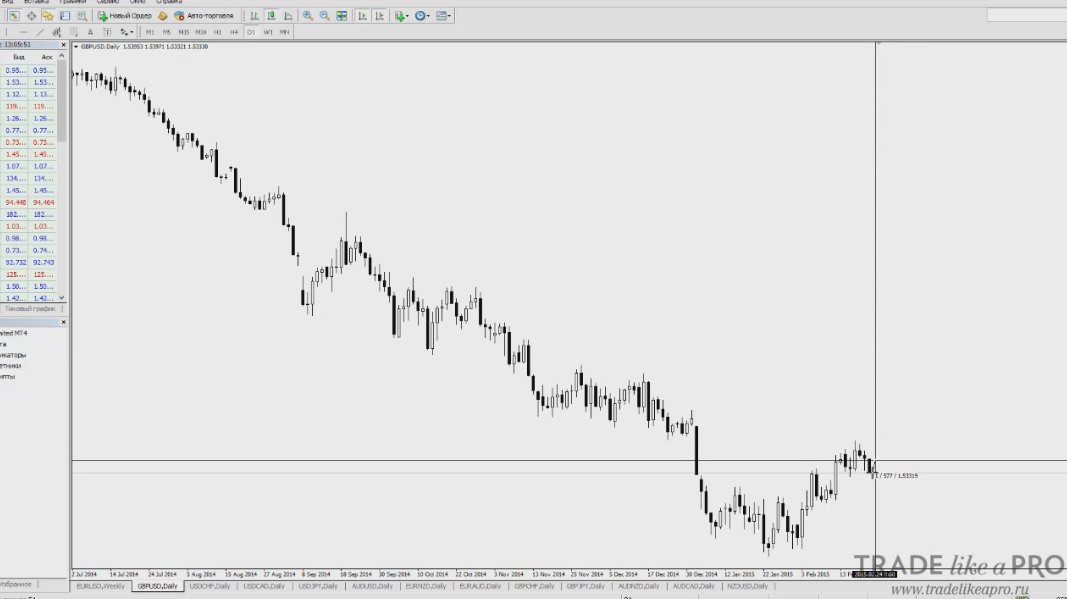 Of course, there are days when some movements become larger or smaller, but we try to rely on statistics.
With its help, you can calculate the size of stops and takes. If we decided to rely on volatility data and open a sell on the pound, then we would try not to set a large take-profit relative to the weekly timeframe. Because our expectations within the week are 150 points. To determine stops, we would use special indicators. In addition, we would watch the size of the channel.
If the average volatility of a pair is 200 points, then expecting a 1000-point move is foolish. At least within a week. Thus, volatility can also be used for risk calculations. If you have opened many positions on different pairs, then you can calculate what will happen if all stop-losses are triggered. Naturally, the market is not obliged to obey your calculations, but this gives some support for your convenience and trading.
How to Calculate Volatility?

Of course, you can manually measure each candle and then divide by 10 using a calculator. This is not so difficult. But there are special services that help perform the calculations automatically.
One of such services is Mataf.net
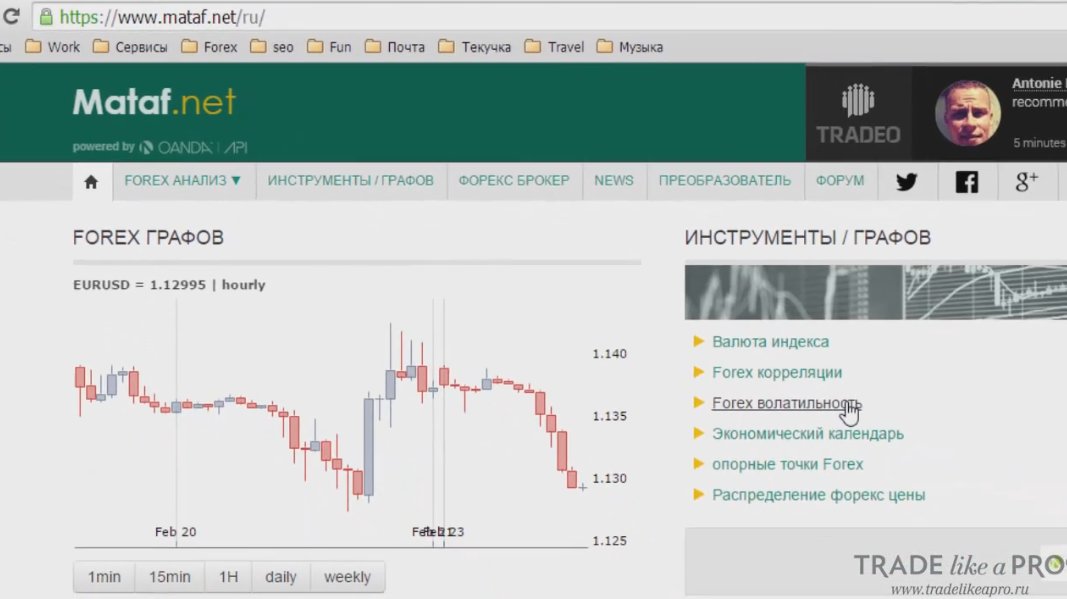
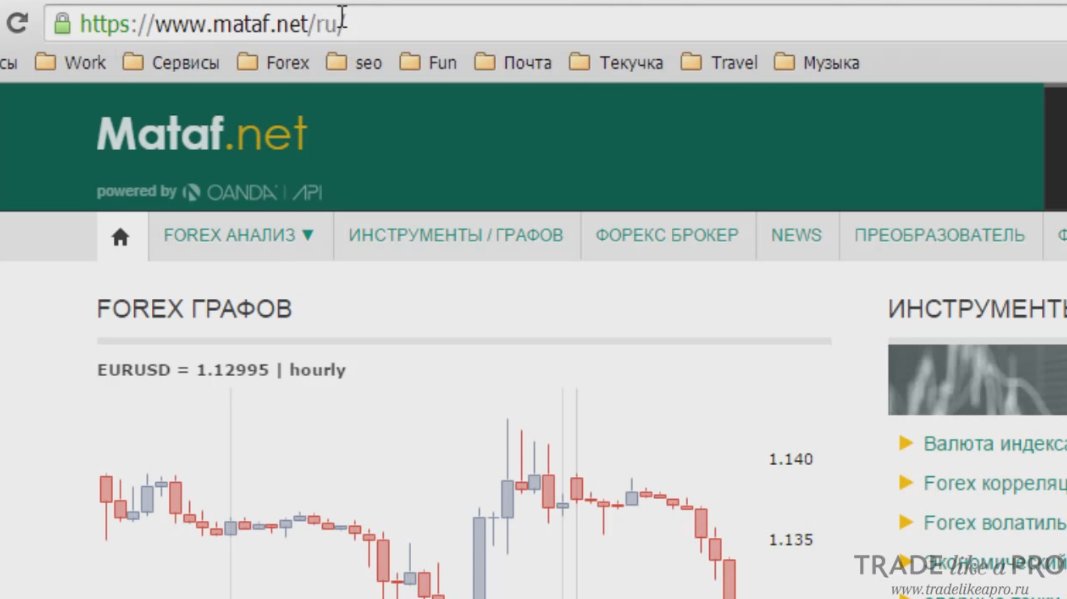 On the website, you need to select the "Forex Volatility" section:
 And in the opened window we can already work with the data:
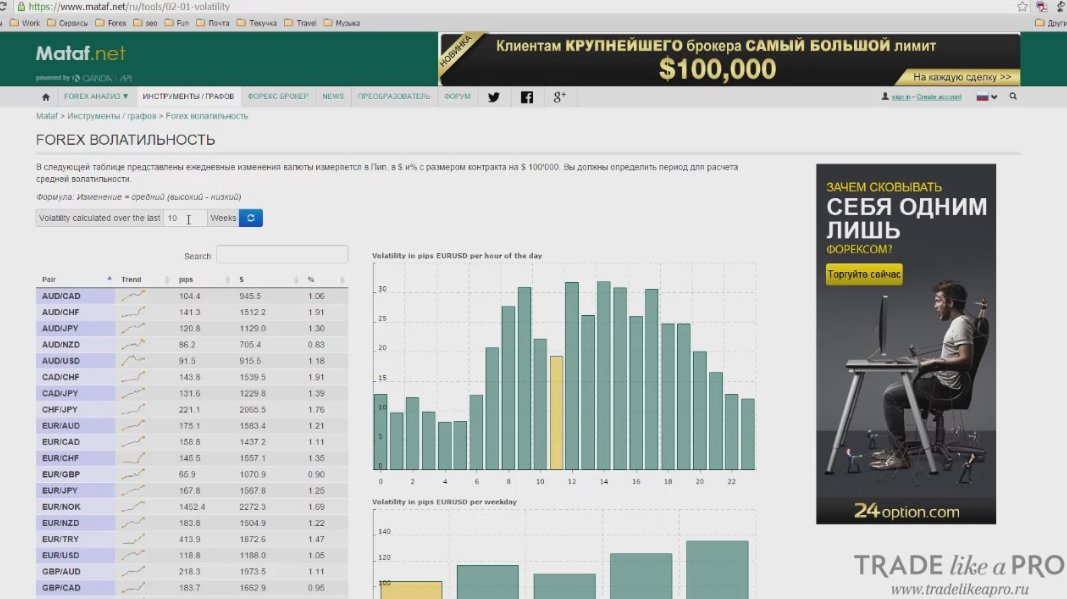 By default, statistics for 10 weeks are shown. The EURUSD pair will be set automatically:
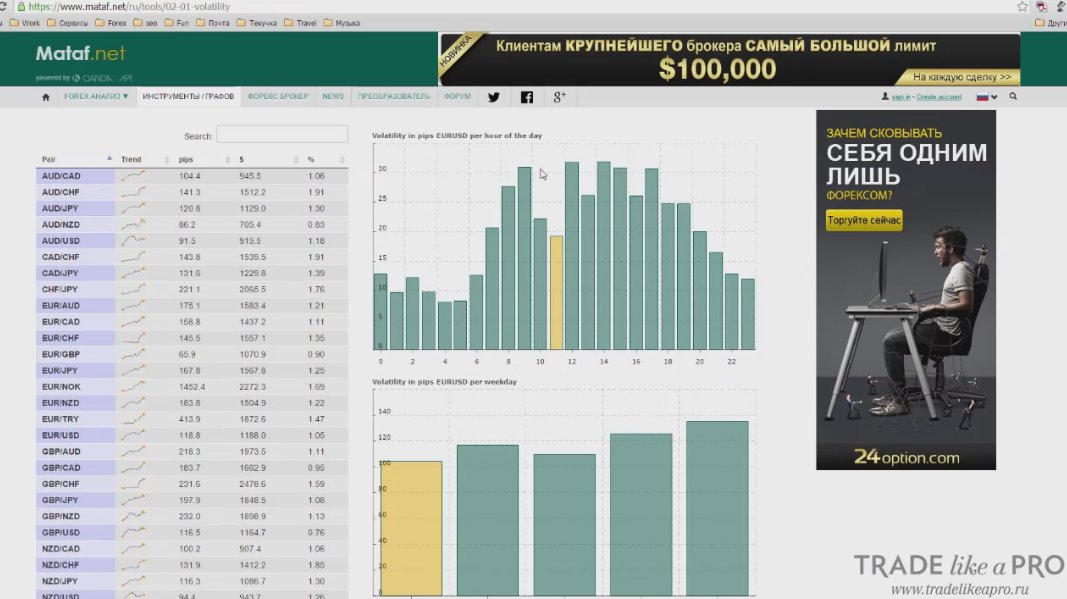 If you need statistics for another pair, then simply choose it from the list on the left and get the data:
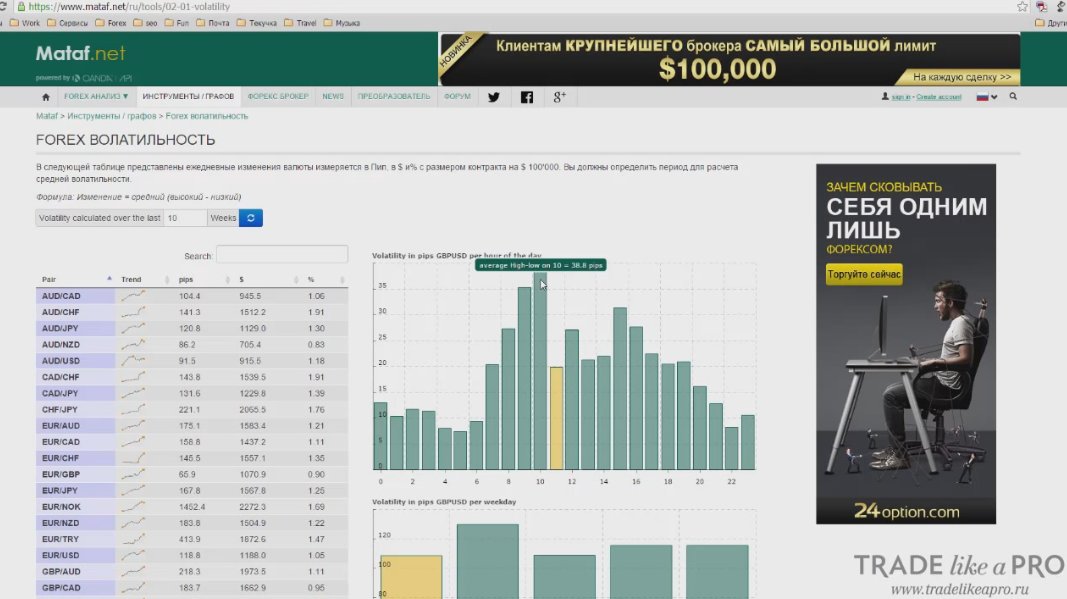
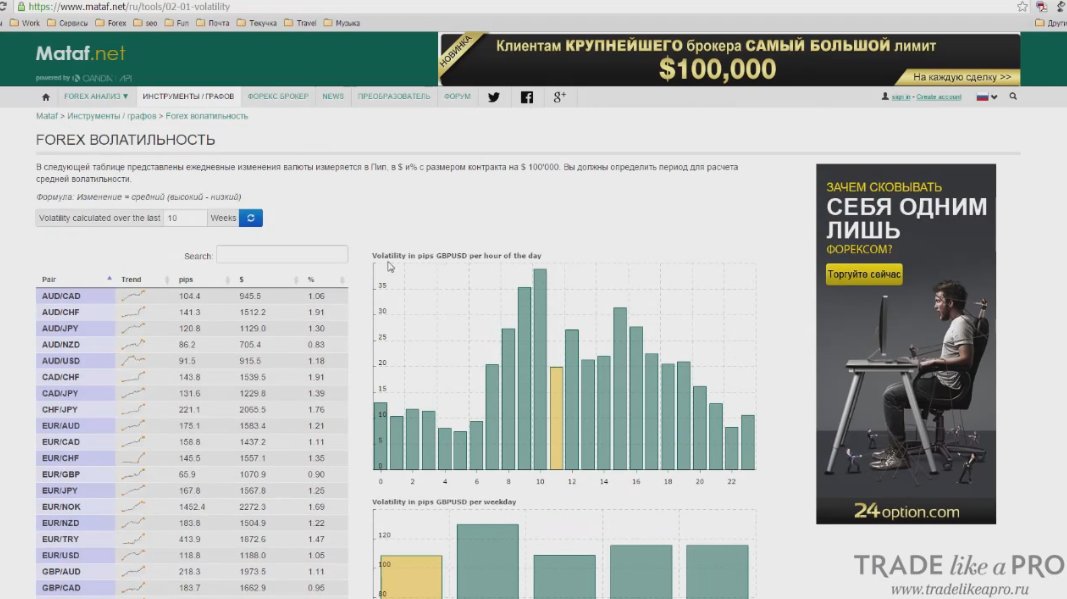 Let's take the GBPUSD pair. We see that the average volatility per day is 116 points. We can also view volatility by hours throughout the day. Traders who trade, say, on M5 can use this.
For this pair, the average volatility per hour is 25 points. Let's imagine that within an hour you get a buy signal, and the price has already moved 20 points. In this case, it is not worth getting in. Only on the condition that in the next hour the price will continue moving.
So, on this service you can view the volatility of any trading pair. The website shows Greenwich time. We also see statistics that can be analyzed and used in trading. Thus, the most volatile hour for the GBPUSD pair at the time of writing this article is 10 o'clock Greenwich time - 38.8 points:
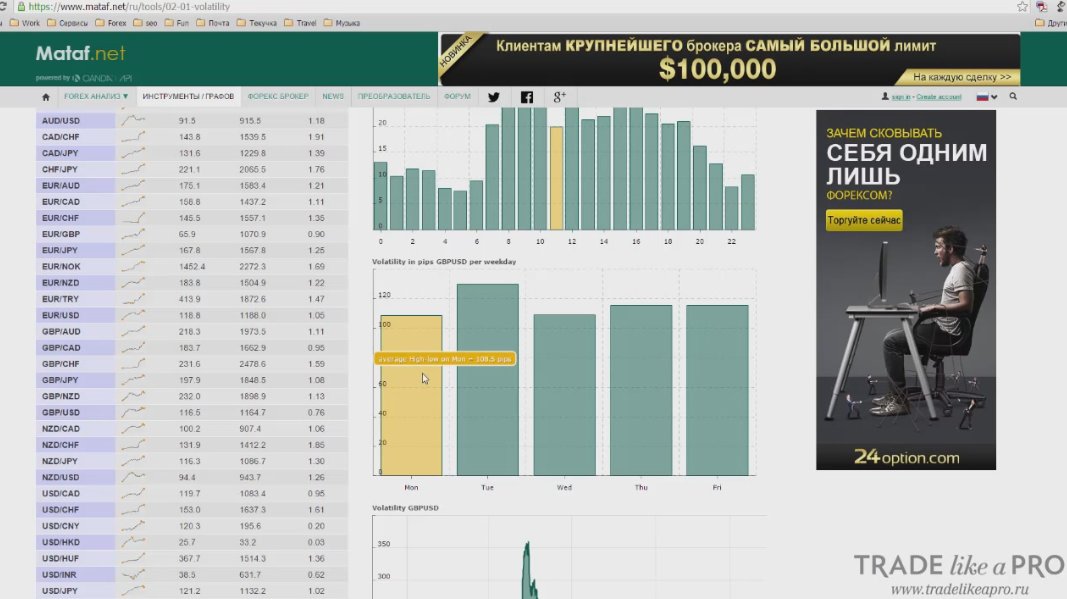
 You can also see the data by days of the week. Our most volatile day is Tuesday, and the least volatile is Monday:
 Again, these data can be used to build or adjust your own strategy. Surely some ideas have already come to you as we move further.
Even lower you can see historical volatility:
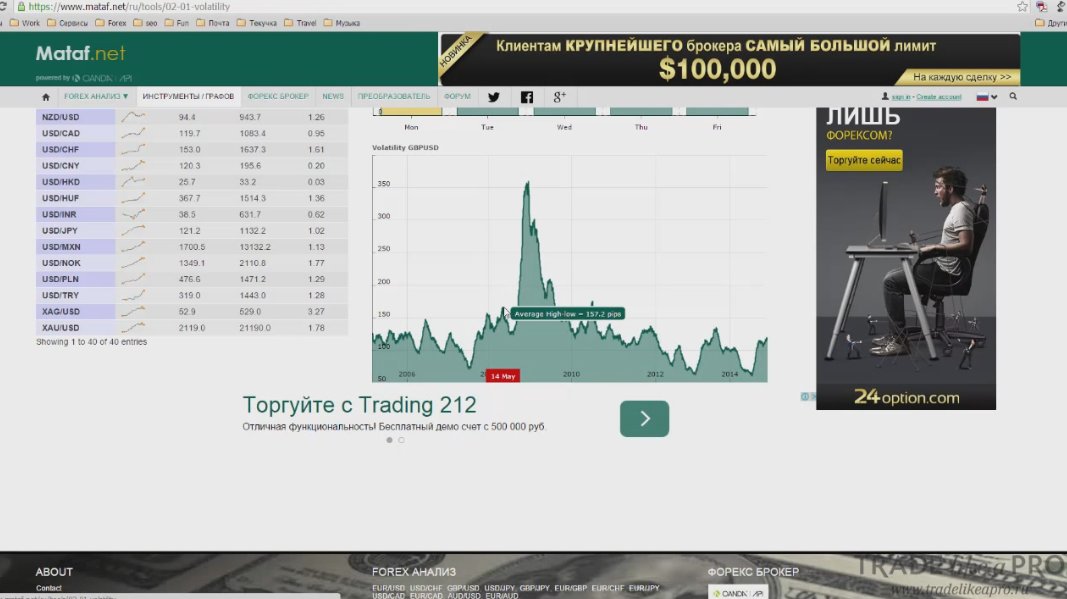 This will be useful when testing strategies on history. We can conclude that in 2009 volatility was the highest. And at the current moment it is average. You can do the same with other currency pairs and metals, such as gold or silver.
You can also view volatility data on the myfxbook.com service
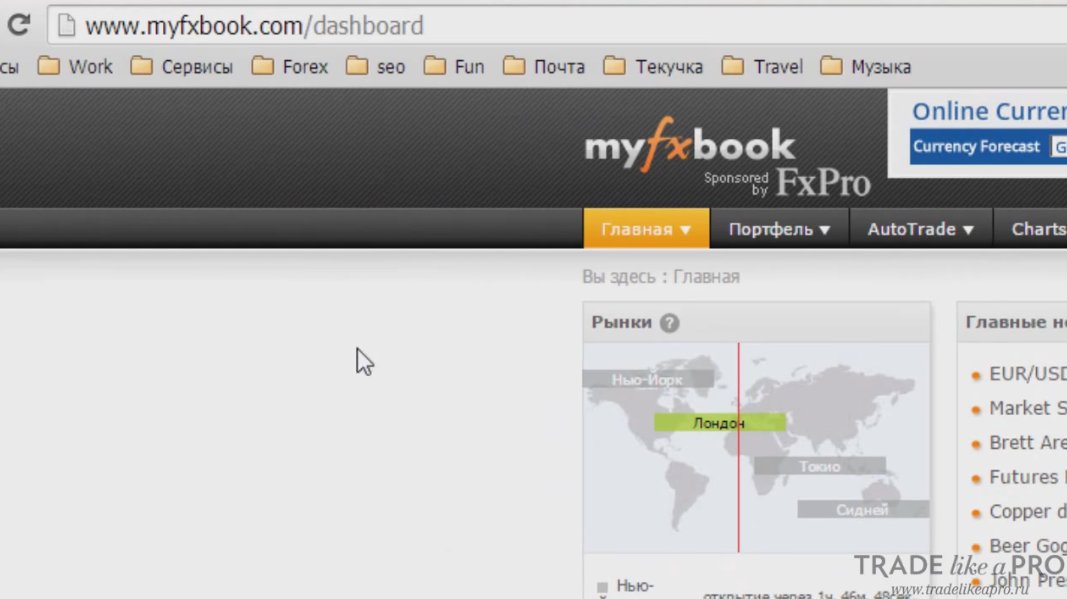 It should be familiar to you as a website for monitoring trading. But here there are also additional tools for viewing volatility.
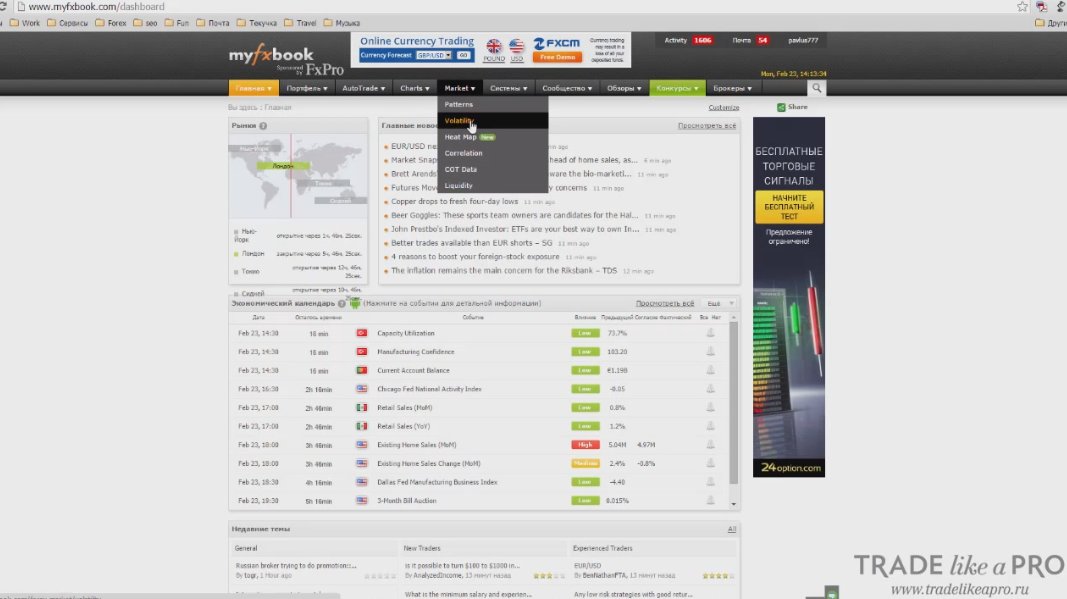
To open the indicators, find the "Market -> Volatility" section:
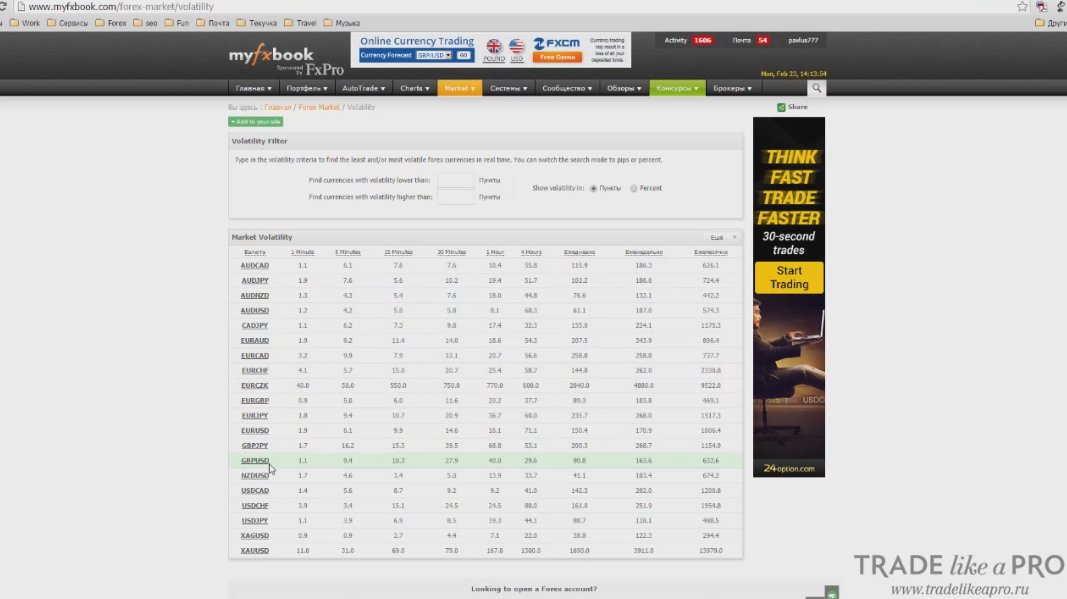 For our GBPUSD pair, we can see volatility: in 1 minute, over 5 minutes, over 15 minutes, and so on. All of this can be used in trading. In addition, here you can switch the point values to percentages, as well as search for pairs with volatility values within specified limits:
If you click the "More" tab, you can add some additional pairs:
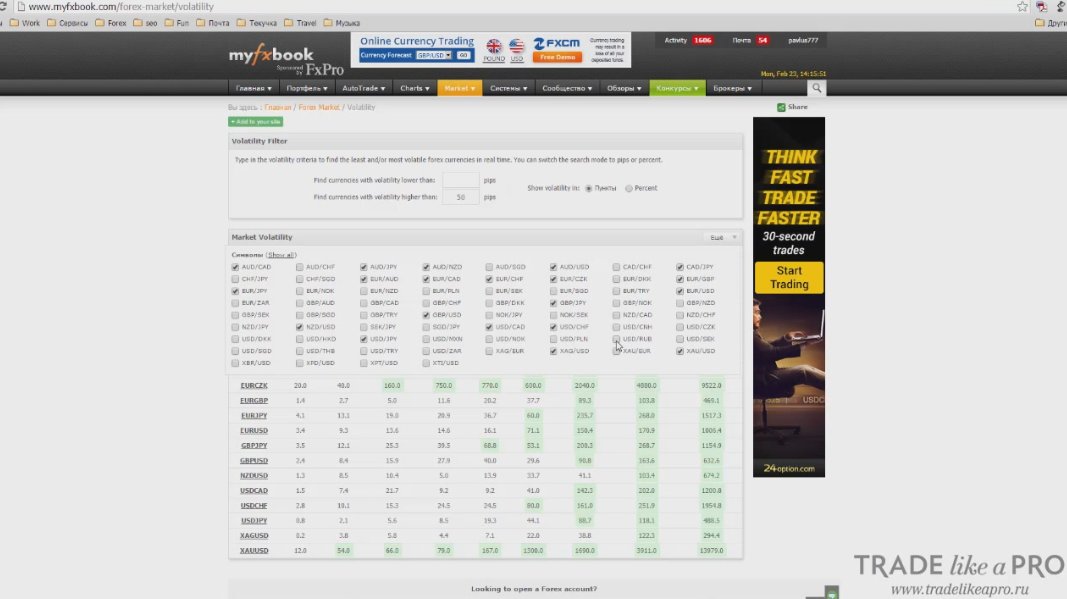 On the service that we looked at above, for example, there is no USDRUB pair, but on this service we can include it in the list:
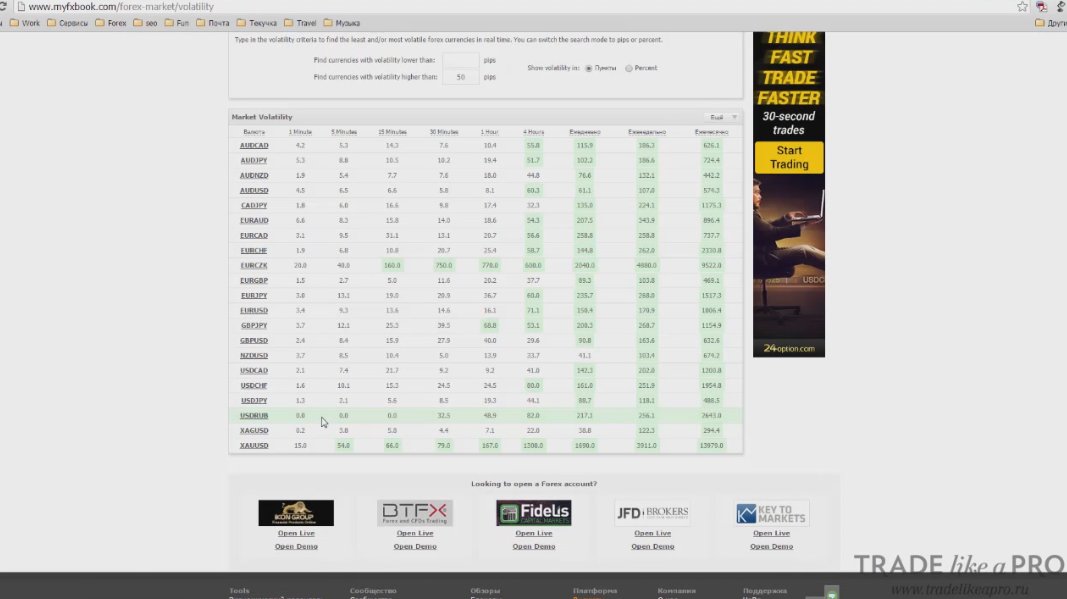 Personally, it is more convenient for me to use Mataf, but you can make it simpler and use both services for work, because their capabilities differ. Myfxbook has minute data, while Mataf has more charts and more detailed information. Use both of these services to build and adjust your strategies.
Indicators Based on Volatility

I will tell you about the standard indicators that are available by default in the terminal.
The first indicator is ATR:
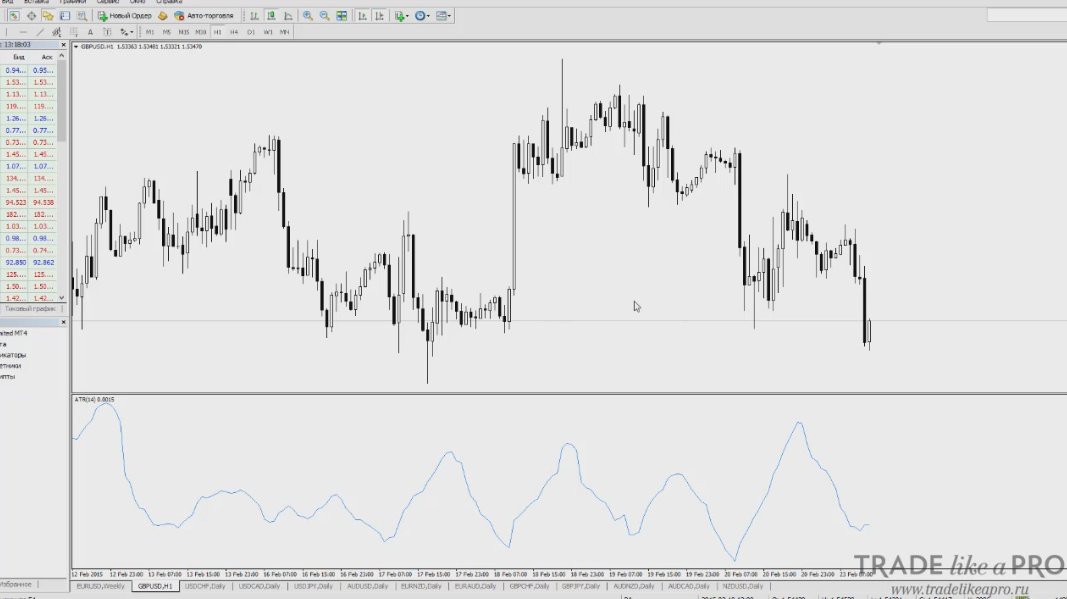 The average true range indicator, invented back in 1972. It shows average volatility and is most often used for setting targets and stop losses. The indicator value is multiplied by some multiplier and in this way the stop loss and/or take profit is calculated. At the same time, the calculations will automatically change depending on the current volatility.
Volatility is higher, the take profit becomes larger. Volatility is lower and the take profit becomes smaller.
The next indicator is CCI:
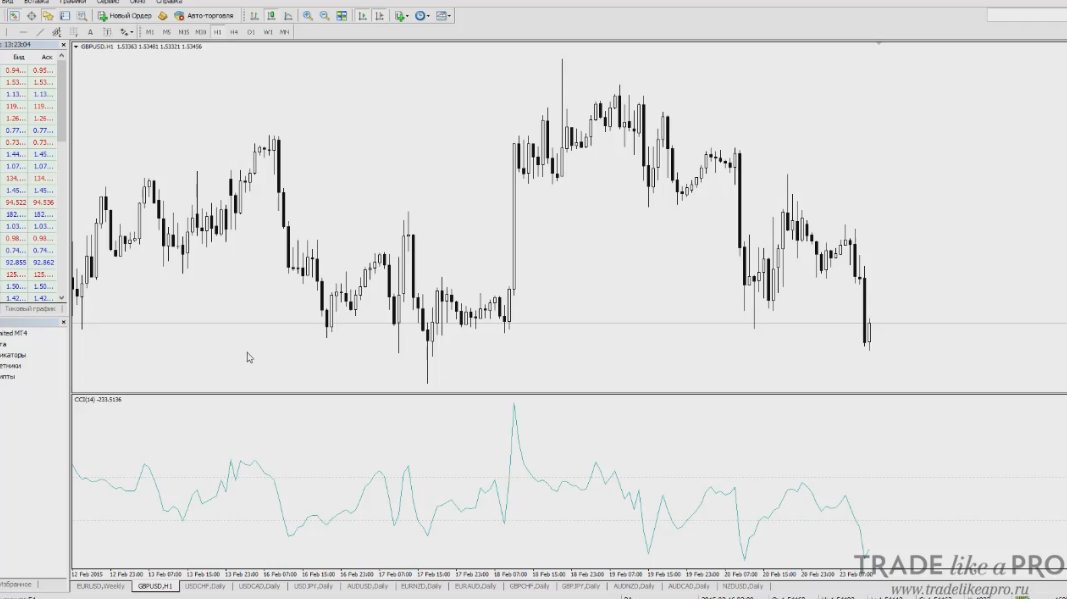 It is based on data on the average price and the moving average. It is used as an oscillator, that is, when it is in the oversold zone it is recommended to buy. And when it is in the overbought zone, to sell.
Another indicator that everyone knows is Bollinger Bands:
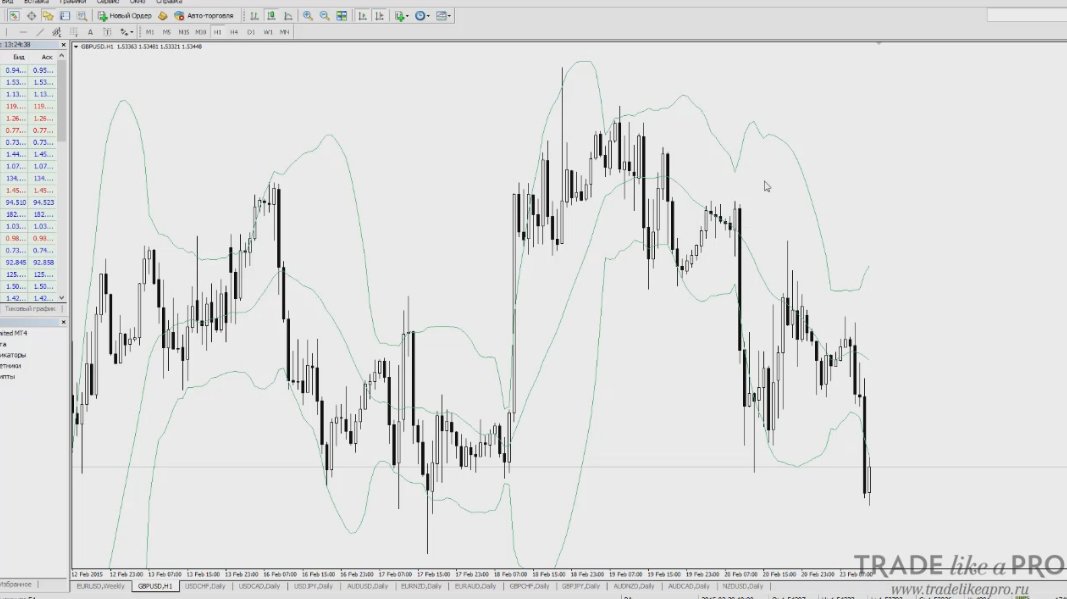 They consist of a standard moving average and a moving average plus and minus the standard deviation, which is calculated based on price. These bands are used most often to determine the boundaries of movement from the standard average. We can draw conclusions from this indicator about the end of a move, a correction, and so on.
In this article I tried to give you an understanding of what volatility is in the forex market and, most importantly, how we can apply it in our trading. I hope that this information will help you in the development and adjustment of your own trading systems.
P.S. Now volatility data can be viewed in the special Volatility Indicator on our website.
Respectfully, Pavel Vlasov
TradeLikeaPro.ru